Correlation in NCSS
NCSS contains a number of tools for analyzing various types of correlations among variables. Each procedure is accurate, validated, and easy to use. Use the links below to jump to a correlation topic. To see how these tools can benefit you, we recommend you download and install the free trial of NCSS. Jump to:- Introduction
- Technical Details
- Correlation (Pearson, Spearman, Kendall's Tau)
- Correlation and Linear Regression
- Correlation Matrix
- Point-Biserial and Biserial Correlations
- Box-Cox Transformation for Simple Linear Regression
- Canonical Correlation
- Cronbach's Alpha in Item Analysis
- Bland-Altman Plot and Analysis
- Lin's Concordance Correlation Coefficient
- Circular Data Correlation
Introduction
In general, the correlation represents the degree of association or statistical relationship among two variables. In its most common usage, correlation represents the degree of the linear relationship. One advantage of the common correlation statistics is that they are unit-less. The population correlation is typically represented by the symbol Rho, while the sample correlation is often designated as r. For typical correlation statistics, the correlation values range from -1 to 1. Correlation values close to -1 indicate a strong negative relationship (high values of one variable generally indicate low values of the other). Correlation values close to 1 indicate a strong positive relationship (high values of one variable generally indicate high values of the other). Correlation values near 0 indicated little relationship among the two variables.Technical Details
This page provides a general overview of the tools that are available in NCSS for analyzing correlation. If you would like to examine the formulas and technical details relating to a specific NCSS procedure, click on the corresponding '[Documentation PDF]' link under each heading to load the complete procedure documentation. There you will find formulas, references, discussions, and examples or tutorials describing the procedure in detail.Correlation (Pearson, Spearman, Kendall's Tau)
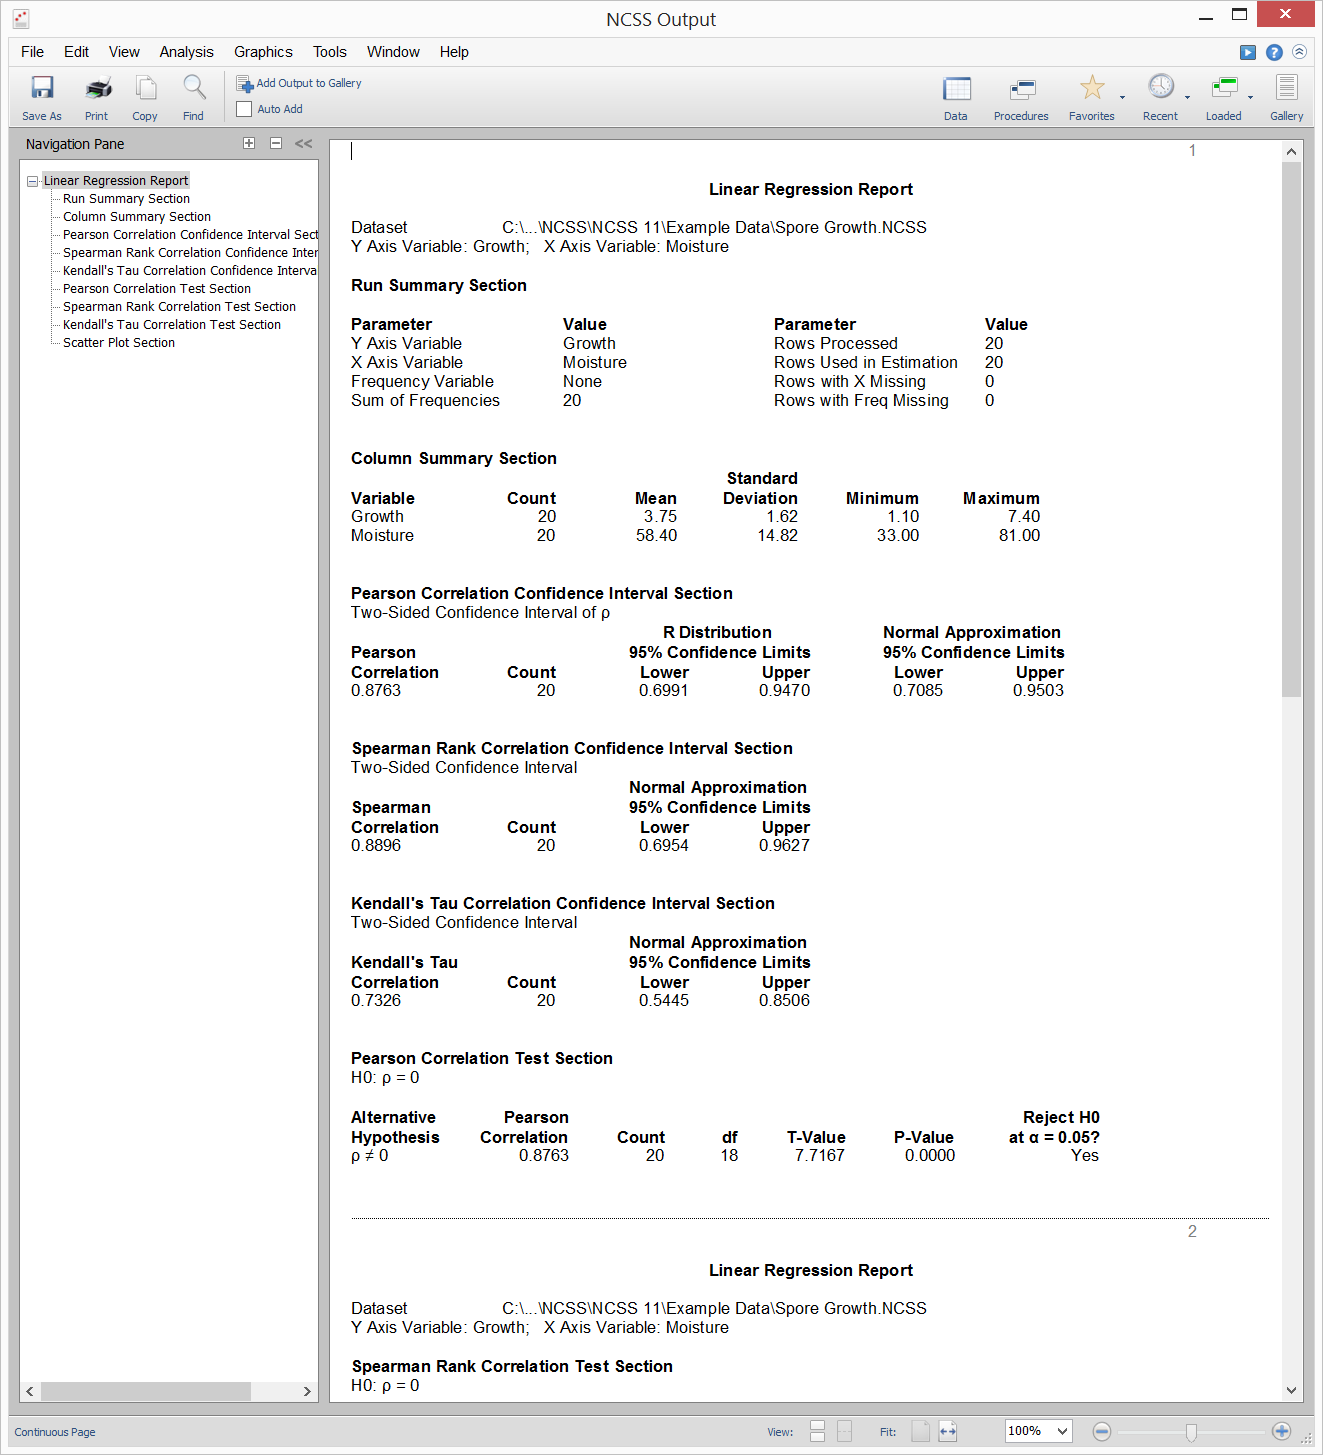
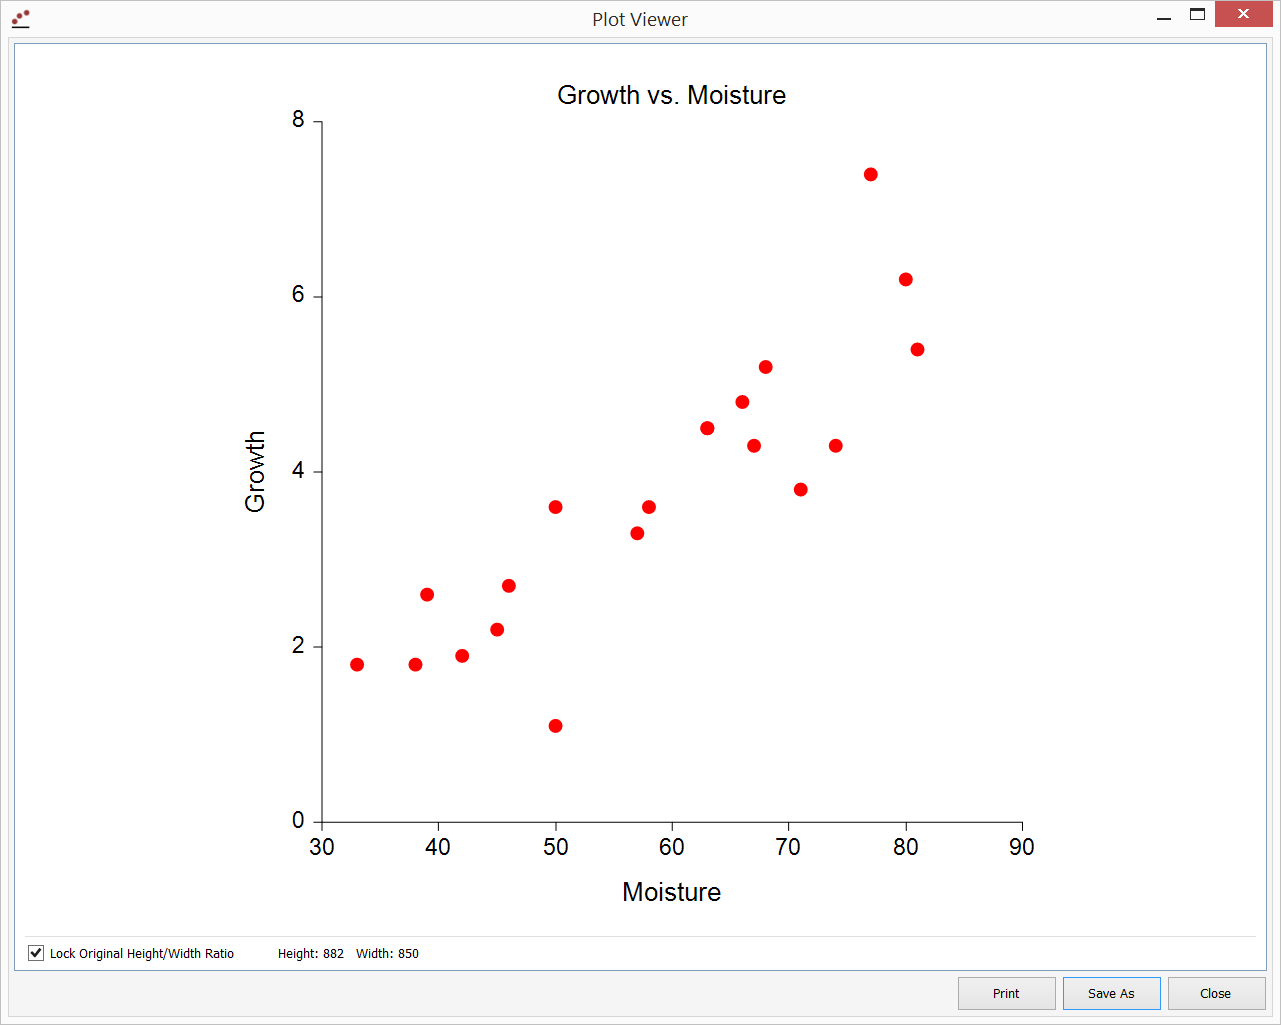
[Documentation PDF]The Pearson correlation is the most common measure of statistical correlation. It measures the linear relationship among two variables. It is sometimes called the product-moment correlation, the simple linear correlation, or the simple correlation coefficient. The Spearman Rank Correlation is a calculation of the correlation based on ranks rather than original values. In this sense, it is a nonparametric alternative to the Pearson correlation. Kendall’s Tau is still another nonparametric correlation based on ranks. It is calculated based on the number of concordant and discordant data pairs, as described in the procedure documentation. The Correlation procedure in NCSS provides statistical estimates of each of the Pearson, Spearman, and Kendall’s Tau correlations, as well as confidence limits, statistical tests, and a scatter plot.
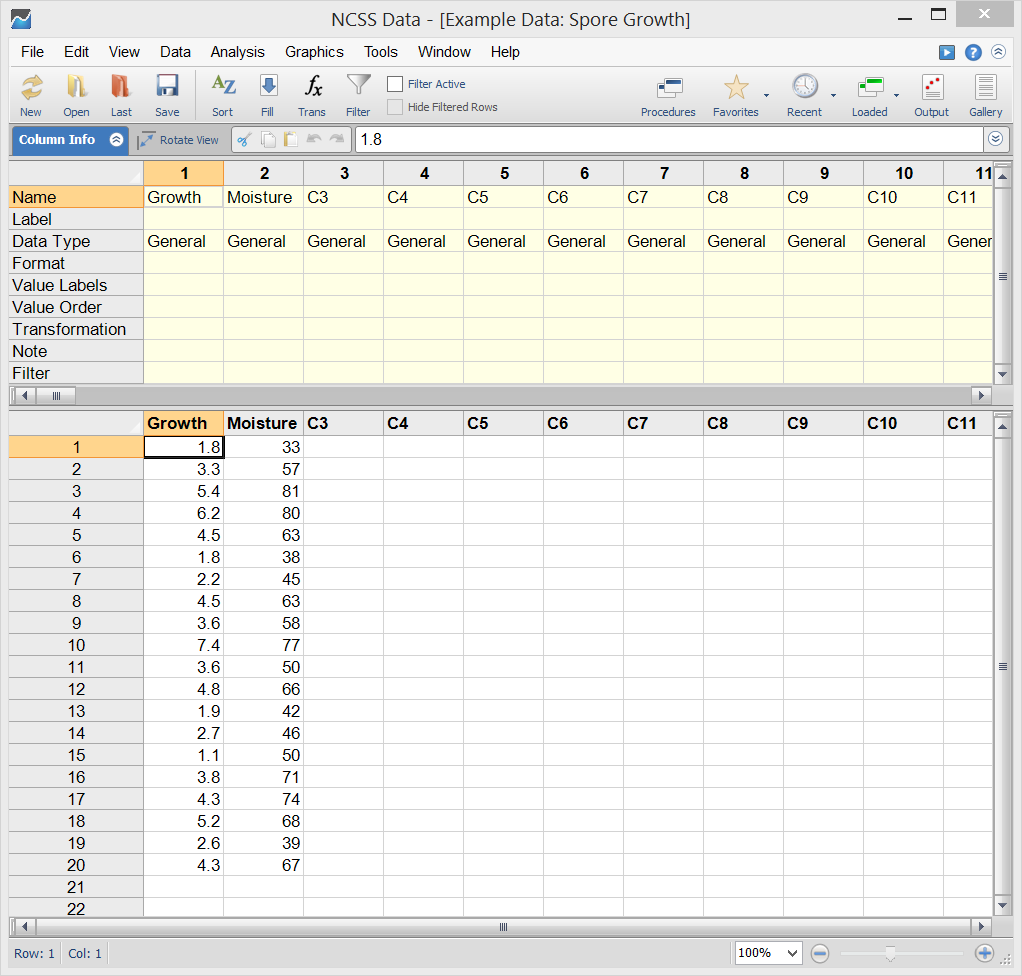
Correlation Example Dataset
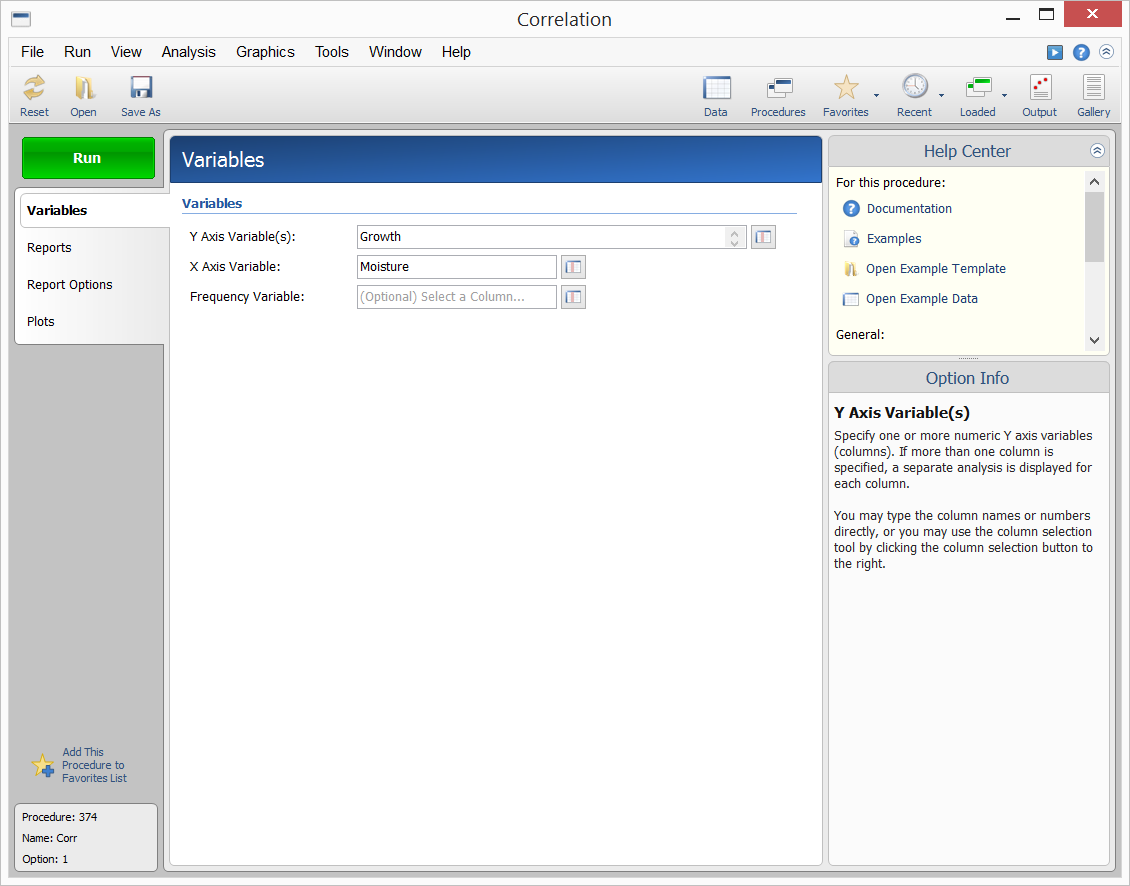
Example Setup of the Correlation Procedure
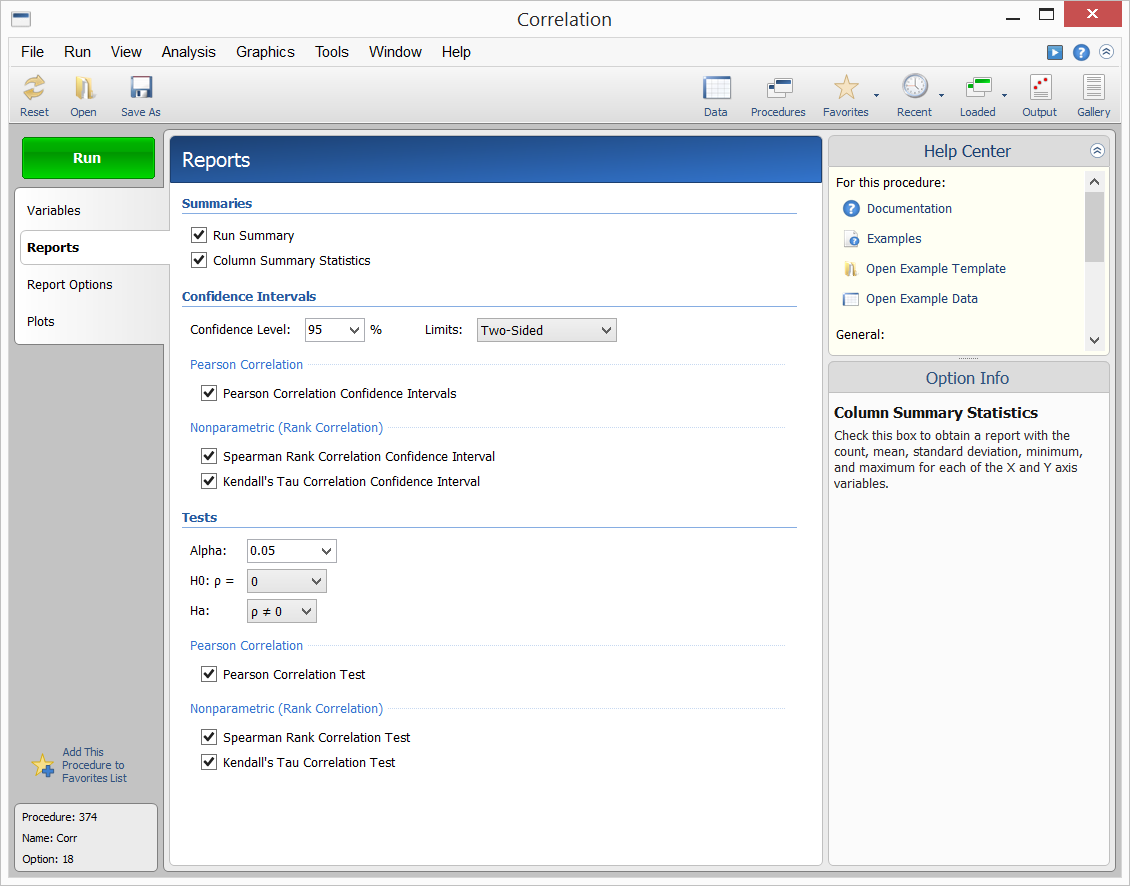
Example Output for the Correlation Procedure
Scatter Plot from the Correlation Procedure
Correlation and Linear Regression
[Documentation PDF]The Correlation and Linear Regression procedure in NCSS gives a broad analysis of the linear relationship among two variables. The correlation statistics given in the output are a small part of the general regression analysis that is produced. The many reports available in this procedure are discussed in Simple Linear Regression and Correlation section of the Regression topic.
Correlation Matrix
[Documentation PDF]For a group of spreadsheet columns representing outcomes for variables, a correlation matrix gives the computed correlation (Pearson or Spearman Rank) for each column pair. Each value in the matrix represents the computed correlation for the corresponding row variable and column variable. The following image shows the correlation matrix output generated in NCSS for the columns YldA, YldB, and YldC:
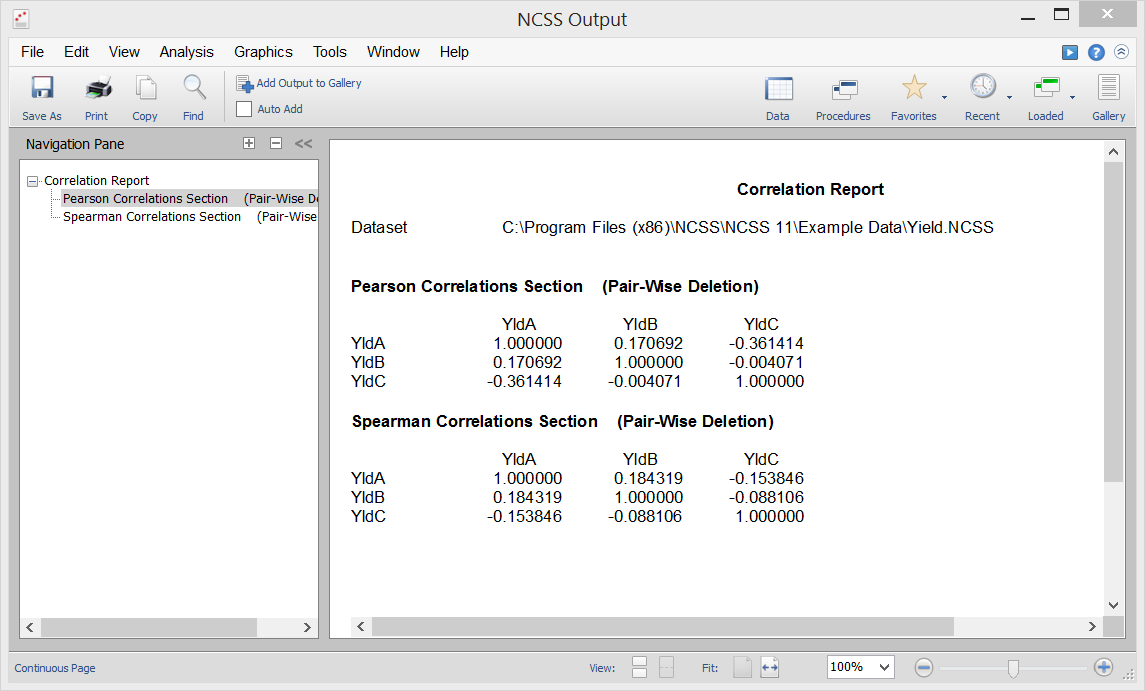 The correlation matrix is often used with the scatter plot matrix, which gives a visual representation of the relationship of each variable pair.
Point-Biserial and Biserial Correlations
[Documentation PDF]The point-biserial correlation is a special case of the product-moment correlation in which one variable is continuous and the other variable is binary (dichotomous). It is assumed that the continuous data within each group created by the binary variable are normally distributed with equal variances and possibly different means. The biserial correlation is used to estimate the product-moment correlation based on the point-biserial correlation. Suppose you have a set of bivariate data from the bivariate normal distribution. The two variables have a correlation, sometimes called the product-moment correlation coefficient. Now suppose one of the variables is dichotomized by creating a binary variable that is zero if the original variable is less than a certain variable and one otherwise. The biserial correlation is an estimate of the original product-moment correlation constructed from the point-biserial correlation. For example, you may want to calculate the correlation between IQ and the score on a certain test, but the only measurement available with whether the test was passed or failed. You could then use the biserial correlation to estimate the more meaningful product-moment correlation. The Point-Biserial and Biserial Correlations procedure in NCSS calculates estimates, confidence intervals, and hypothesis tests for both the point-biserial and the biserial correlations.
Box-Cox Transformation for Simple Linear Regression
[Documentation PDF]This Box-Cox Transformation procedure is used to determine the best transformation to the response variable to satisfy the Normality of residuals assumption for simple linear regression or the Pearson correlation coefficient.
Canonical Correlation
[Documentation PDF]Canonical correlation analysis is the study of the linear relationship between two sets of variables. It is the multivariate extension of correlation analysis. As an example, suppose a group of students have been given two tests of ten questions each and the researcher wishes to determine the overall correlation between these two tests. Canonical correlation finds a weighted average of the questions from the first test and correlates this with a weighted average of the questions from the second test. The weights are constructed to maximize the correlation between these two averages. This correlation is called the first canonical correlation coefficient. The Canonical Correlation procedure in NCSS produces a variety of standard reports in canonical correlation analysis, including the canonical correlations, the variance explained section, the standardized canonical coefficients section, the variable – variate correlations section, the scores section, and scores plots.
Cronbach's Alpha in Item Analysis
[Documentation PDF]Item analysis is used to study the internal reliability of a particular instrument (test, survey, questionnaire, etc.). The reliability of the instrument is determined by whether it produces identical results in repeated applications. A common instrument example consists of several questions (items) answered by a group of respondents. In item analysis, the most popular statistic for assessing instrument reliability (internal consistency) is Cronbach’s alpha. Roughly, Cronbach’s alpha is a correlation in the sense that it estimates the expected correlation of one instrument with another containing the same number of items. Cronbach’s alpha is bound by one on the upper side, with values closer to one indicating greater internal consistency. The Item Analysis procedure produces general item analysis reports with Cronbach’s Alpha being one of the resulting statistics of interest.
Bland-Altman Plot and Analysis
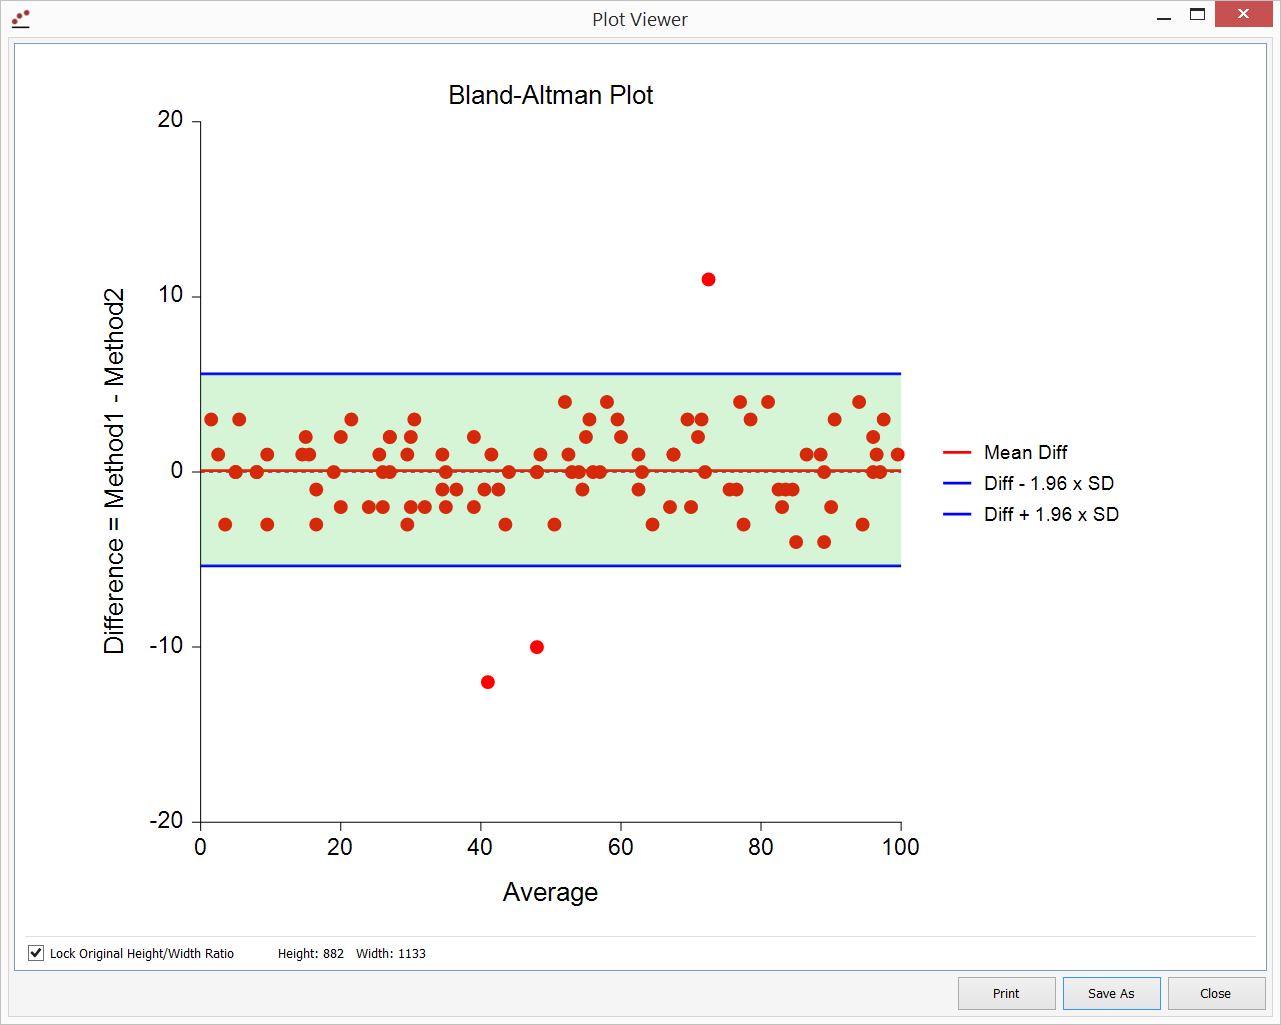
[Documentation PDF]The Bland-Altman (mean-difference or limits of agreement) plot and analysis is used to compare two measurements of the same variable. The Bland-Altman analysis is an improvement over simple correlation analysis for this specific paired data situation.
Lin's Concordance Correlation Coefficient
[Documentation PDF]Lin’s concordance correlation coefficient is used to quantify the agreement between two measures of the same variable. It is often used to determine how well a new test or measurement reproduces a gold standard test or measurement. Like a correlation, Lin’s concordance correlation coefficient ranges from -1 to 1, with perfect agreement at 1. It is bounded above by the absolute value of Pearson’s correlation coefficient. The Lin’s Concordance Correlation Coefficient procedure in NCSS calculates the estimated coefficient as well as one- and two-sided confidence limits.
Circular Data Correlation
[Documentation PDF]Angular data, recorded in degrees or radians, is generated in a wide variety of scientific research areas. Examples of angular (and cyclical) data include daily wind directions, ocean current directions, departure directions of animals, direction of bone-fracture plane, and orientation of bees in a beehive after stimuli. Among many other statistical reports and graphs, the Circular Data Correlation procedure in NCSS produces the estimate of the angular correlation coefficient, as well as a large sample test of whether the correlation is significantly different from zero.
