Diagnostic Tests in NCSS
NCSS includes tools for analyzing binary diagnostic tests based on four different sampling types: a single sample, two independent samples, two paired samples, and clustered samples. The Binary Diagnostic Test procedures are used to calculate, analyze, and compare the sensitivity and the specificity of the diagnostic tests, along with various other summary measures. Confidence intervals, difference and ratio tests, and equivalence tests are available in some of the binary diagnostic test analysis procedures. Use the links below to jump to the diagnostic test topic you would like to examine. To see how these tools can benefit you, we recommend you download and install the free trial of NCSS. Jump to:- Introduction
- Technical Details
- Binary Diagnostic Tests – Single Sample
- Binary Diagnostic Tests – Two Independent Samples
- Binary Diagnostic Tests – Paired Samples
- Binary Diagnostic Tests – Clustered Samples
Introduction
A diagnostic test is used by physicians to help diagnose an illness, injury, disease or any other type of medical condition. In a typical binary diagnostic test, a positive or negative diagnosis is made for each individual patient, subject, or unit and the diagnosis is compared to the known true condition. When this is done there are four possible outcomes: true positive, false positive, true negative, false negative as outlined in the following classification table, where A, B, C, and D are the number of subjects corresponding to each diagnostic classification result.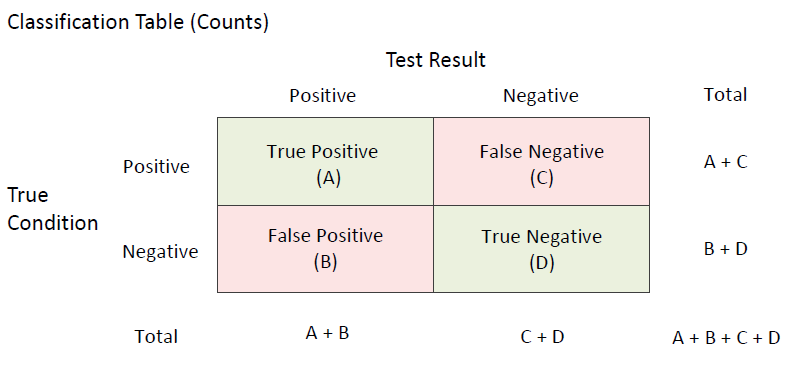 A diagnostic test should be able to differentiate between those that have the disease or condition and those that do not. The most common measures of diagnostic test accuracy are sensitivity (true positive rate) and specificity (true negative rate). Stated differently, the sensitivity of a diagnostic test is the proportion of those that have the condition for which the diagnostic test is positive, and the specificity of a diagnostic test is the proportion of those that do not have the condition for which the diagnostic test is negative. Using the classification table above, the formulas for computing sensitivity and specificity from a sample of diagnostic test results are
- Sensitivity = True Positive Rate (TPR) = A/(A+C)
- Specificity = True Negative Rate (TNR) = D/(B+D)
- False Positive Rate (FPR) = (1-Specificity) = B/(B+D)
- False Negative Rate (FNR) = (1-Sensitivity) = C/(A+C)
- Positive Predictive Value (PPV) = Precision = A/(A+B)
- Negative Predictive Value (NPV) = D/(C+D)
- False Omission Rate (FOR) = C/(C+D)
- False Discovery Rate (FDR) = B/(A+B)
- Prevalence = (A+C)/(A+B+C+D)
- Proportion Correctly Classified = Accuracy = (A+D)/(A+B+C+D)
- Proportion Incorrectly Classified = (B+C)/(A+B+C+D)
- Overall Accuracy = Sensitivity+Specificity
- Positive Likelihood Ratio (LR+) = TPR/FPR = Sensitivity/(1-Specificity)
- Negative Likelihood Ratio (LR-) = FNR/TNR = (1-Sensitivity)/Specificity
- Diagnostic Odds Ratio (DOR) = LR+/LR-
Technical Details
This page is designed to give a general overview of the capabilities of NCSS for analyzing and comparing diagnostic tests. If you would like to examine the formulas and technical details relating to a specific NCSS procedure, click on the corresponding '[Documentation PDF]' link under each heading to load the complete procedure documentation. There you will find formulas, references, discussions, and examples or tutorials describing the procedure in detail.Binary Diagnostic Tests - Single Sample
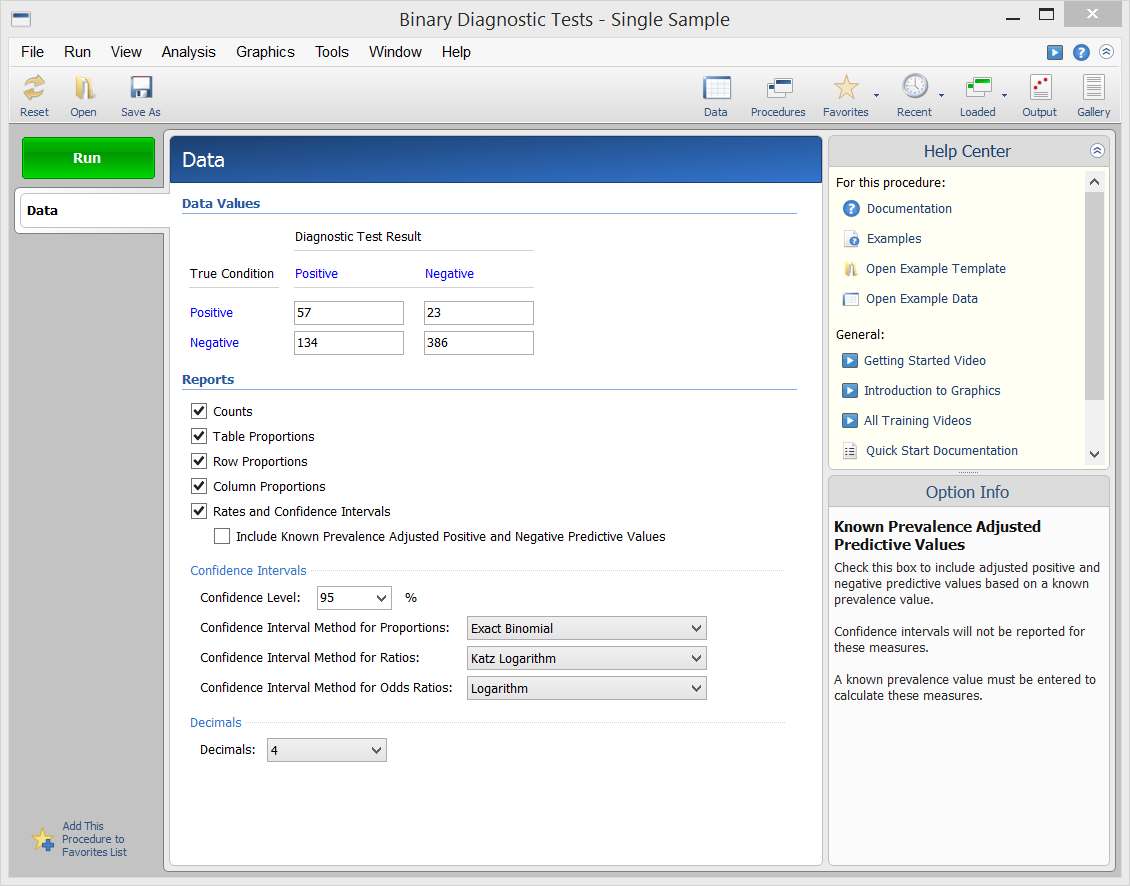
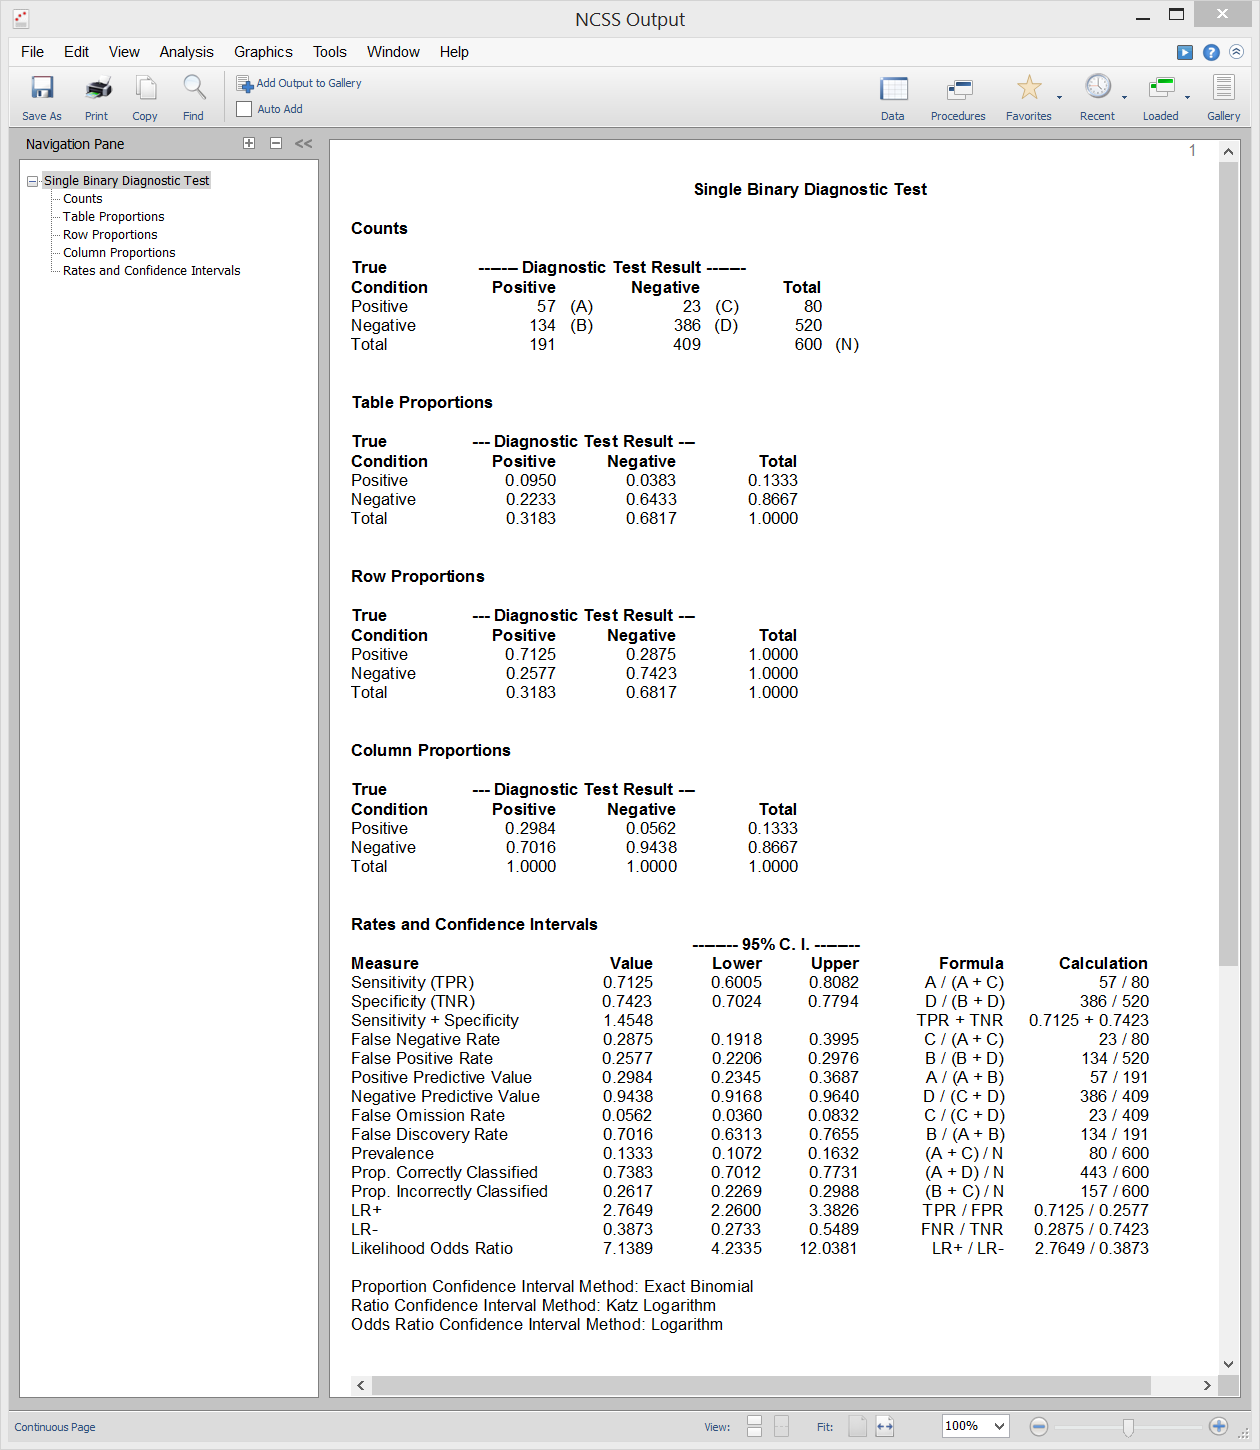
[Documentation PDF]This procedure in NCSS calculates all of the binary diagnostic test statistics mentioned in the introduction above and their associated confidence intervals. Sample input and output from this procedure is given below.
Procedure Input
Sample Output
Binary Diagnostic Tests - Two Independent Samples
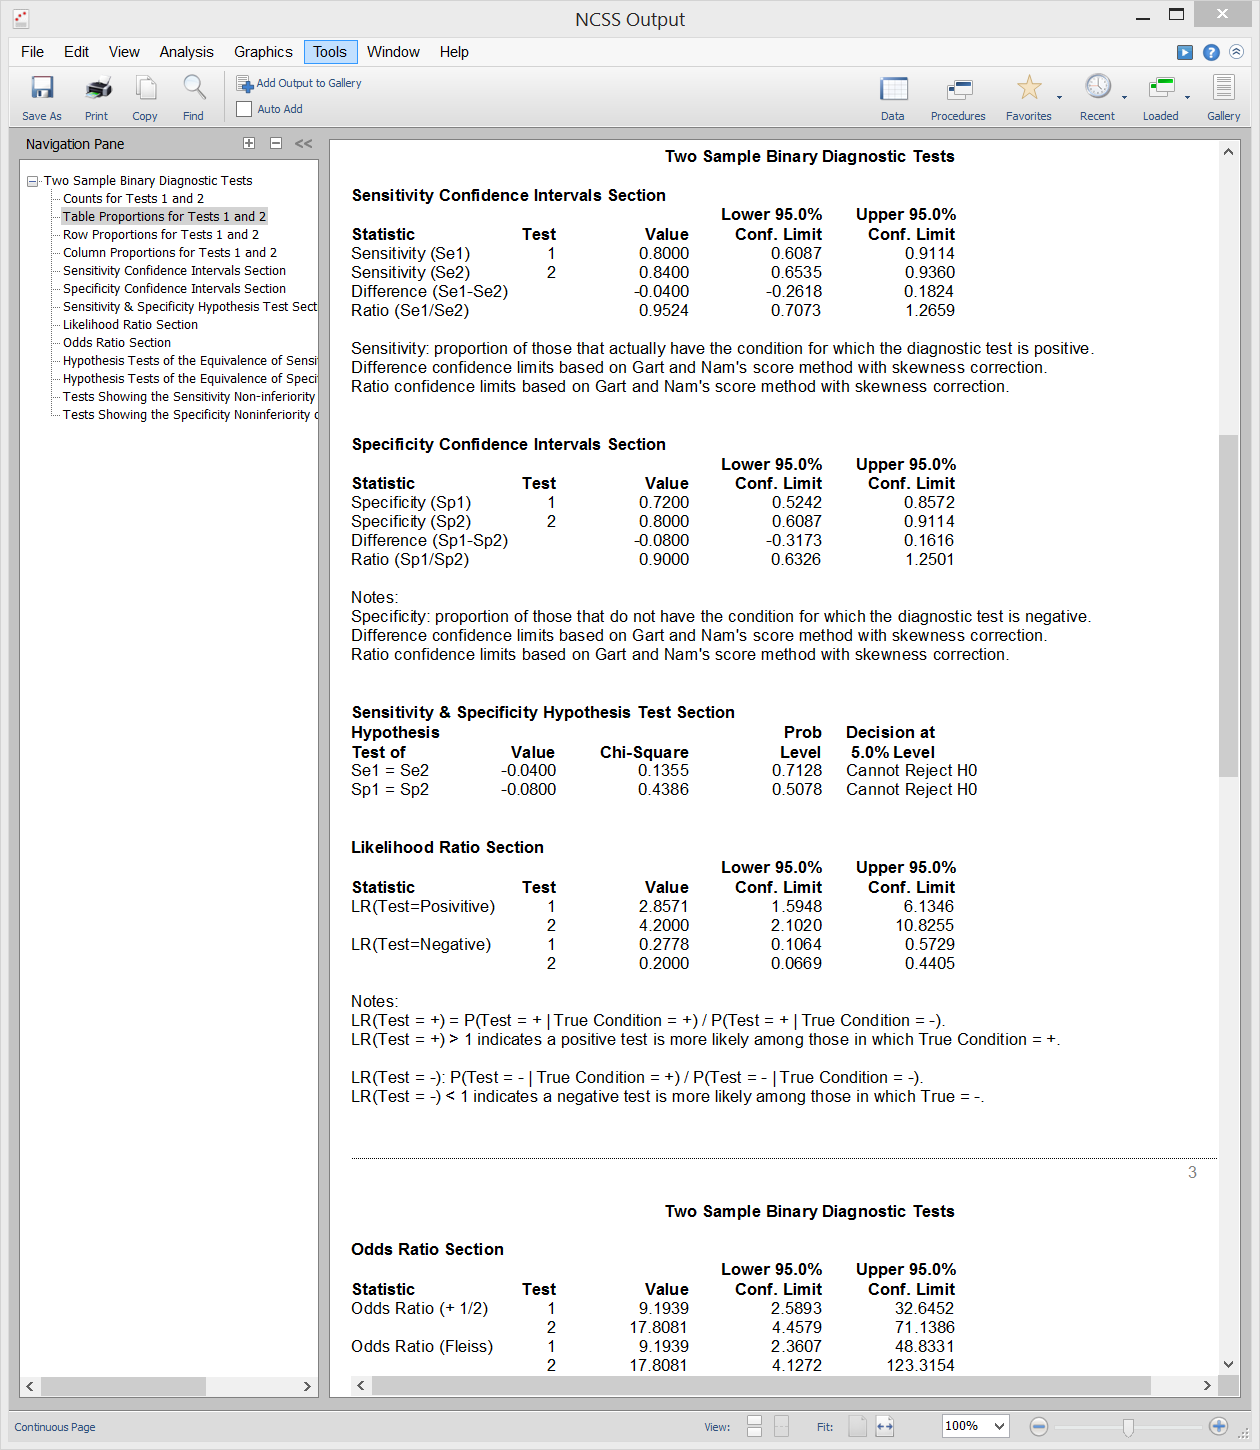
[Documentation PDF]It is often important in diagnostic medicine to compare two diagnostic tests. This can be done by comparing summary measures of diagnostic accuracy such as sensitivity or specificity using a statistical test. An inequality test of difference can be used to show that a new test is different from an existing test. An equivalence test can be used to show that a new test is equal in accuracy to an existing test. A non-inferiority test can be used to show that a new diagnostic test is no worse than the existing test. Sample output from this procedure is given below.
Sample Output
Binary Diagnostic Tests - Paired Samples
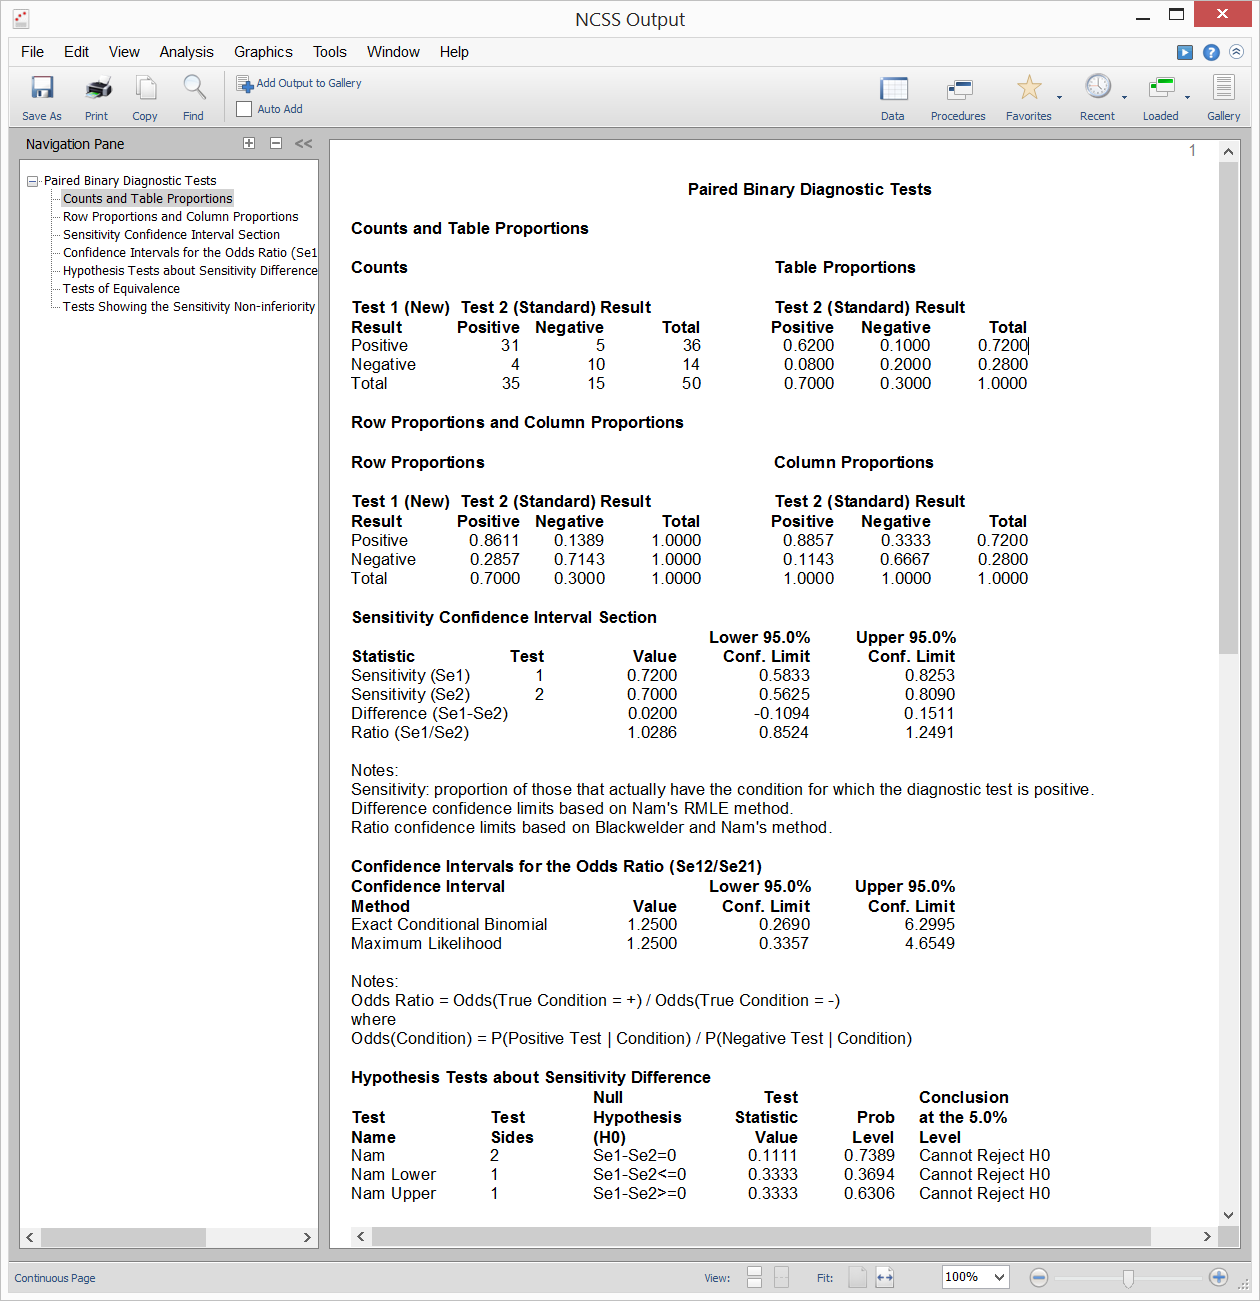
[Documentation PDF]Suppose you draw a random sample of subjects from a population with a particular disease and administered two diagnostic tests to each subject in random order. With this type of paired design, you could compare the sensitivities for the two diagnostic tests using a paired-samples analysis. Inequality, Equivalence, and Non-Inferiority tests are available for this scenario. Sample output from this procedure is given below.
Sample Output
Binary Diagnostic Tests - Clustered Samples
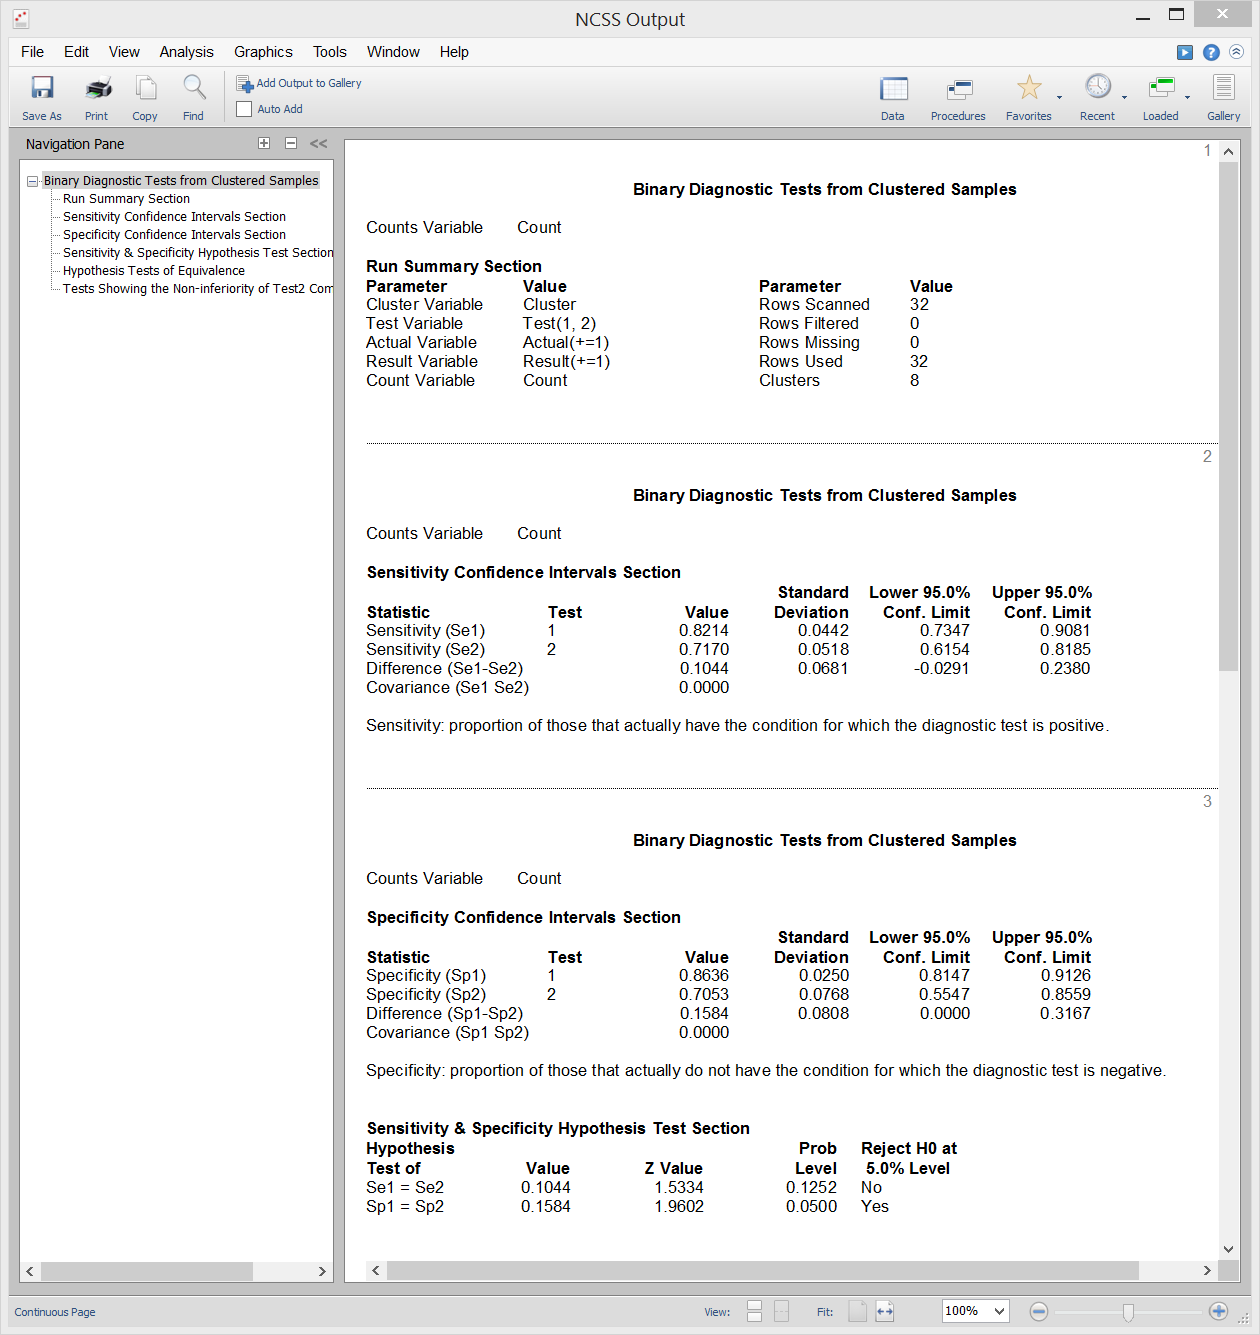
[Documentation PDF]A cluster-randomized trial occurs when whole groups (clusters) of individuals are treated together. Examples of such clusters are clinics, hospitals, cities, schools, or neighborhoods. In the two-group case, each cluster is randomized individually to receive a particular treatment. In the paired case, each group receives both treatments. Each cluster is treated the same. The usual binomial assumptions do not hold for such a design because the individuals within a cluster cannot be assumed to be independent. When the results of a cluster randomization diagnostic trial are binary, the diagnostic accuracy of the tests is commonly summarized using the test sensitivity or specificity. Inequality, Equivalence, and Non-Inferiority tests are available for this scenario. Sample output from this procedure is given below.
Sample Output
