Method Comparison in NCSS
NCSS includes easy-to-use tools for Method Comparison, including Bland-Altman Plot and Analysis, Deming Regression, and Passing-Bablok Regression. All procedures in NCSS are validated for accuracy. Use the links below to jump to the method comparison topic you would like to examine. To see how these tools can benefit you, we recommend you download and install the free trial of NCSS. Jump to:- Introduction
- Technical Details
- Bland-Altman Plot and Analysis
- Deming Regression
- Passing-Bablok Regression
Introduction
Method comparison is used to determine if a new method of measurement is equivalent to another method that is currently in use. The new method might be less-expensive or less-invasive, but the clinician would want to know if the new method gives the same results as the method already being used. Another application of method comparison is to determine how repeatable a measurement system is by re-sampling each subject multiple time using each method.Technical Details
This page is designed to give a general overview of the capabilities of NCSS for method comparison. If you would like to examine the formulas and technical details relating to a specific NCSS procedure, click on the corresponding '[Documentation PDF]' link under each heading to load the complete procedure documentation. There you will find formulas, references, discussions, and examples or tutorials describing the procedure in detail.Bland-Altman Plot and Analysis
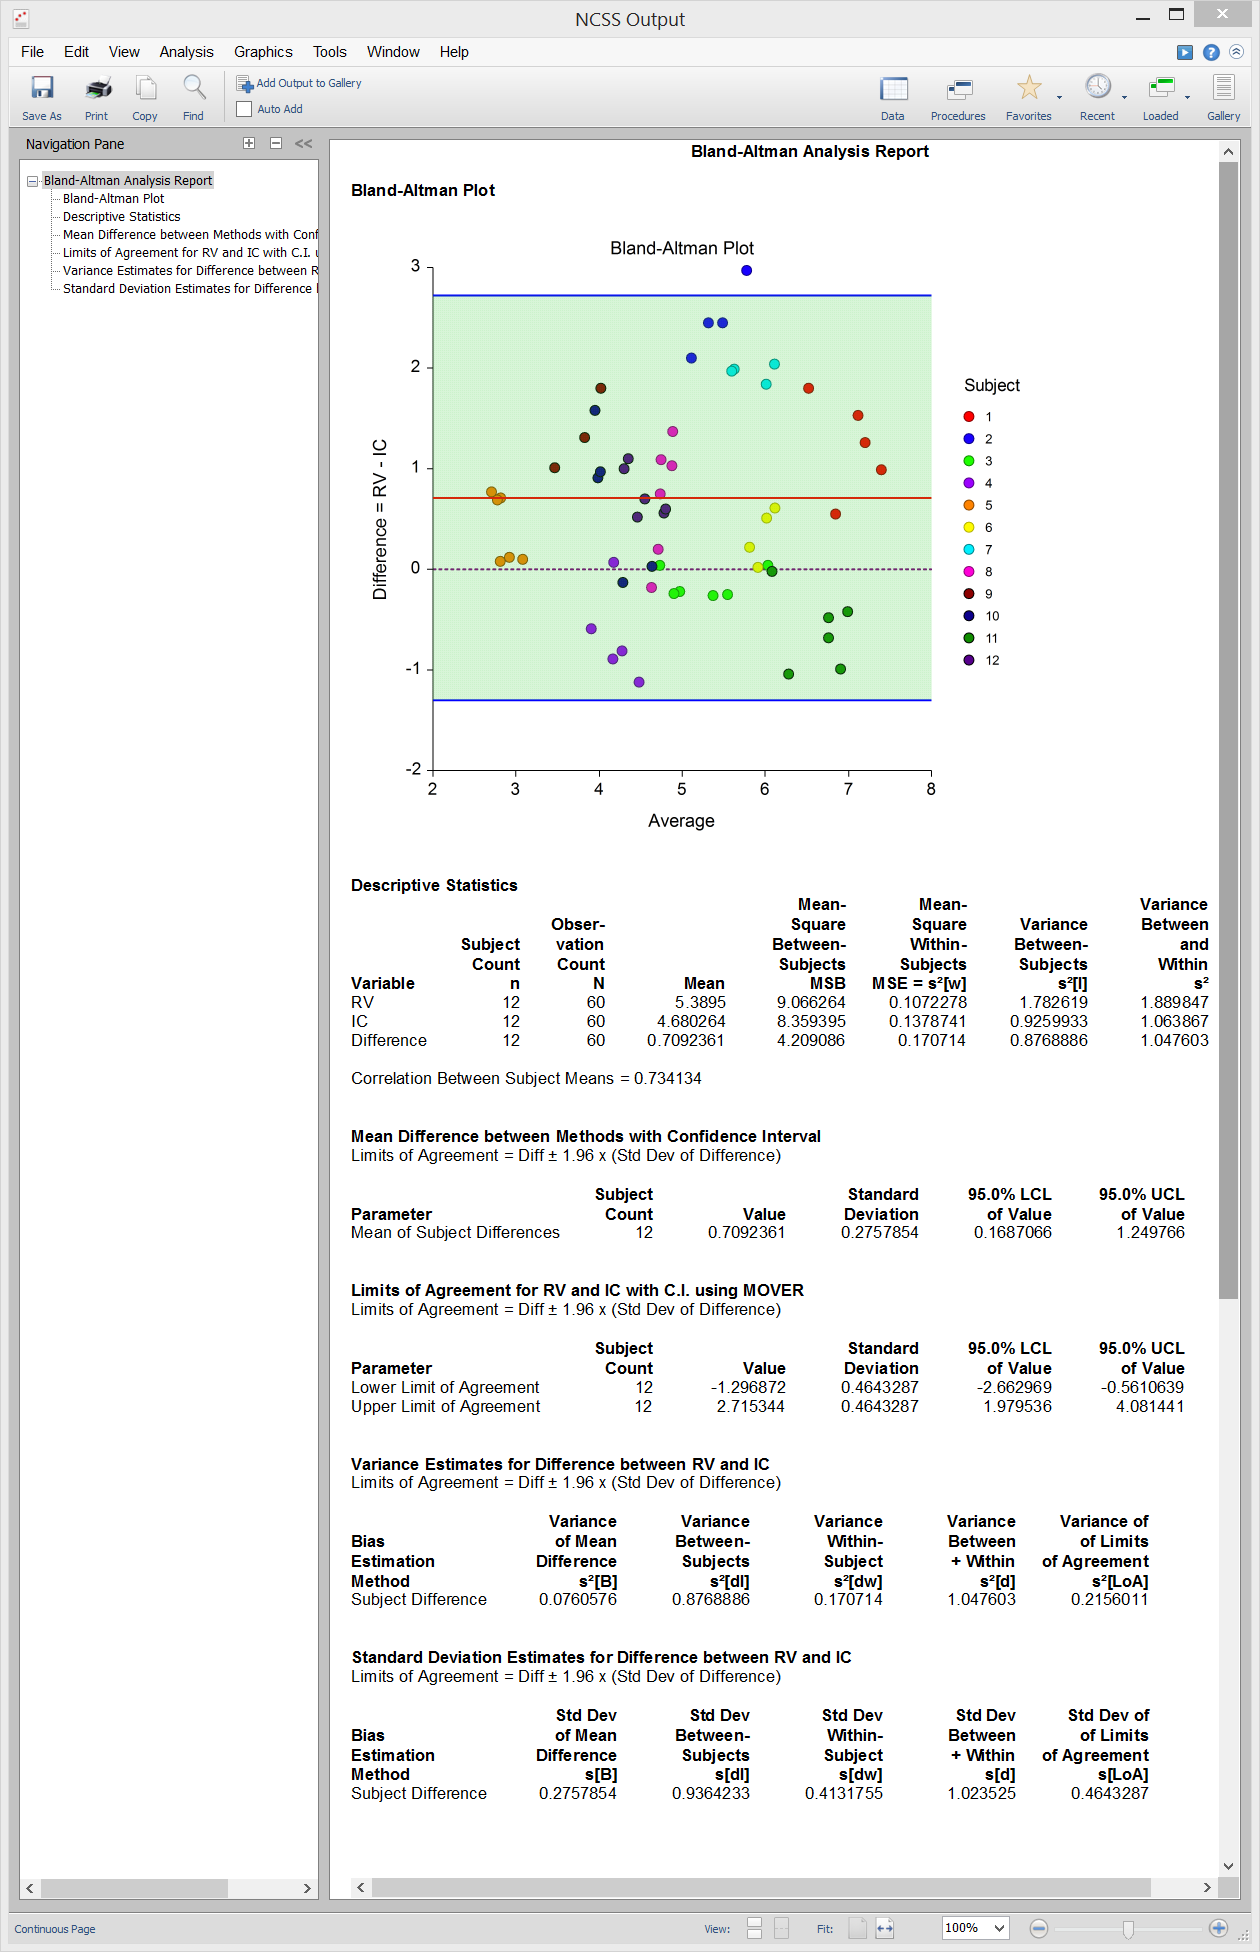
[Documentation PDF]The Bland-Altman Plot (aka mean-difference plot or limits of agreement plot) and Analysis procedure is used to compare two measurement methods for the same variable. The goal is to determine of the two measurement methods give consistent results. For example, an expensive measurement system might be compared with a less expensive one or an intrusive measurement system might be compared to one that is less intrusive. Limits of agreement are calculated to compare the tests. The technique is documented in a series of papers by J. Martin Bland and Douglas G. Altman (1983, 1986, and 1999). There are three study designs that can be analyzed by this procedure. The possible computations and reports depend on the study design.
Design 1: Exactly One Data-Pair per Subject
This is the design that has been used for many years. In this Bland-Altman design, each of the two measurement-methods is measured once on each subject at nearly the same point in time. A big drawback of this design is that no repeatability parameter can be computed.Design 2: Multiple Replicates for each Method, No Pairing
In this Bland-Altman design, each subject is measured several times on one method and then measured several times on the other method. There is no natural pairing of the measures, and the number of replicates does not have to be the same for each method. It is assumed that the overall response mean stays constant throughout the data gathering period.Design 3: Multiple Replicates for each Method Obtained as Pairs
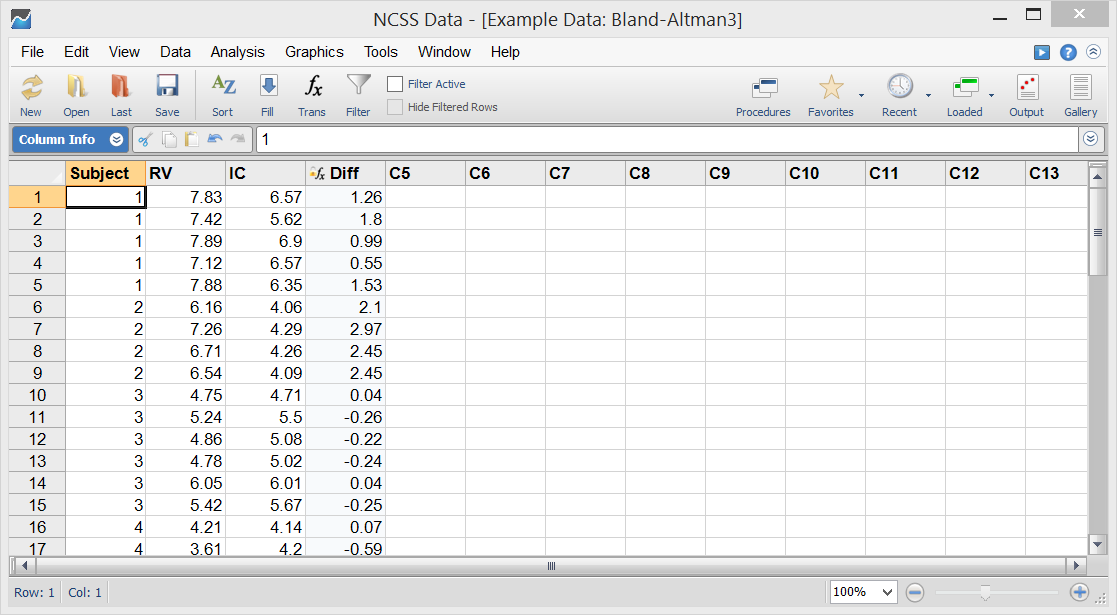
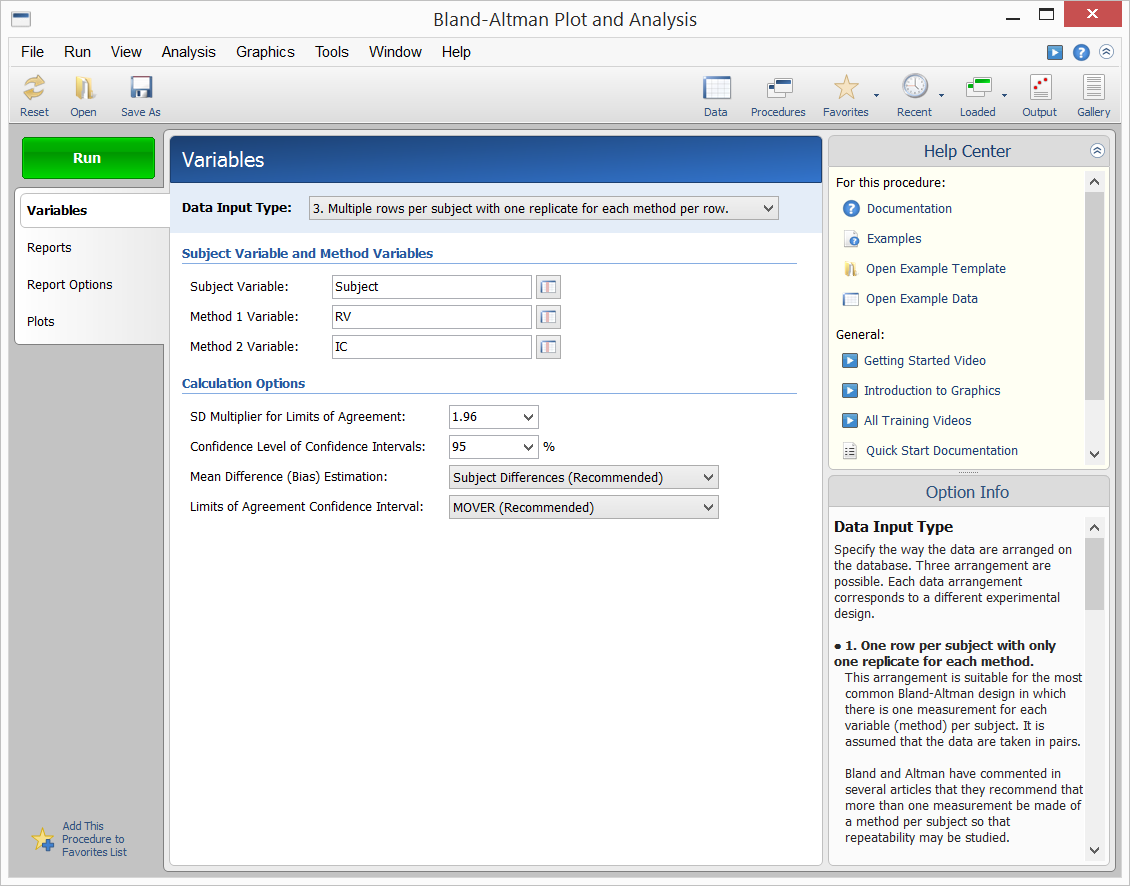
In this Bland-Altman design, each subject is measured by each method several times. At each measurement point, a value for each method is obtained in rapid succession. These are referred to as measurement pairs. It is assumed that the overall response mean varies during the data gathering period.Sample Data
Procedure Input
Sample Output
Deming Regression
[Documentation PDF]Deming regression is a technique for fitting a straight line to two-dimensional data where both variables, X and Y, are measured with error. This is different from simple linear regression where only the response variable, Y, is measured with error. Deming regression is often used for method comparison studies in clinical chemistry or related fields to look for systematic differences between two measurement methods. Deming regression uses paired measurements, (xᵢ, yᵢ), measured with errors, ?ᵢ and ?ᵢ, where
xᵢ = Xᵢ + ?ᵢ
yᵢ = Yᵢ + ?ᵢ
to estimate the intercept, ?₀, and the slope, ?₁, in the equationYᵢ = ?₀ + ?₁*Xᵢ.
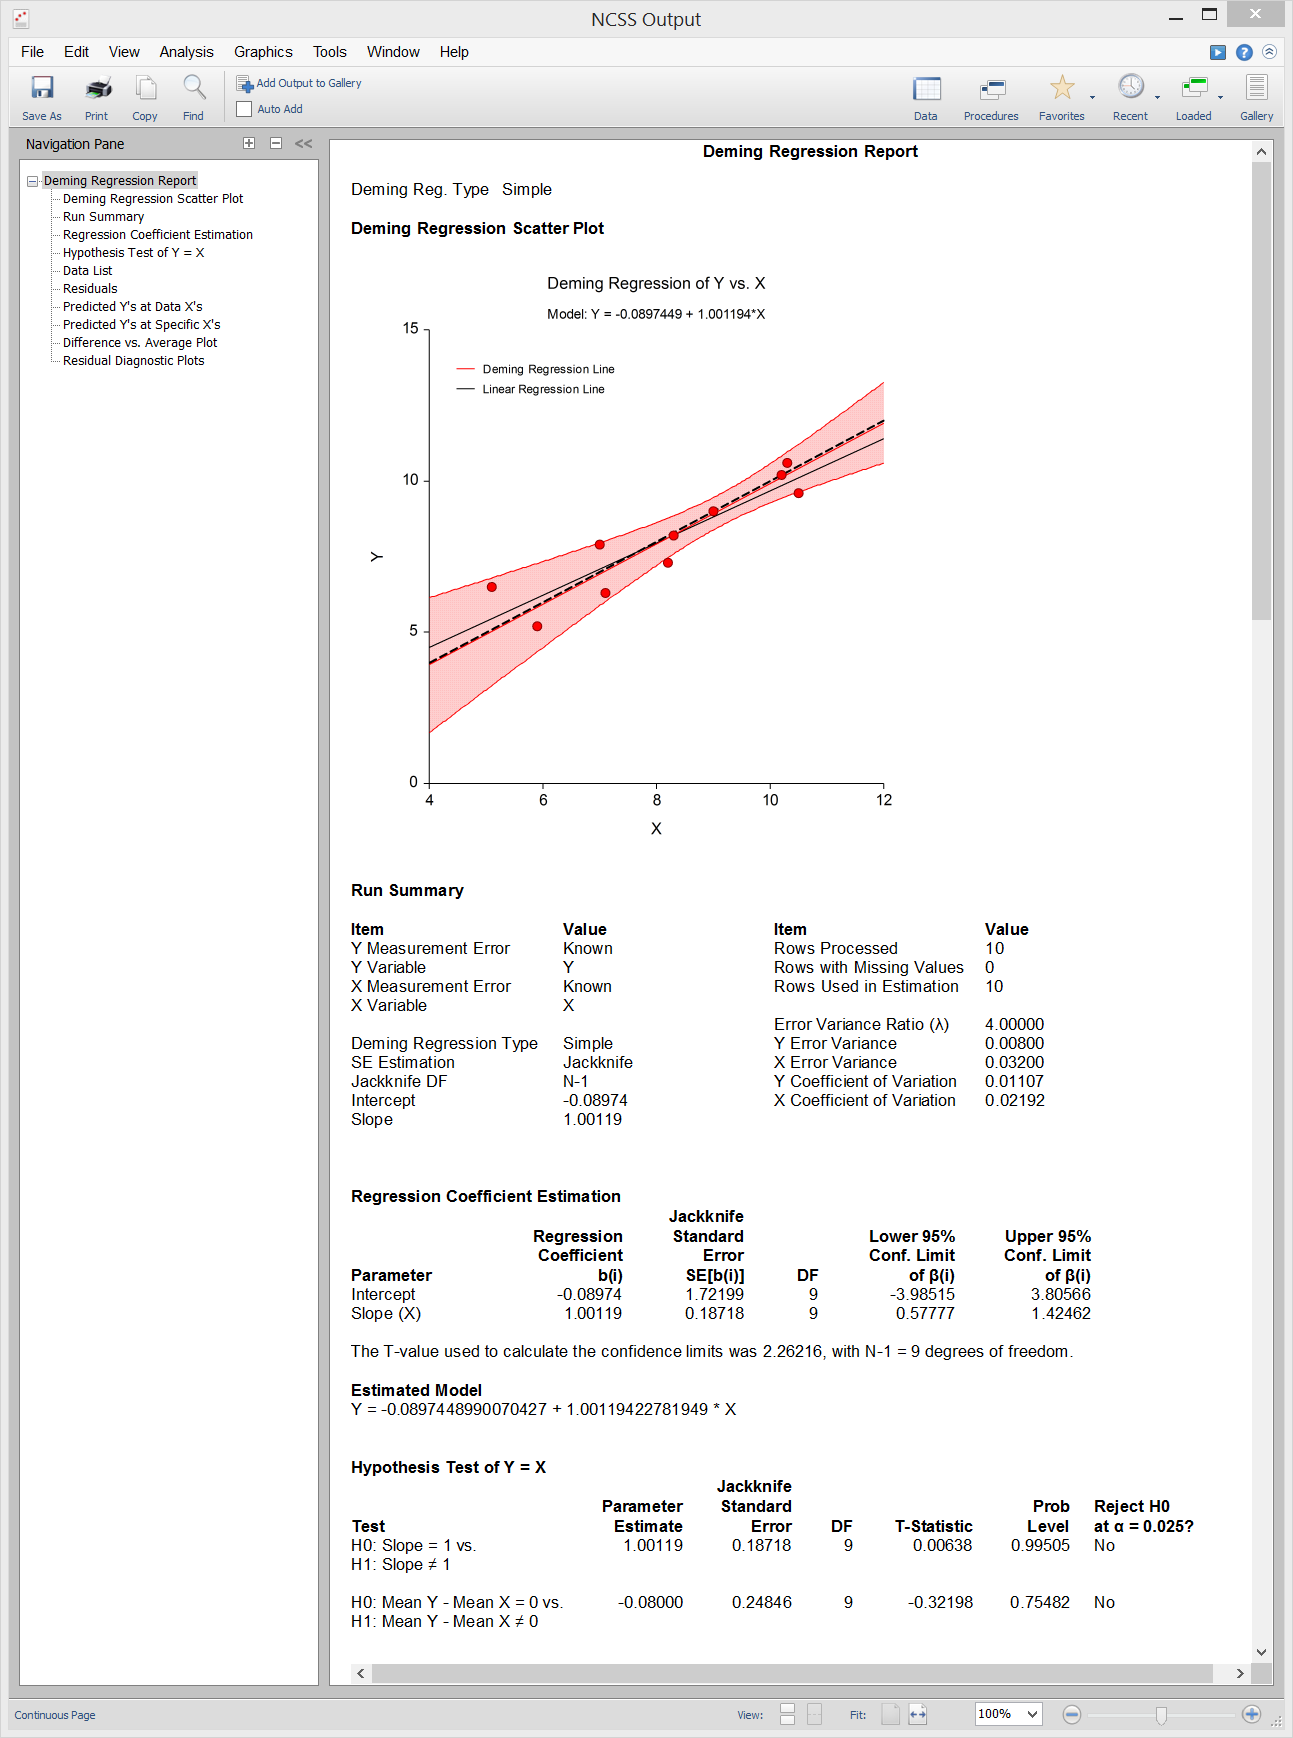
The following is a typical Deming regression plot. The dashed line is the 45° Y=X line of agreement. The black line corresponds to the simple linear regression line. The red line is the Deming regression fit line with associated 95% confidence interval limits. The Deming regression line in this example indicates much better agreement than might be concluded based on the simple linear regression line.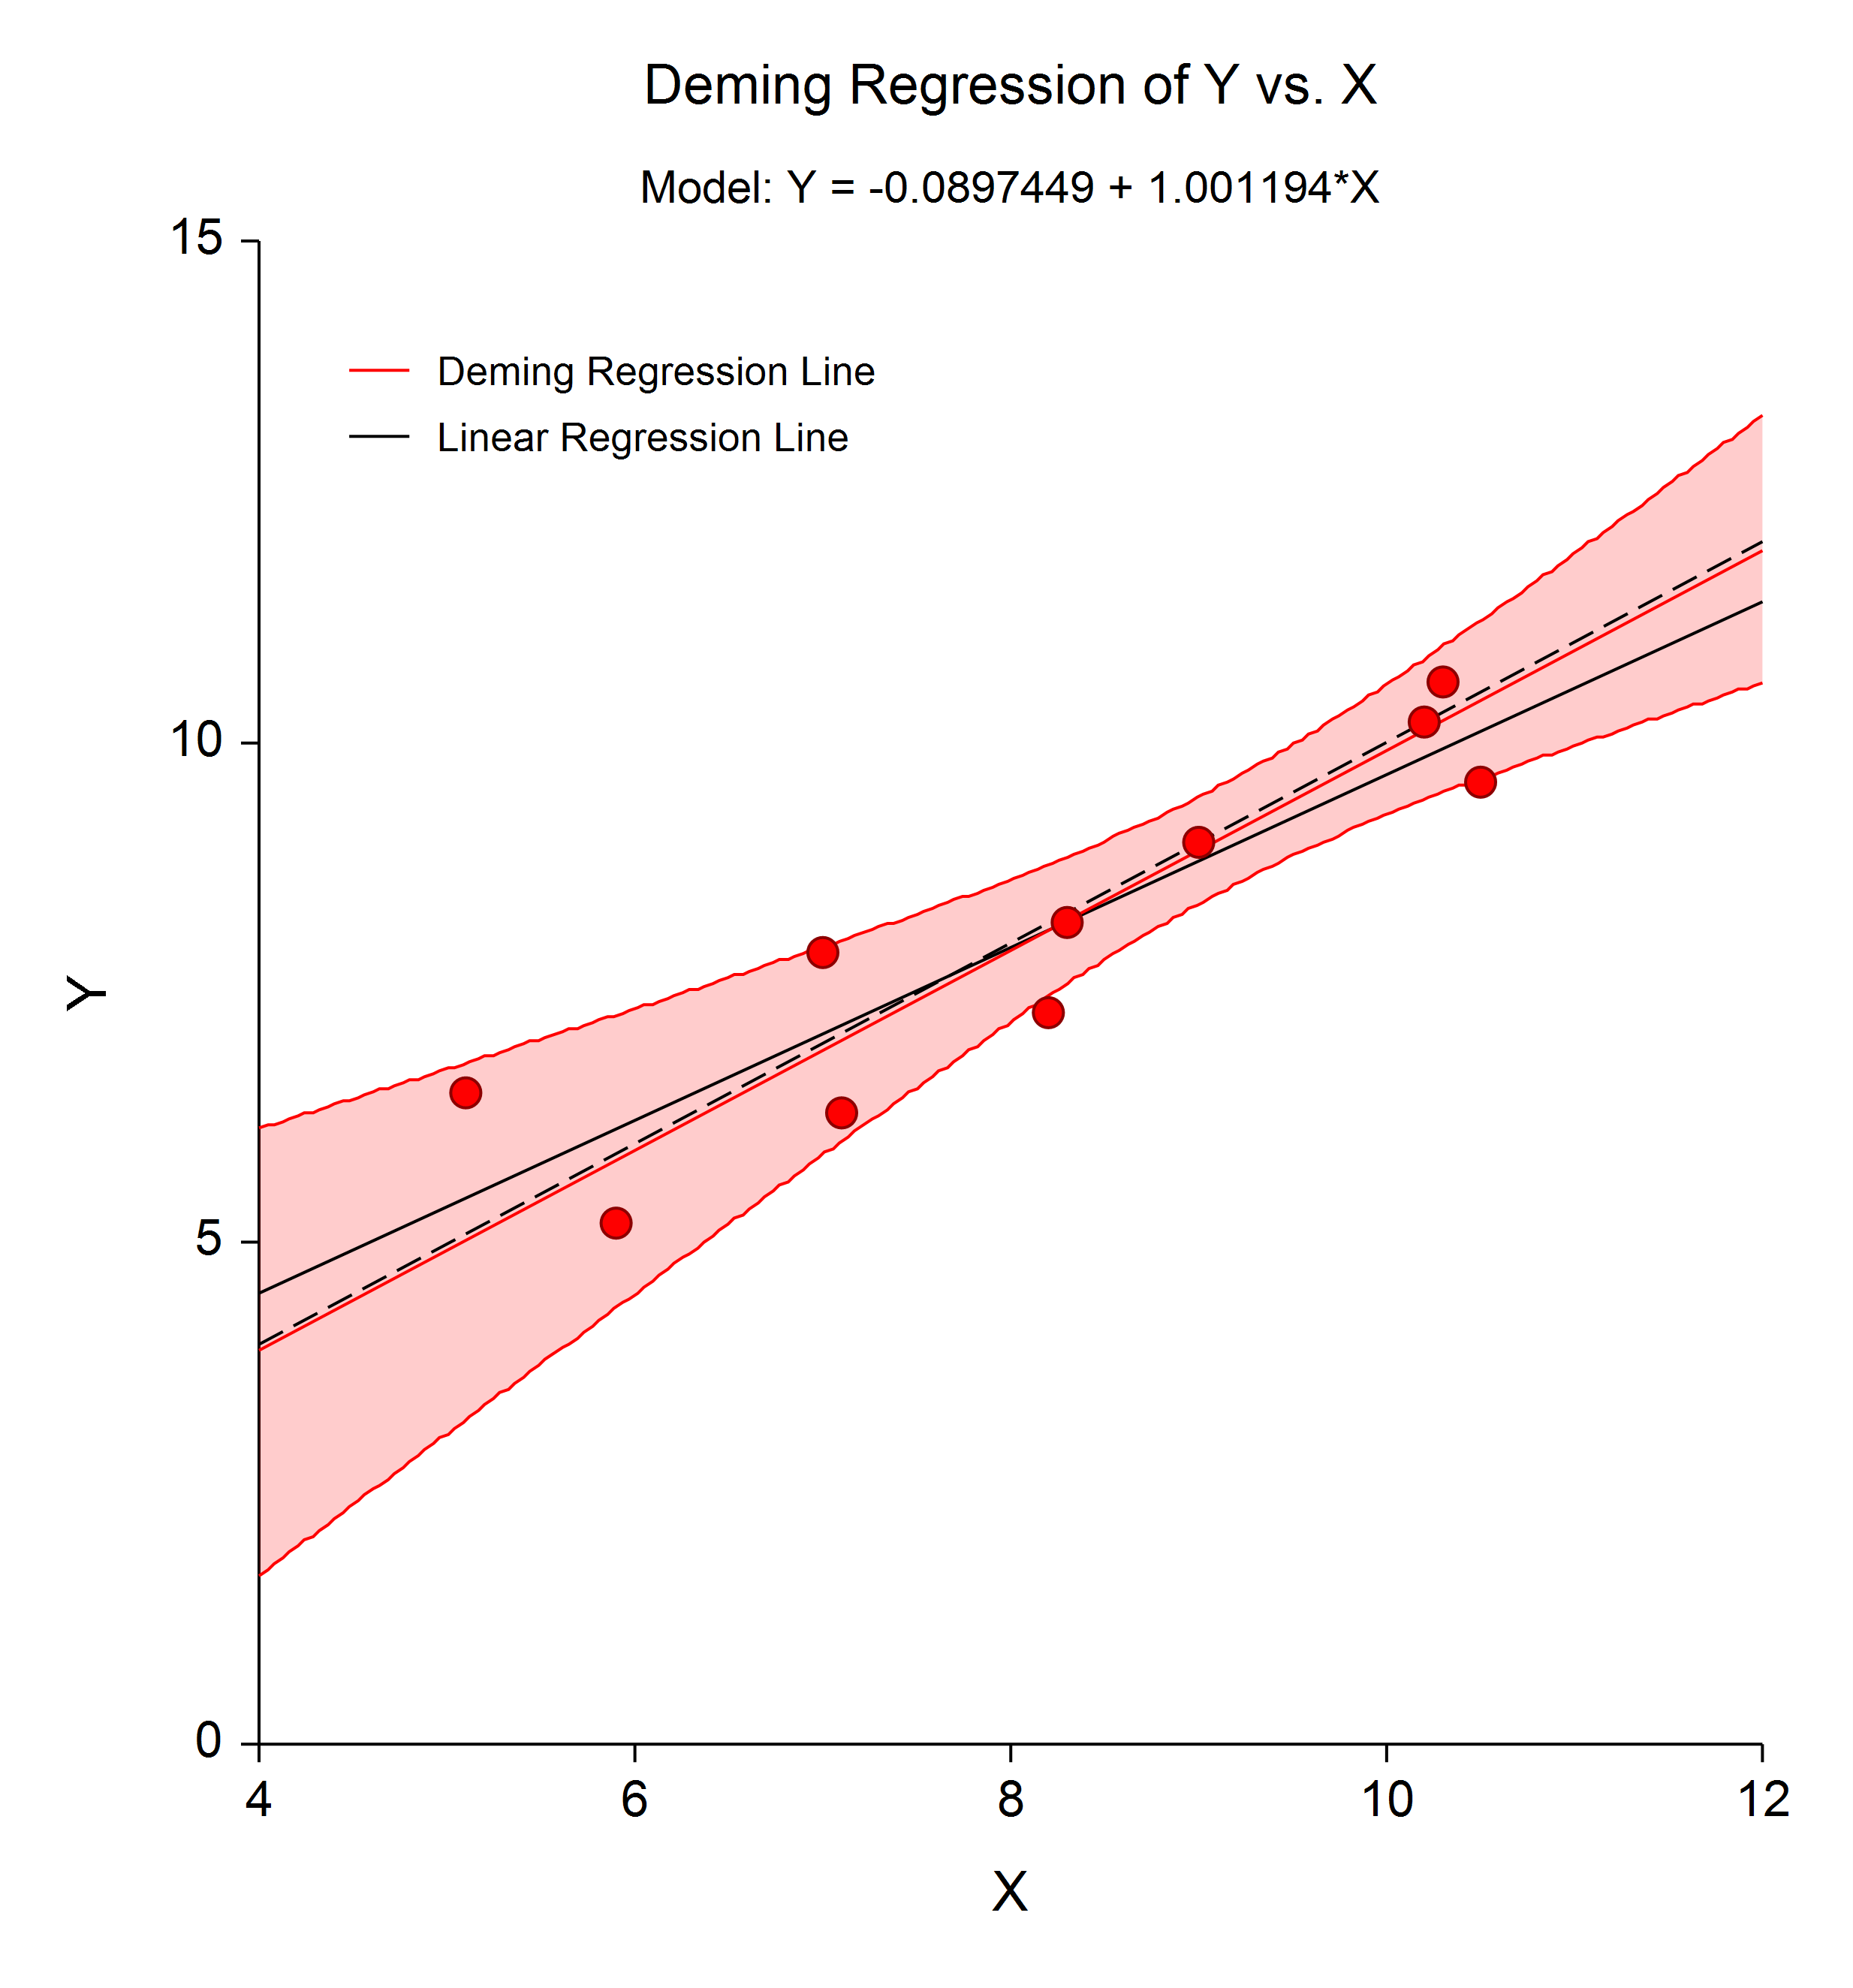 Regression coefficients and predicted values are calculated using the formulas given in Linnet K. (1990). The standard errors of the regression coefficients and predicted values are calculated using the jackknife leave-one-out method. A pair of tests for the overall hypothesis that Y = X is also computed.
Both simple (unweighted) and weighted Deming regression methods are available in the Deming Regression procedure in NCSS. Simple Deming regression should be used when the errors for the two variables are constant. Weighted Deming regression should be used when the errors for the two variables are proportional but not necessarily constant. The procedure requires the user to either input a known error ratio or to provide multiple measurements from each subject so that the error ratio can be estimated from the data. When the error ratio is equal to 1, Deming regression gives the same result as orthogonal regression.
Sample Output
Passing-Bablok Regression
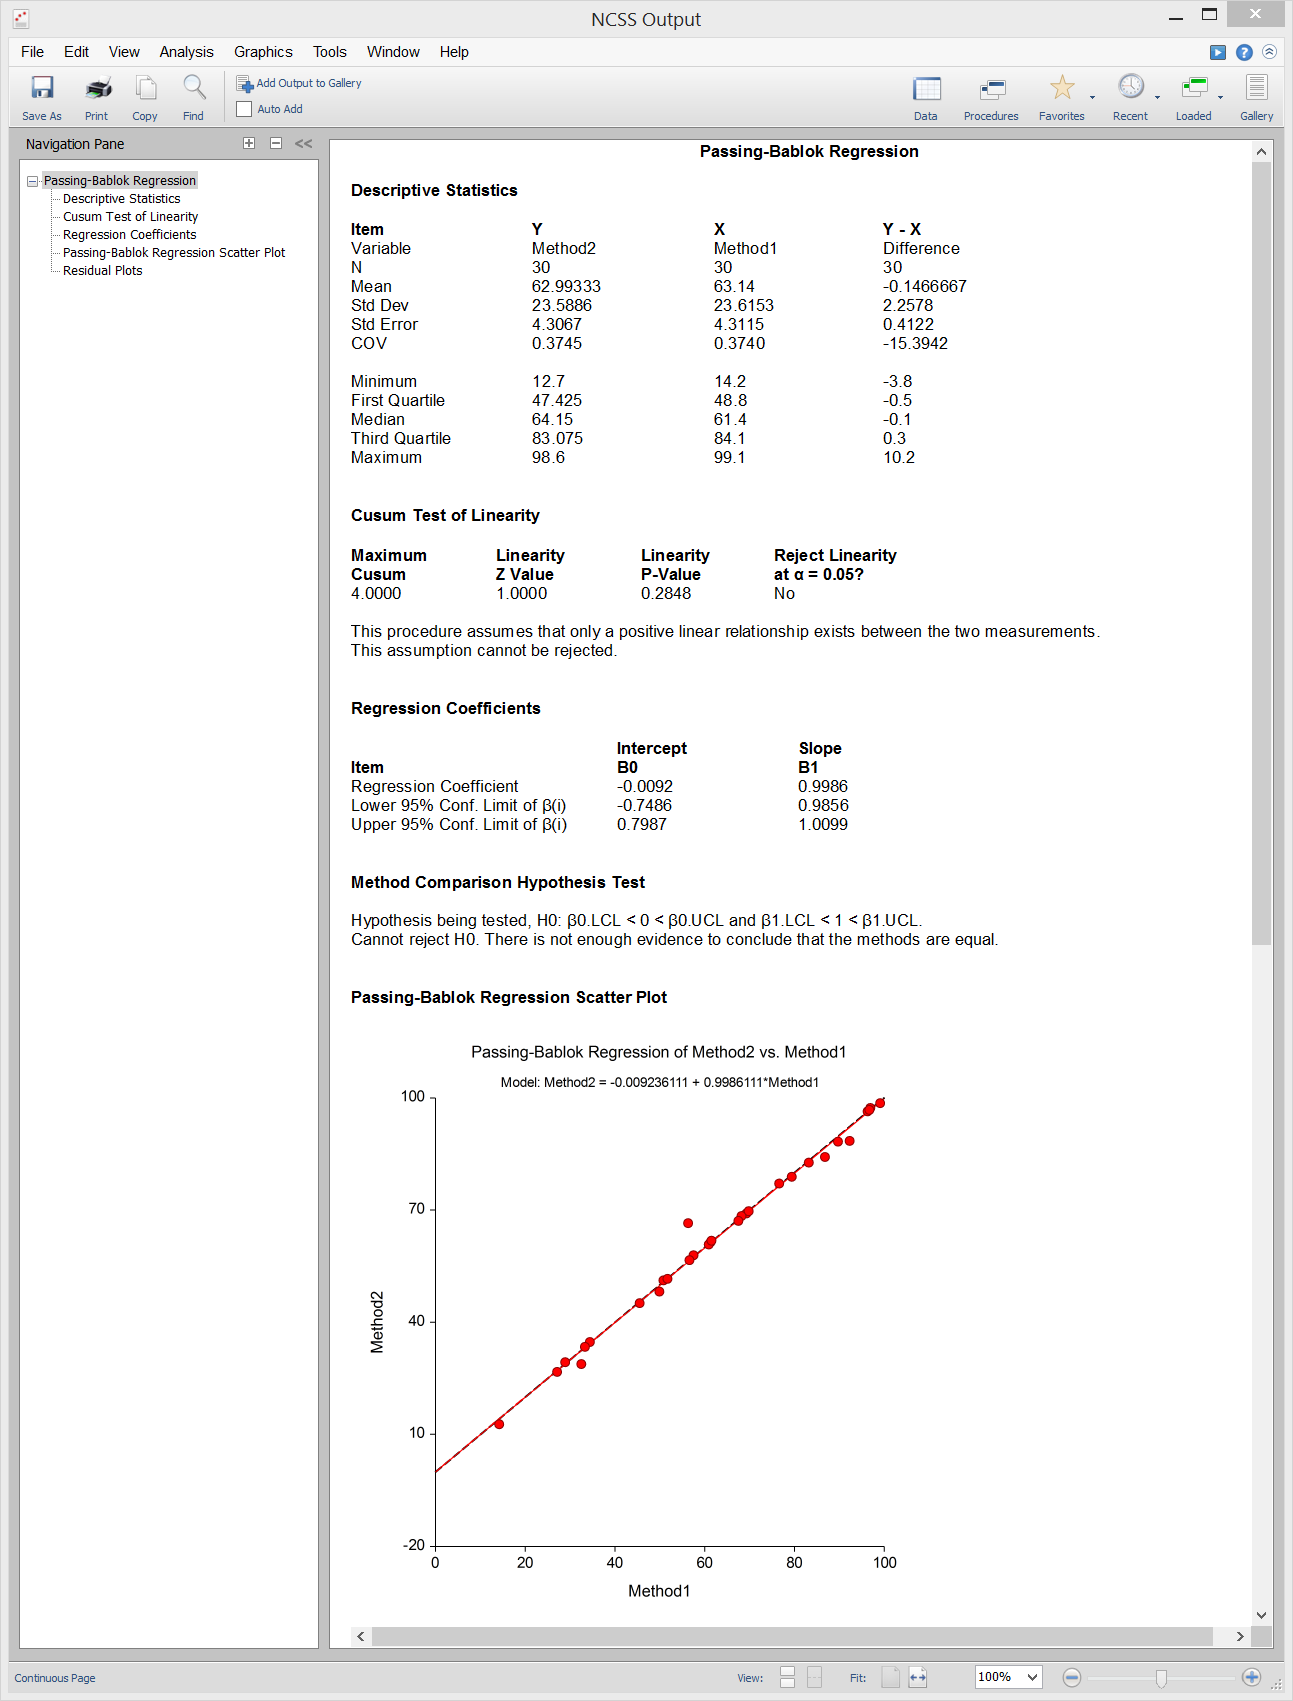
[Documentation PDF]Passing-Bablok Regression for method comparison is a robust, nonparametric method for fitting a straight line to two-dimensional data where both variables, X and Y, are measured with error. It is useful when you have two devices that are expected to give the same measurements and you want to compare them. This is accomplished by estimating a linear regression line and testing whether the intercept is zero and the slope is one. The Passing-Bablok regression procedure fits the intercept, ?₀, and the slope, ?₁, in the linear equation
Y = ?₀ + ?₁*X.
The estimate of the slope (B1) is calculated as the median of all slopes that can be formed from all possible pairs of data points, except those pairs that result in a slope of 0/0 or -1. To correct for estimation bias caused by the lack of independence of these slopes, the median is shifted by a factor K which is the number of slopes that are less than -1. This creates an approximately unbiased estimator. The estimate of the intercept (B0) is the median of {Yᵢ – B1Xᵢ}. The intercept is interpreted as the systematic bias (difference) between the two methods. The slope measures the amount of proportional bias (difference) between the two methods.Sample Output
