Survey Data Analysis in NCSS
NCSS has a wide range of tools for analyzing both categorical and continuous survey data, including descriptive statistics procedures and two-way table analysis procedures. All of the tools in NCSS are validated for accuracy and are easy to learn and use.
Use the links below to jump to the survey data analysis topic you would like to examine. For more details about a particular procedure, we recommend you
download and install the free trial of the software.
Jump to:
Introduction
Surveys often result in large amounts of data. To analyze and communicate the results of a survey, one must summarize the data into tables and graphs that are easy to understand and that accurately convey the results. Furthermore, to take action based on a survey, one might need convincing statistical evidence of a particular outcome related to the survey. NCSS has easy-to-use, yet powerful tools for summarizing, analyzing, and graphically displaying survey data.
Technical Details
This page is designed to give a general overview of the capabilities of NCSS for analyzing survey data. If you wish to see the formulas and technical details relating to a particular NCSS procedure, we recommend you
download and install the free trial of the software, open the procedure of interest, and click on the help button in the top right corner to view the complete documentation of the procedure. There you will find references, formulas, discussions, and examples/tutorials describing the procedure in detail.
Two-Way Contingency Tables (Crosstabs / Chi-Square Test)
The Contingency Tables procedure in NCSS is very useful for summarizing, analyzing, and displaying categorical survey data.
Click here for more information about the Two-Way Contingency Tables procedure in NCSS.
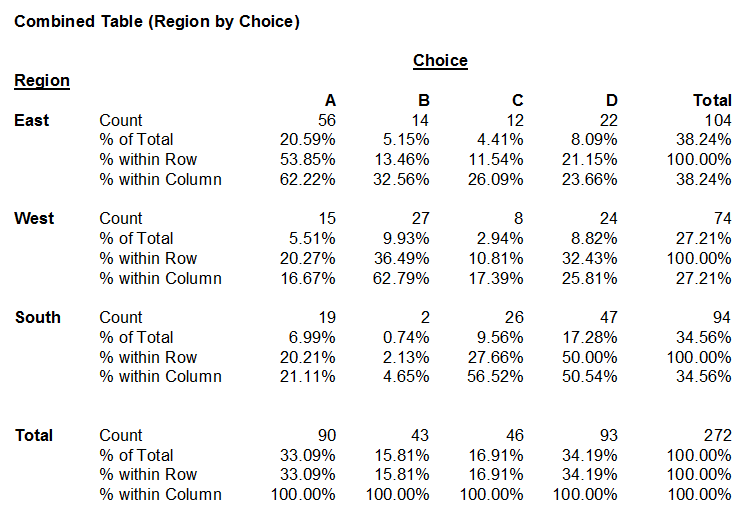
The following is an example of a two-way contingency table from NCSS that summarizes some fictitious survey data:
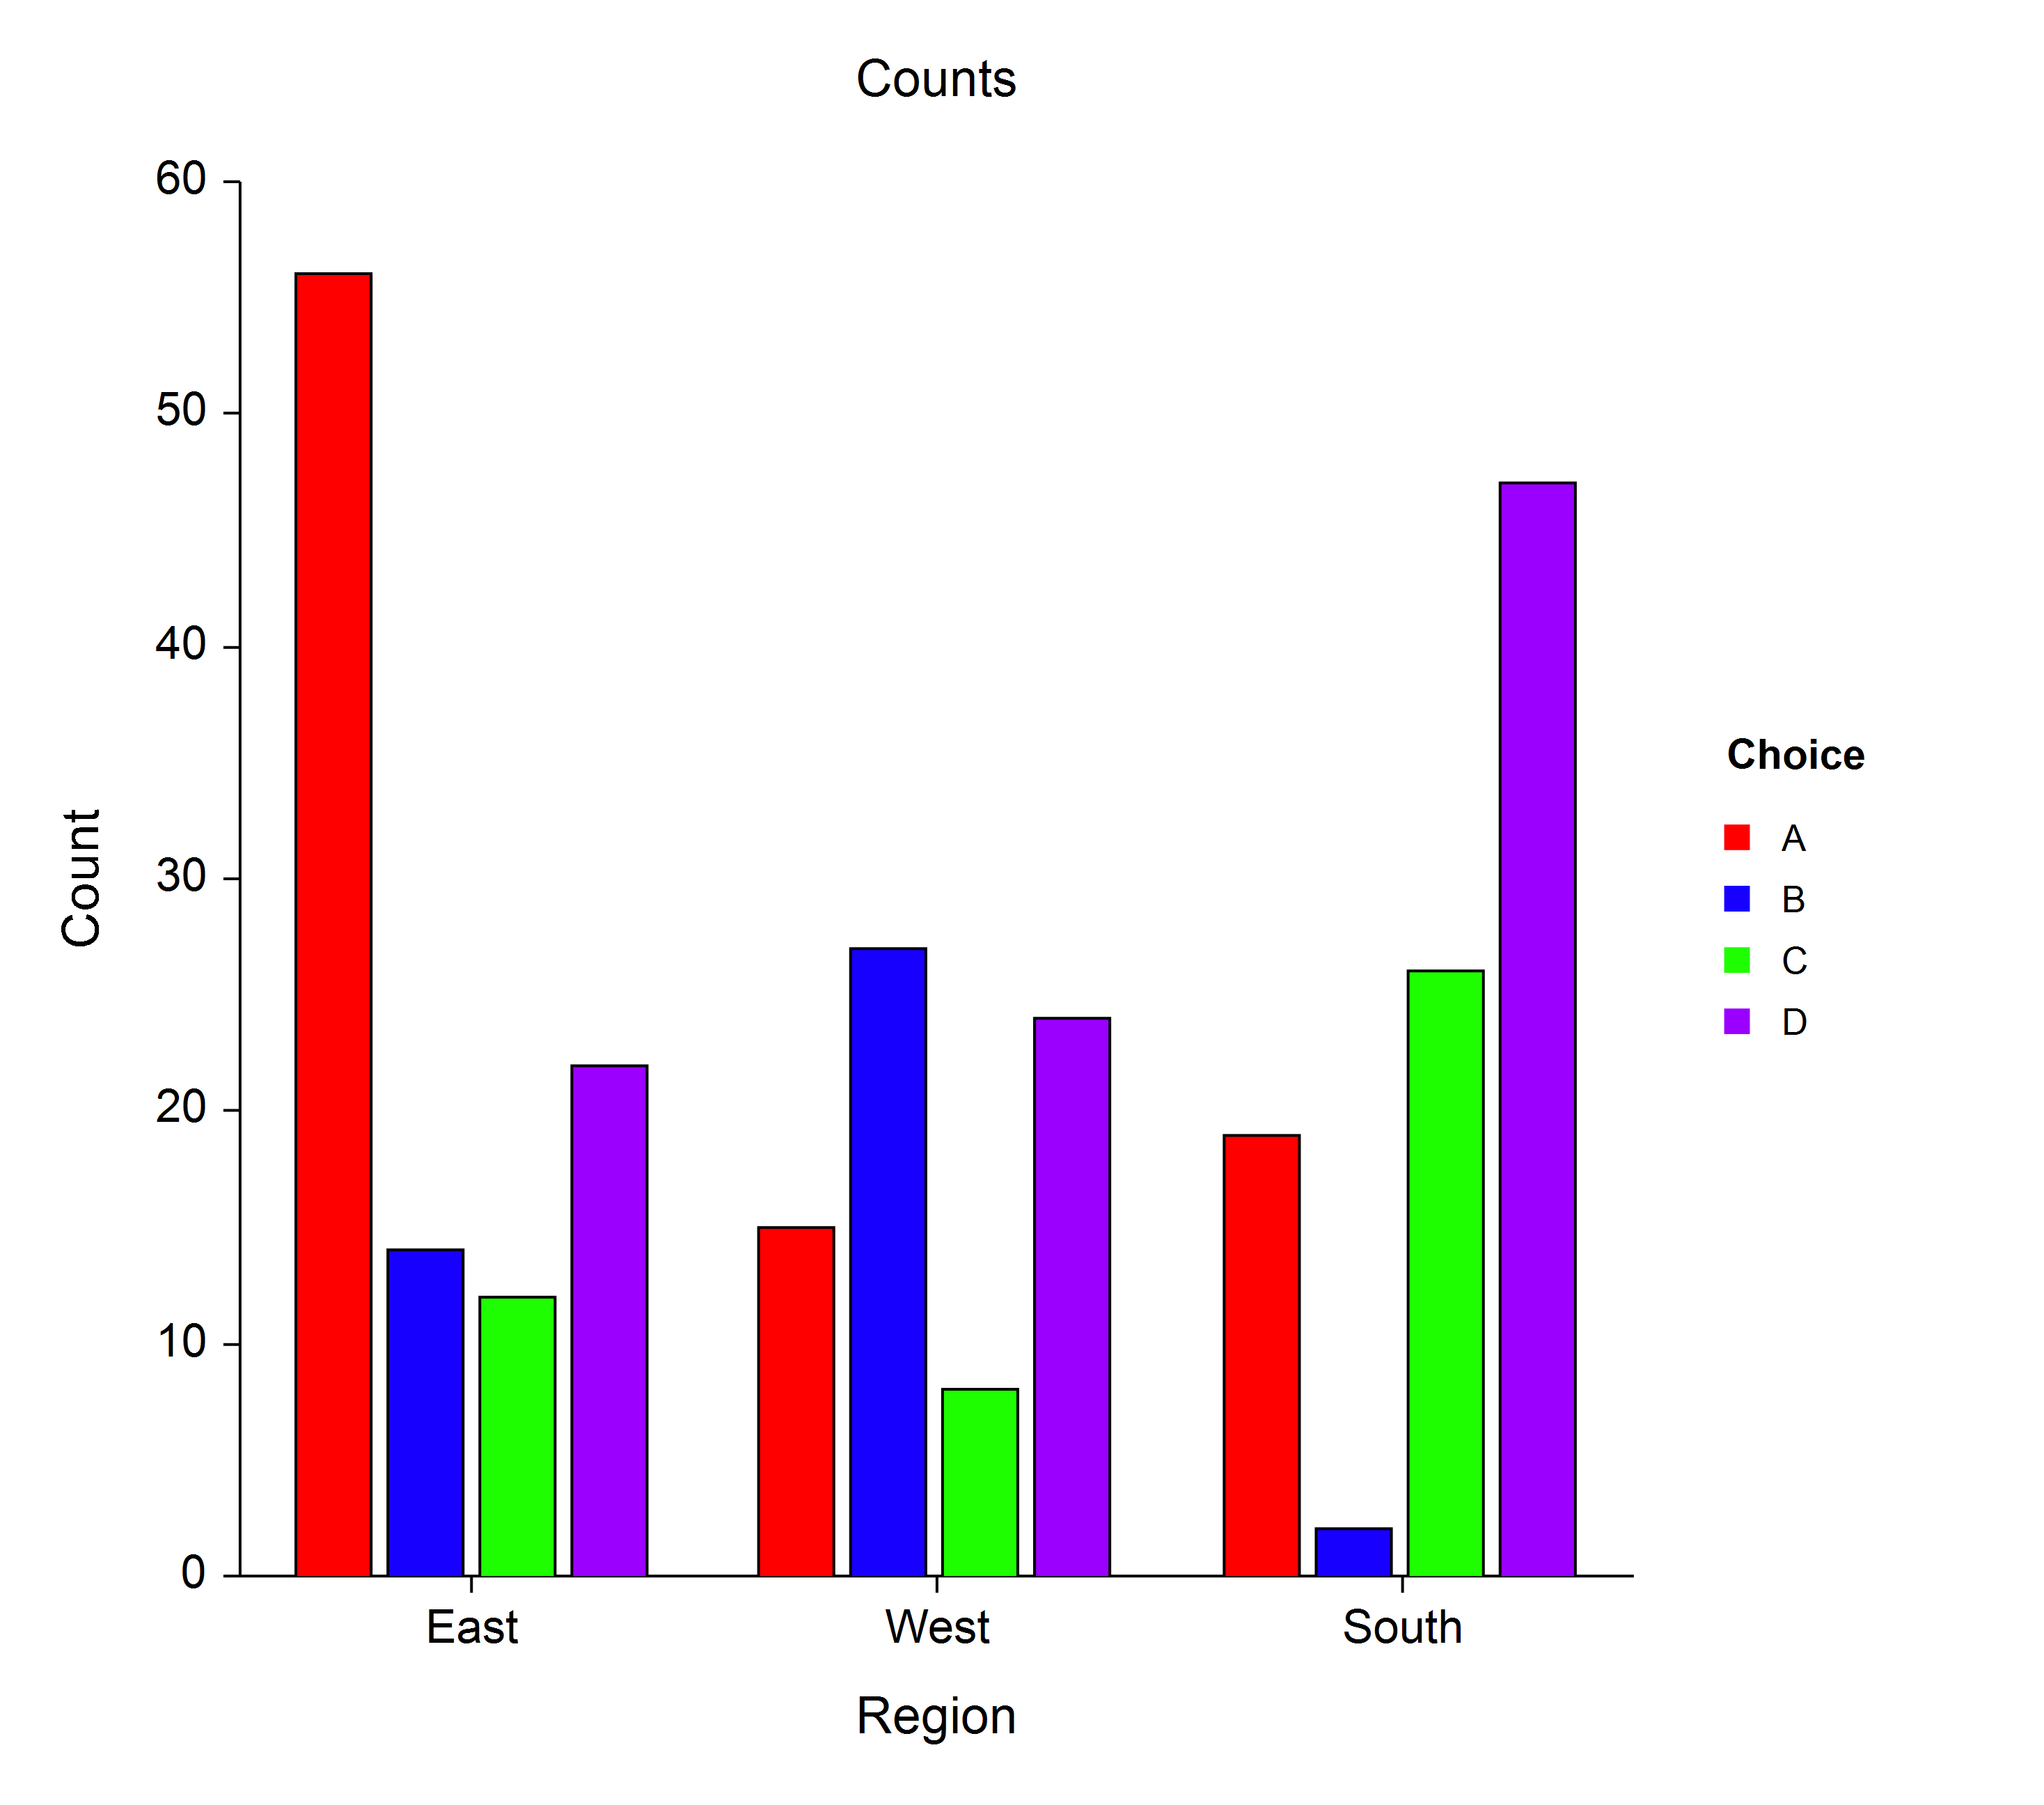
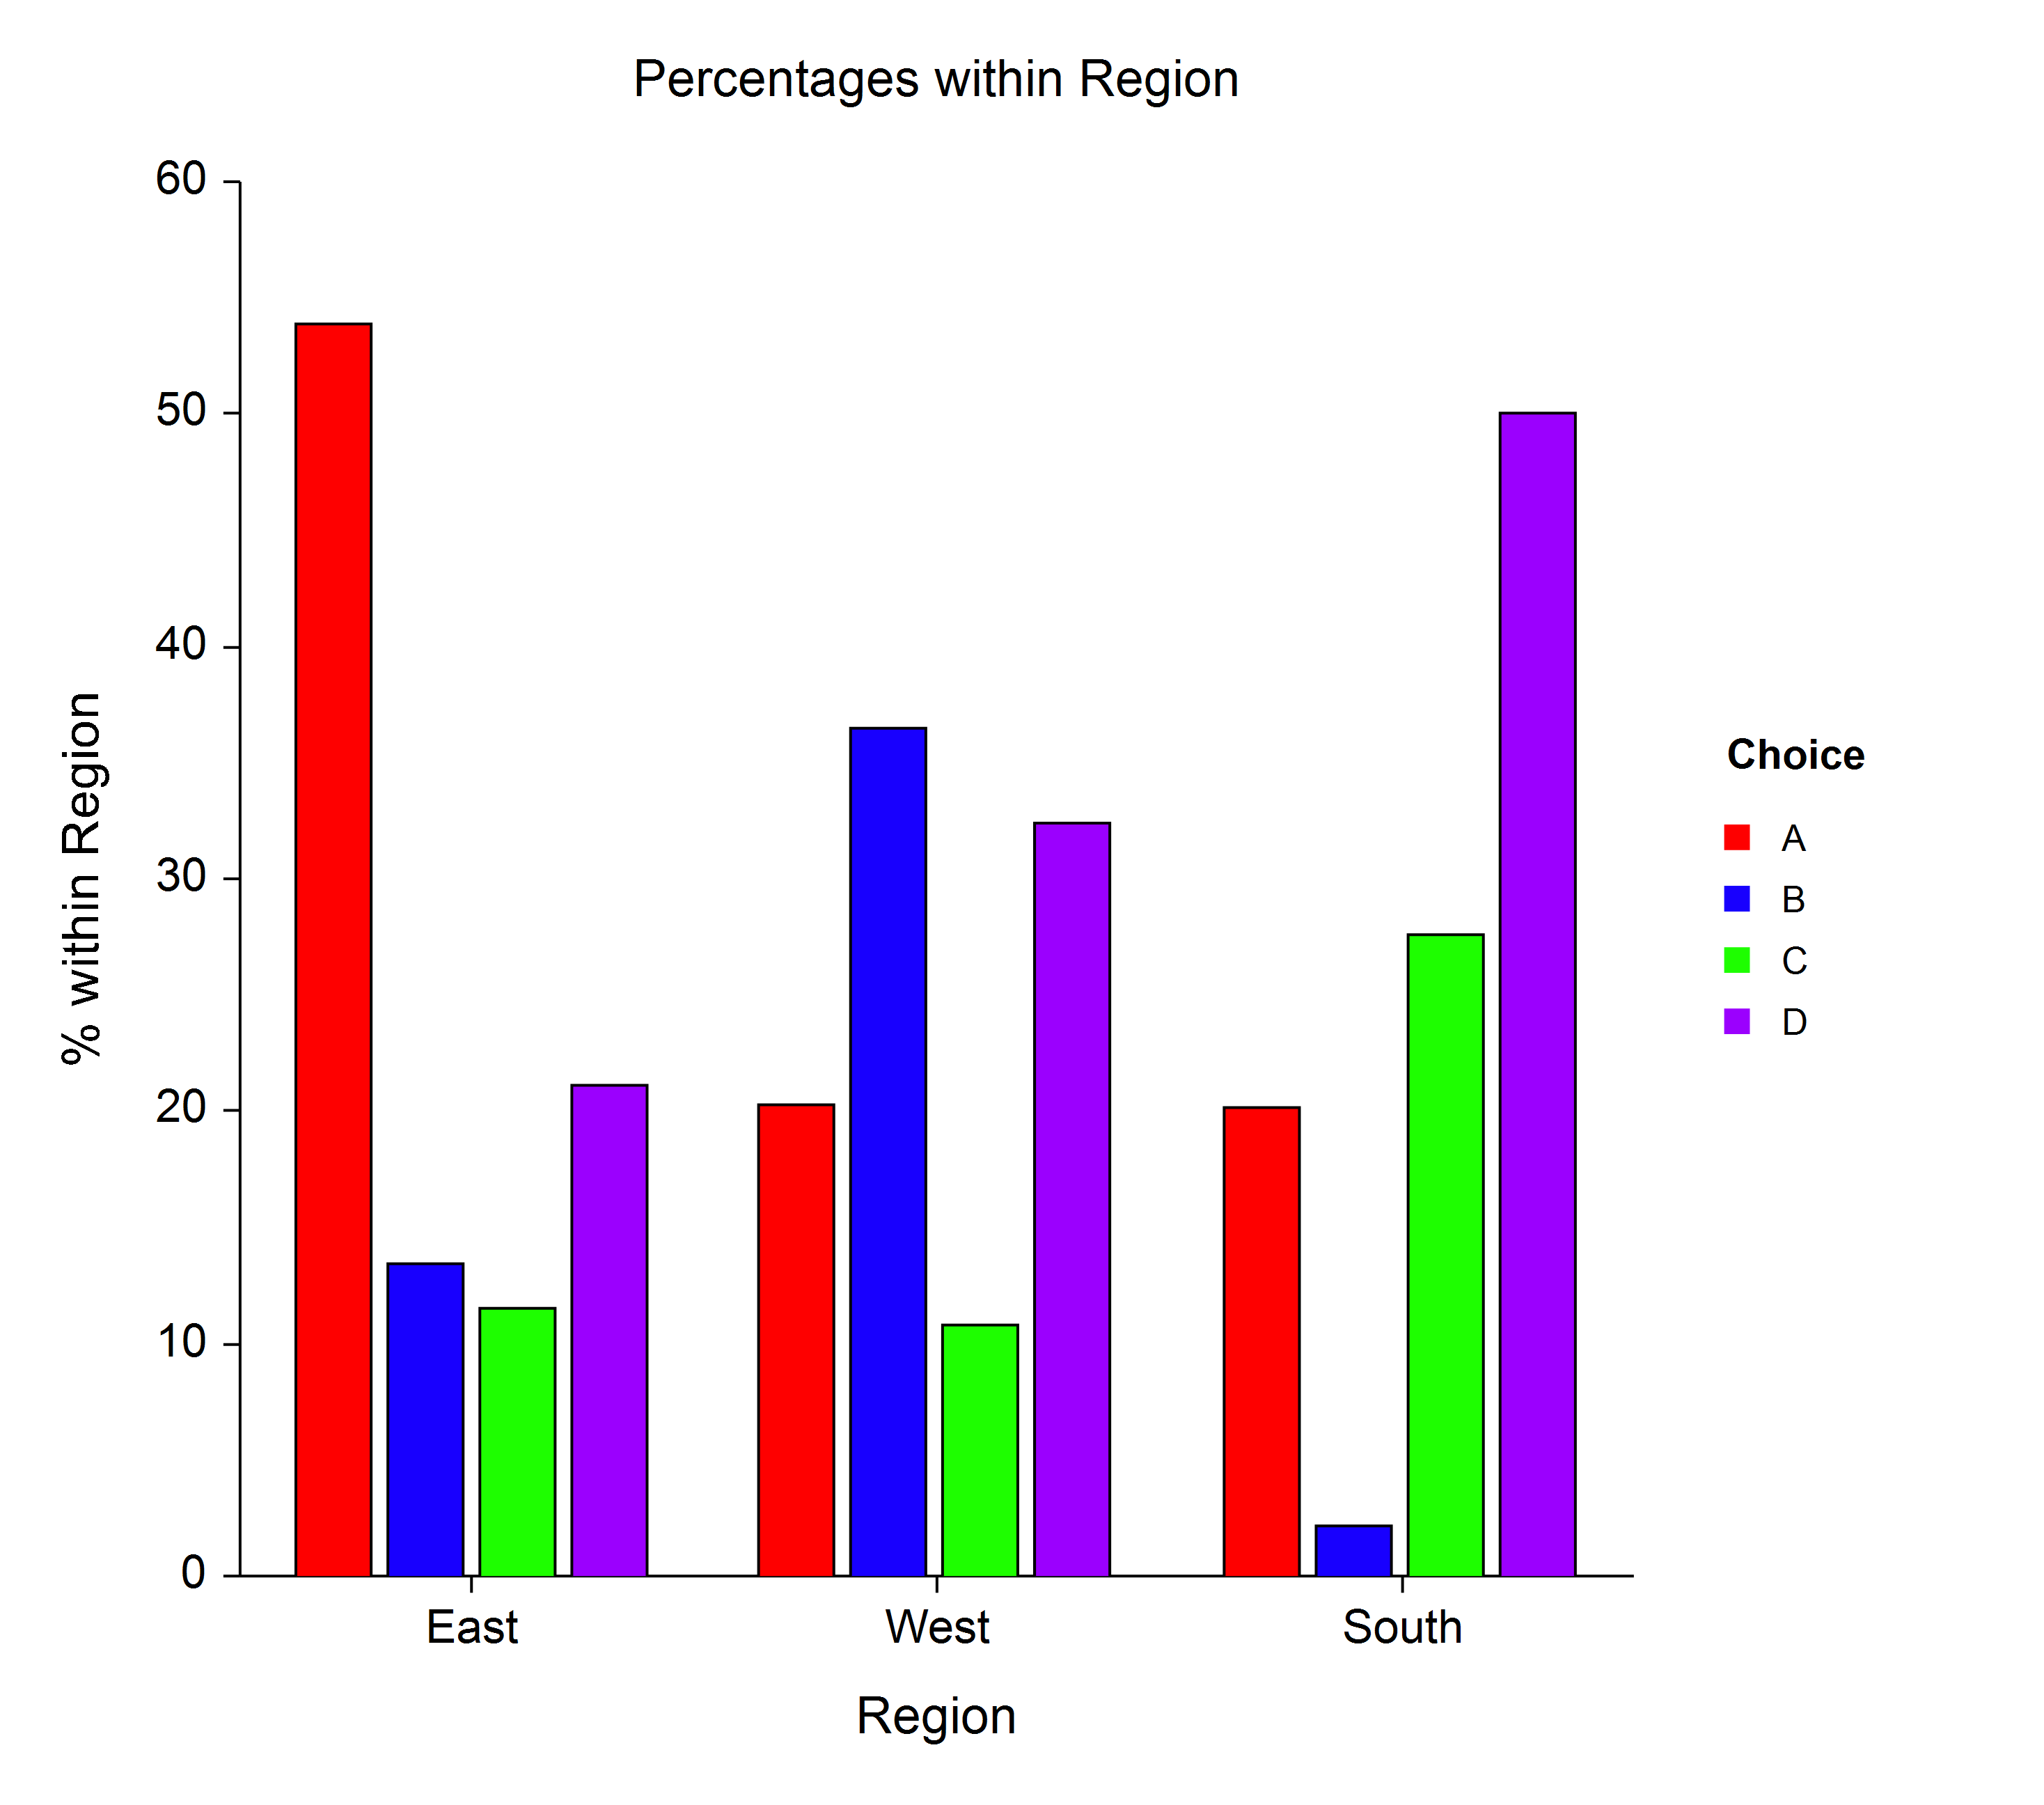
The summarized results of the survey can also be presented using simple bar charts for easy comparison:
Frequency Tables
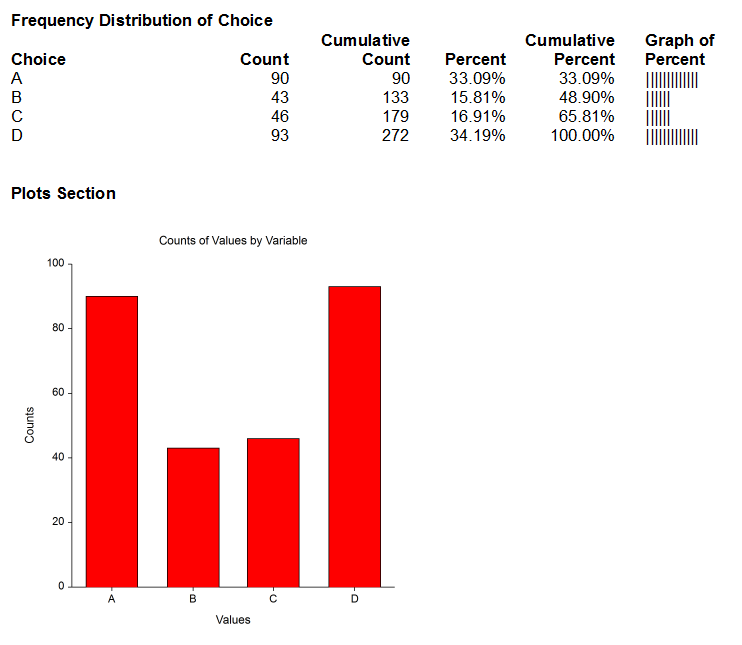
The Frequency Tables procedure in NCSS is similar to the two-way Contingency Table procedure except that only one categorical variable is analyzed at a time. This can be very useful for analyzing each survey question individually.
Click here for more information about the Frequency Tables procedure in NCSS.
Sample Output
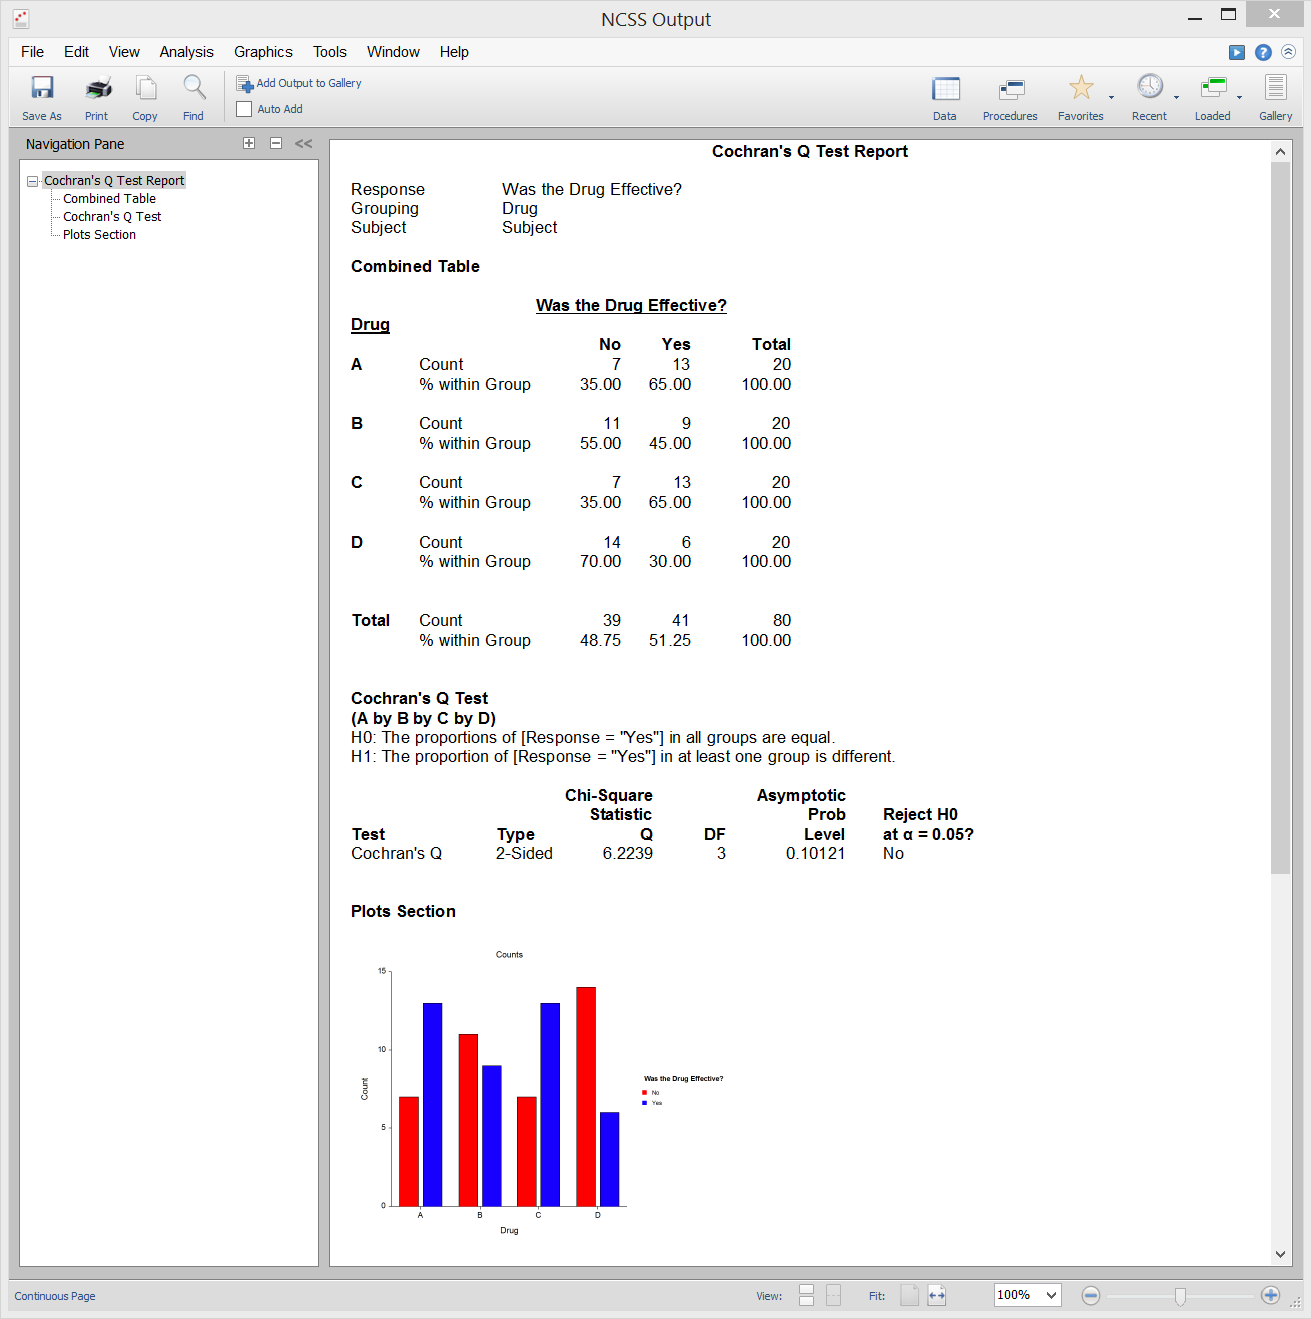
Cochran's Q Test
Cochran’s Q Test is used for testing two or more matched sets of binary responses to determine if proportion of “successes” is the same for all groups or if at least one group is different.
Click here for more information about the Cochran’s Q Test procedure in NCSS.
Sample Output
Loglinear Models
Loglinear Models (LLM) study how two or more categorical variables relate to each other. Loglinear models are often used to analyze surveys with complex relationships among the individual questions.
Click here for more information about the Loglinear Models procedure in NCSS.
Descriptive Statistics - Summary Tables
The Descriptive Statistics - Summary Tables procedure makes it easy to summary large amounts of continuous survey data in a single table using a wide variety of statistics.
Click here for more information about the Descriptive Statistics – Summary Tables procedure in NCSS.
Sample Output

Descriptive Statistics - Summary Lists
Like the Descriptive Statistics - Summary Tables procedure, the Descriptive Statistics - Summary Lists procedure allows the user to summarize large amounts of continuous survey data and adds the capability to create a new dataset from the summary statistics for further analysis.
Click here for more information about the Descriptive Statistics – Summary Lists procedure in NCSS.
Item Analysis
Item analysis is used to assess the reliability of a survey or questionnaire.
Click here for more information about the Item Analysis procedure in NCSS.
 The summarized results of the survey can also be presented using simple bar charts for easy comparison:


