Sample Size for Regression in PASS
PASS contains several procedures for sample size calculation and power analysis for regression, including linear regression, confidence intervals for the linear regression slope, multiple regression, Cox regression, Poisson regression, and logistic regression. Each procedure is easy-to-use and is carefully validated for accuracy. Use the links below to jump to a regression topic. For each procedure, only a brief summary is given. For more details about a topic, we recommend you download and install the free trial of the software. Jump to:- Introduction
- Technical Details
- An Example Setup and Output
- Linear Regression
- Confidence Intervals for Linear Regression Slope
- Multiple Regression
- Multiple Regression using Effect Size
- Cox Regression
- Poisson Regression
- Logistic Regression
- Conditional Logistic Regression
Introduction
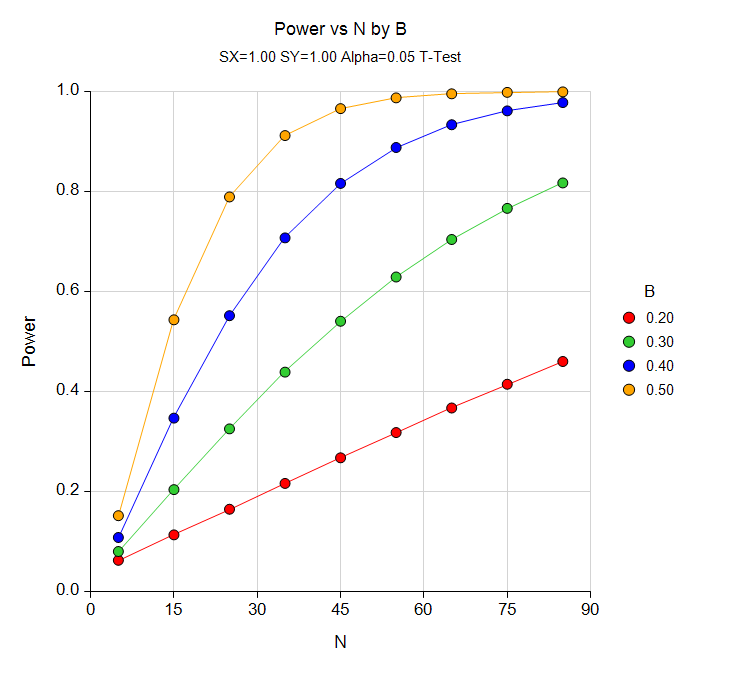
For most of the regression sample size procedures in PASS, the user may choose to solve for sample size, power, or the regression coefficient (or R-Squared) in some manner. In the case of confidence intervals, one could solve for sample size or the distance to the confidence limit. In a typical regression procedure where the goal is to estimate the sample size, the user enters power, alpha, and values related to the regression coefficient or R-squared. The procedure is run and the output shows a summary of the entries as well as the sample size estimate(s). A summary statement is given, as well as references to the articles from which the formulas for the result were obtained. For many of the parameters (e.g., power, alpha, sample size, regression coefficient, R-squared, etc.), multiple values may be entered in a single run. When this is done, estimates are made for every combination of entered values. A numeric summary of these results is produced as well as easy-to-read sample size or power curve graphs.
Technical Details
This page provides a brief description of the tools that are available in PASS for power and sample size analysis for regression. If you would like to examine the formulas and technical details relating to a specific PASS procedure, we recommend you download and install the free trial of the software, open the desired regression procedure, and click on the help button in the top right corner to view the complete documentation of the procedure. There you will find summaries, formulas, references, discussions, technical details, examples, and validation against published articles for the procedure.An Example Setup and Output
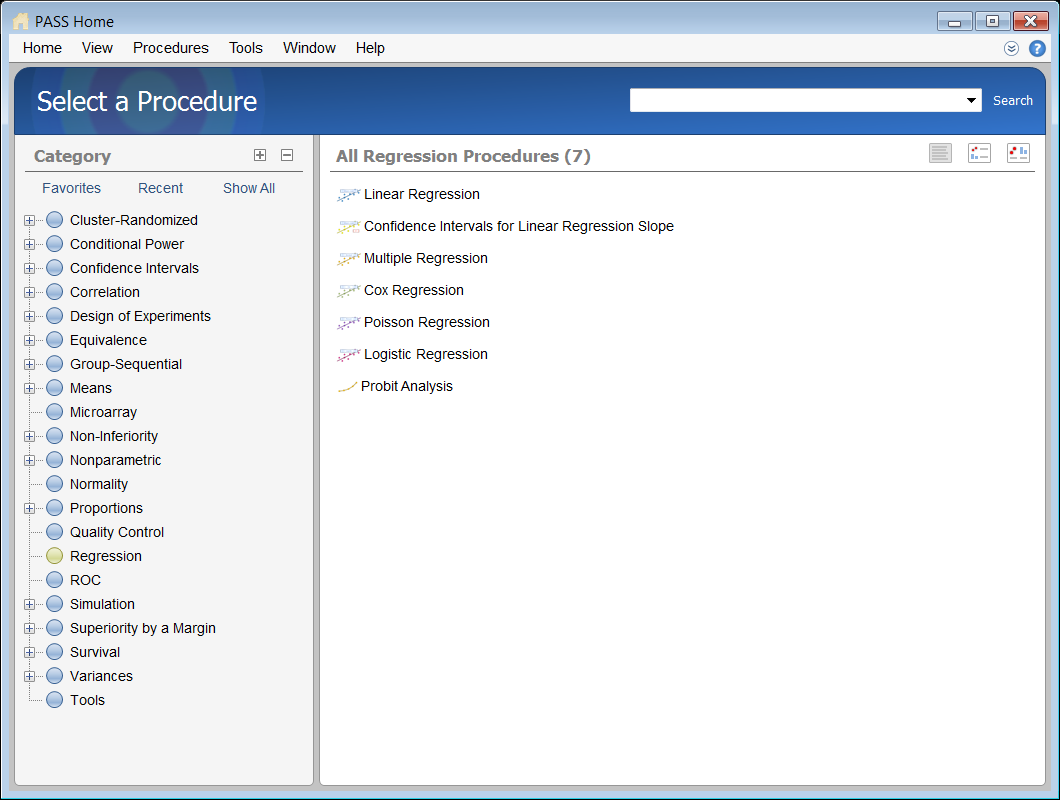
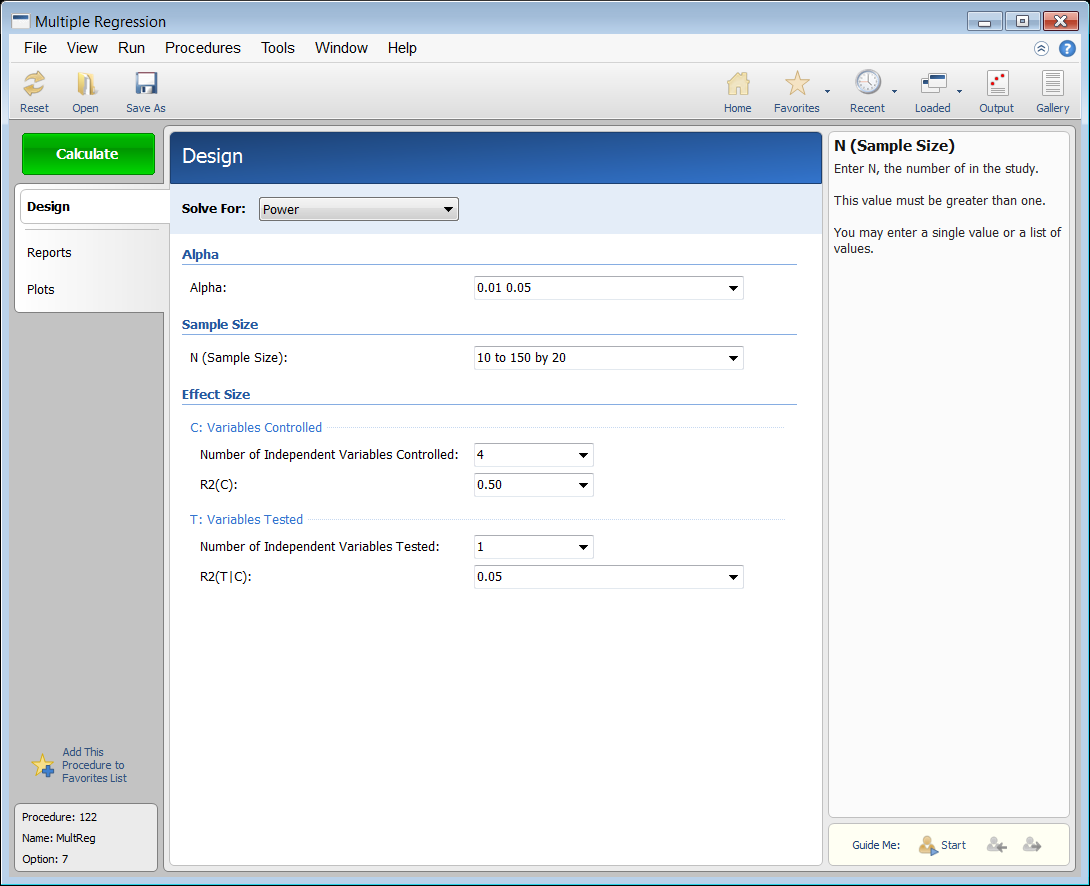
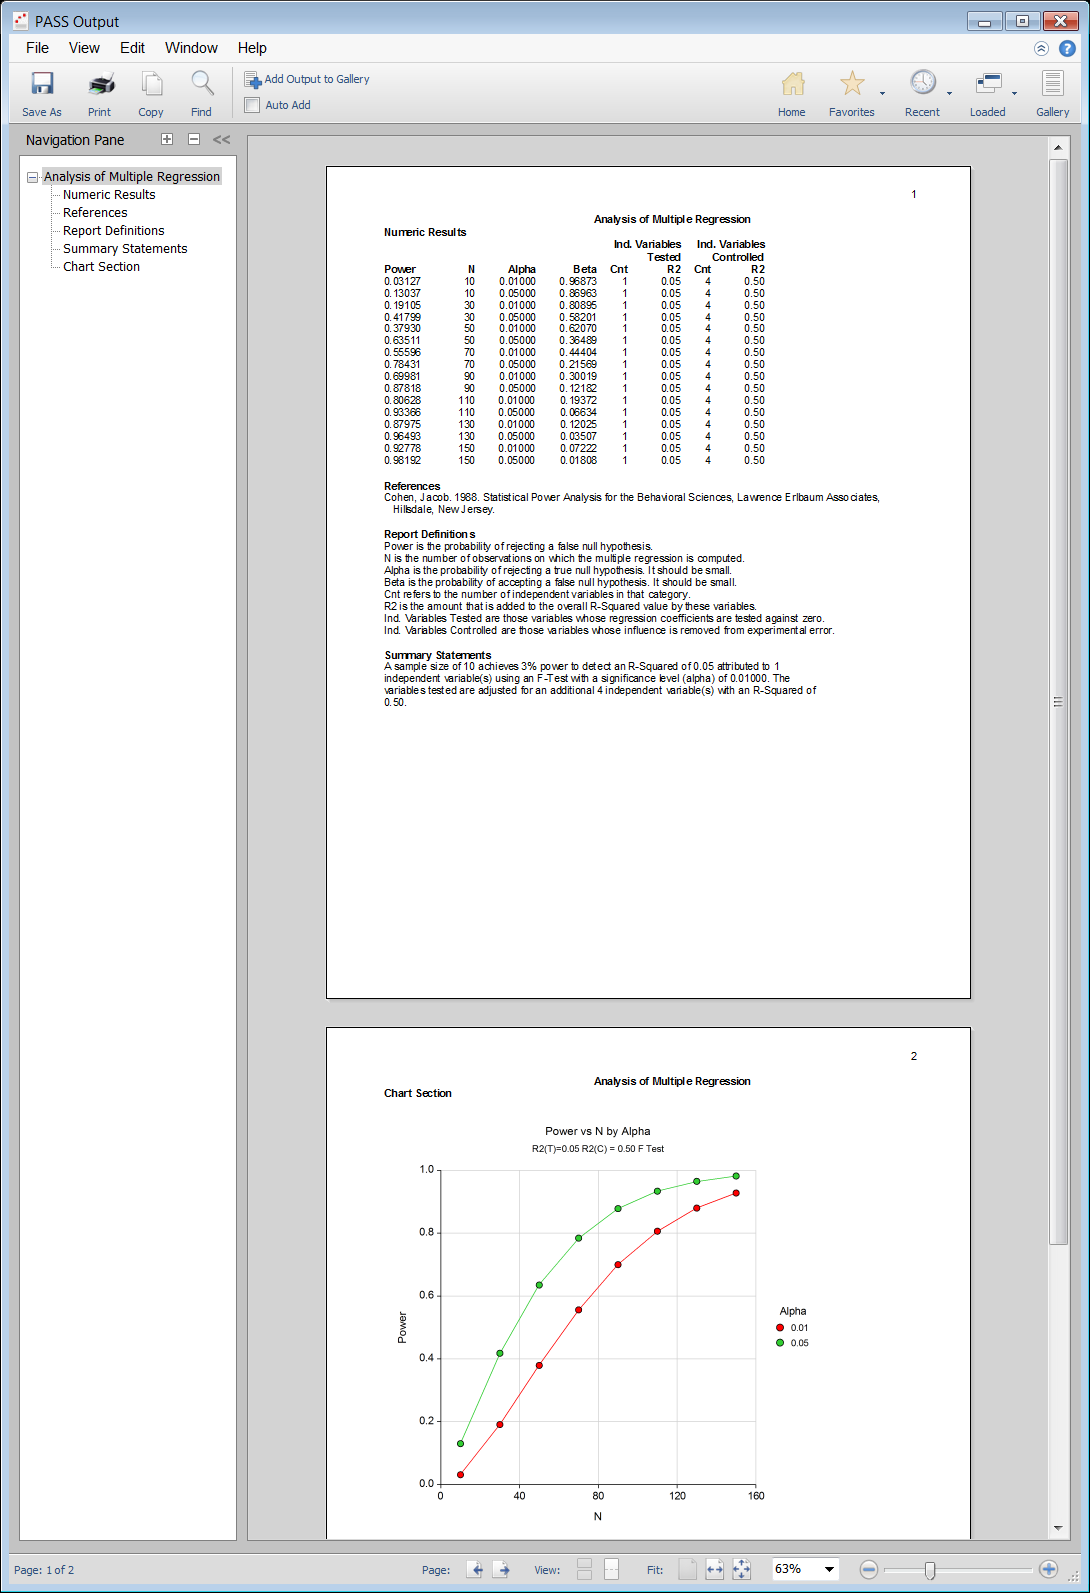
When the PASS software is first opened, the user is presented with the PASS Home window. From this window the desired procedure is selected from the menus, the category tree on the left, or with a procedure search. The procedure opens and the desired entries are made. When you click the Calculate button the results are produced. You can easily navigate to any part of the output with the navigation pane on the left.PASS Home Window

Procedure Window for Multiple Regression

PASS Output Window

Sample Size for (Simple) Linear Regression
Linear regression is a commonly used procedure in statistical analysis. In simple linear regression, the dependence of a variable Y on another variable X can be modeled using the simple linear equationY = β0 + β1X.
One of the main objectives in linear regression analysis is to test hypotheses about the slope B (sometimes called the regression coefficient) of the regression equation. The Linear Regression procedure in PASS calculates power and sample size for testing whether the slope is a value other than the value specified by the null hypothesis. There are several procedures in PASS for calculating sample size for simple linear regression:- Simple Linear Regression
- Non-Zero Null Tests for Simple Linear Regression
- Non-Inferiority Tests for Simple Linear Regression
- Superiority by a Margin Tests for Simple Linear Regression
- Equivalence Tests for Simple Linear Regression
- Simple Linear Regression using R-Squared
- Non-Zero Null Tests for Simple Linear Regression using R-Squared
Sample Size for Confidence Intervals for Linear Regression Slope
For a single slope in simple linear regression analysis, a two-sided, 100(1 – α)% confidence interval is calculated asβ1 ± t1-α/2, n-2SDβ1.
The Confidence Intervals for Linear Regression Slope procedure in PASS calculates the sample size necessary to achieve a specified distance from the slope to the confidence limit at a stated confidence level for an interval about the slope. This procedure assumes that the slope and standard deviation/correlation estimates of the future sample will be the same as the slope and standard deviation/correlation estimates that are specified. If the slope and standard deviation/correlation estimates are different from those specified when running this procedure, the interval width may be narrower or wider than specified.Sample Size for Multiple Regression
Multiple regression is a technique for studying the linear relationship between a dependent variable, Y, and several numeric independent variables, X1, X2, X3, etc. Regression models are often used for two distinct purposes:- To determine which of the several independent variables are significantly correlated with the dependent variable.
- To estimate the parameters in a mathematical model of the relationship between Y and the X’s. This model may be used to predict Y for new values of the X’s, or to better understand the relationship.
Y = β0 + β1X1 + β2X2 + β3X3 + ...
Instead of using the correlation coefficient as the index of interest, the square of the correlation coefficient, R2 , has been adopted, mainly because of its ease of interpretation and its ability to be partitioned among various subgroups of the independent variables. R2 ranges from zero to one. When performing a regression analysis, a typical hypothesis involves testing the significance of a subgroup of the independent variables after considering a second, nonoverlapping, group of independent variables. For example, suppose you have five independent variables. One common hypothesis tests whether a certain variable is influential (has a nonzero coefficient in the regression equation) after considering the other four variables. To perform this test, you partition the R2 from fitting all five variables into the R2 of the first four variables and the R2 added by the fifth variable. An F-test is constructed that tests whether this second R2 value is significantly different from zero. If it is, the fifth variable is significant after adjusting for the other four variables. The Multiple Regression procedure in PASS calculates the power and sample size necessary to detect a specified R2 value based on the number of independent variables tested and controlled.Sample Size for Multiple Regression using Effect Size
This procedure computes power and sample size for a multiple regression analysis in which the relationship between a dependent variable Y and a set independent variables X1, X2, …, Xk is to be studied. In multiple regression, interest usually focuses on the regression coefficients. However, since the X’s are usually not available during the planning phase, little is known about these coefficients until after the analysis is run. Hence, this procedure uses the squared multiple correlation coefficient, R2, as the measure upon which the power analysis and sample size is based. Gatsonis and Sampson (1989) present power analysis results for two approaches: unconditional and conditional. Both of these approaches are available in this procedure. Cohen (1988) defined an effect size f2 that is calculated from the R2 or ρ2 using the relationship f2 = R2/(1 - R2) This procedure uses the effect size directly rather than R2 or ρ2.Sample Size for Cox Regression
Cox proportional hazards regression models the relationship between the hazard function λ(t|X) of survival time and k covariates using the formulalog(λ(t|X) / λ0(t|X)) = β1X1 + β2X2 + ... + βkXk
where λ0(t|X) is the baseline hazard. Note that the covariates may be discrete or continuous. The Cox Regression procedure in PASS calculates power and sample size for testing the hypothesis that β1=0 versus the alternative that β1=B . Note that β1 is the change in log hazard for a one-unit change in X1 when the rest of the covariates are held constant. The procedure assumes that this hypothesis will be tested using the Wald (or score) statistic.Sample Size for Poisson Regression
Poisson regression is used for studying the relationship between a dependent count variable, Y, and several independent variables, X1, X2, X3, etc. In Poisson regression, we suppose that the Poisson incidence rate μ is determined by a set of k regressor variables (the X’s). The expression relating these quantities isμ = exp(β1X1 + β2X2 + ... + βkXk)
Following the results of Signorini (1991), the Poisson Regression procedure in PASS calculates power and sample size for testing the hypothesis that β1 = 0 versus the alternative that β1 = B. Note that exp(β1) is the change in the rate for a one-unit change in X1 when the rest of the covariates are held constant. The procedure assumes that this hypothesis will be tested using the score statistic.Sample Size for Logistic Regression
Logistic regression is used for studying the relationship between a dependent binary variable, Y, and several independent variables, X1, X2, X3, etc. The multiple logistic regression model relates the probability distribution of Y to k independent variables using the formulalog(P/1-P) = β0 + β1X1 + β2X2 + ... + βkXk
where P is the probability that Y = 1 given the values of the covariates.
In power analysis and sample size calculations, attention is placed on a single covariate, X1, while the influence of the other covariates is statistically removed by placing them at their mean values. The Logistic Regression procedure in PASS calculates power and sample size for testing the null hypothesis that the coefficient, β1 ,for a single covariate, X1, is equal to 0, versus the alternative that β1 = B, while adjusting for other variables in the model. This is equivalent to testing the null hypothesis that the odds ratio, OR, is equal to 1 where
OR = (P1/1-P1) / (P0/1-P0)
and
P1 is the probability that Y = 1 under the alternative hypothesis P0 is the probability that Y = 1 under the null hypothesis
Five additional procedures in PASS involving logistic regression are:- Logistic Regression with One Binary Covariate using the Wald Test
- Logistic Regression with Two Binary Covariates using the Wald Test
- Logistic Regression with Two Binary Covariates and an Interaction using the Wald Test
- Confidence Intervals for the Odds Ratio in a Logistic Regression with Two Binary Covariates
- Confidence Intervals for the Interaction Odds Ratio in a Logistic Regression with Two Binary Covariates
Sample Size for Conditional Logistic Regression
There are two procedures in PASS involving conditional logistic regression:- Tests for the Odds Ratio in a Matched Case-Control Design with a Binary X using Conditional Logistic Regression
- Tests for the Odds Ratio in a Matched Case-Control Design with a Quantitative X using Conditional Logistic Regression
Sample Size for Tests of Mediation Effect
These procedures compute power and sample size for a mediation analysis of a dependent (output) variable Y and an independent (input) variable X. Interest focuses on the interrelationship between Y, X, and a third variable called the mediator M. The sample size calculations are based on the work of Vittinghoff, Sen, and McCulloch (2009). There are six procedures in PASS involving tests of mediation effect:- Tests of Mediation Effect using the Sobel Test
- Tests of Mediation Effect in Linear Regression
- Tests of Mediation Effect in Logistic Regression
- Tests of Mediation Effect in Poisson Regression
- Tests of Mediation Effect in Cox Regression
- Joint Tests of Mediation in Linear Regression with Continuous Variables
