Sample Size for Survival Analysis Tests in PASS
PASS contains over 25 tools for sample size estimation and power analysis of survival methods, including logrank tests, non-inferiority, group-sequential, and conditional power, among others. Each procedure is easy-to-use and is carefully validated for accuracy. If you need help on how to use PASS sample size estimation software, use the links below to jump to a survival topic. For each procedure, only a brief summary of the procedure is given. For more details about a particular procedure, we recommend you download and install the free trial to really understand how to use PASS software. Jump to:- Introduction
- Technical Details
- An Example Setup and Output
- Logrank Tests for Survival Curve Inequality
- Other Tests for Survival Curve Inequality
- Non-Inferiority Tests for Two Survival Curves
- Equivalence Tests for Two Survival Curves
- Superiority by a Margin Tests for Two Survival Curves
- Group-Sequential Logrank Tests
- Conditional Power of Logrank Tests
- Cox Regression
- One-Sample Tests for Exponential Hazard Rate
Introduction
For most of the sample size procedures in PASS for survival, the user may choose to solve for sample size, power, or the population effect size in some manner. In a typical survival test procedure where the goal is to estimate the sample size, the user enters power, alpha, and the desired population survival parameters. The procedure is run and the output shows a summary of the entries as well as the sample size estimate. A summary statement is given, as well as references to the articles from which the formulas for the result were obtained. For many of the parameters (e.g., power, alpha, sample size, survival, etc.), multiple values may be entered in a single run. When this is done, estimates are made for every combination of entered values. A numeric summary of these is results is produced as well as easy-to-read sample size or power curve graphs.Technical Details
This page provides a brief description of the tools that are available in PASS for power and sample size analysis of survival methods. If you would like to examine the formulas and technical details relating to a specific PASS procedure, we recommend you download and install the free trial of the software, open the desired survival procedure, and click on the help button in the top right corner to view the complete documentation of the procedure. There you will find summaries, formulas, references, discussions, technical details, examples, and validation against published articles for the procedure.An Example Setup and Output
When the PASS software is first opened, the user is presented with the PASS Home window. From this window the desired procedure is selected from the menus, the category tree on the left, or with a procedure search. The procedure opens and the desired entries are made. When you click the Calculate button the results are produced. You can easily navigate to any part of the output with the navigation pane on the left.PASS Home Window
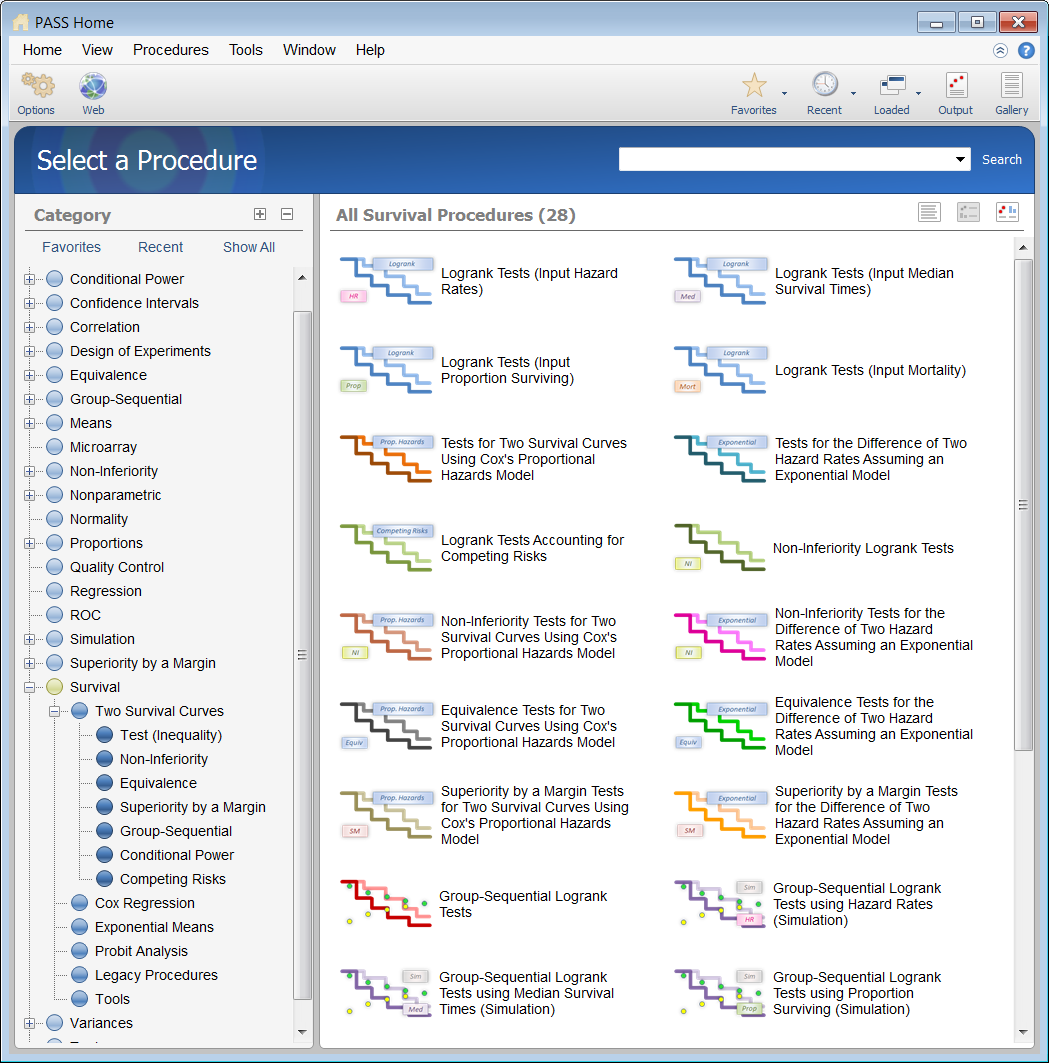
Logrank Tests Procedure Window
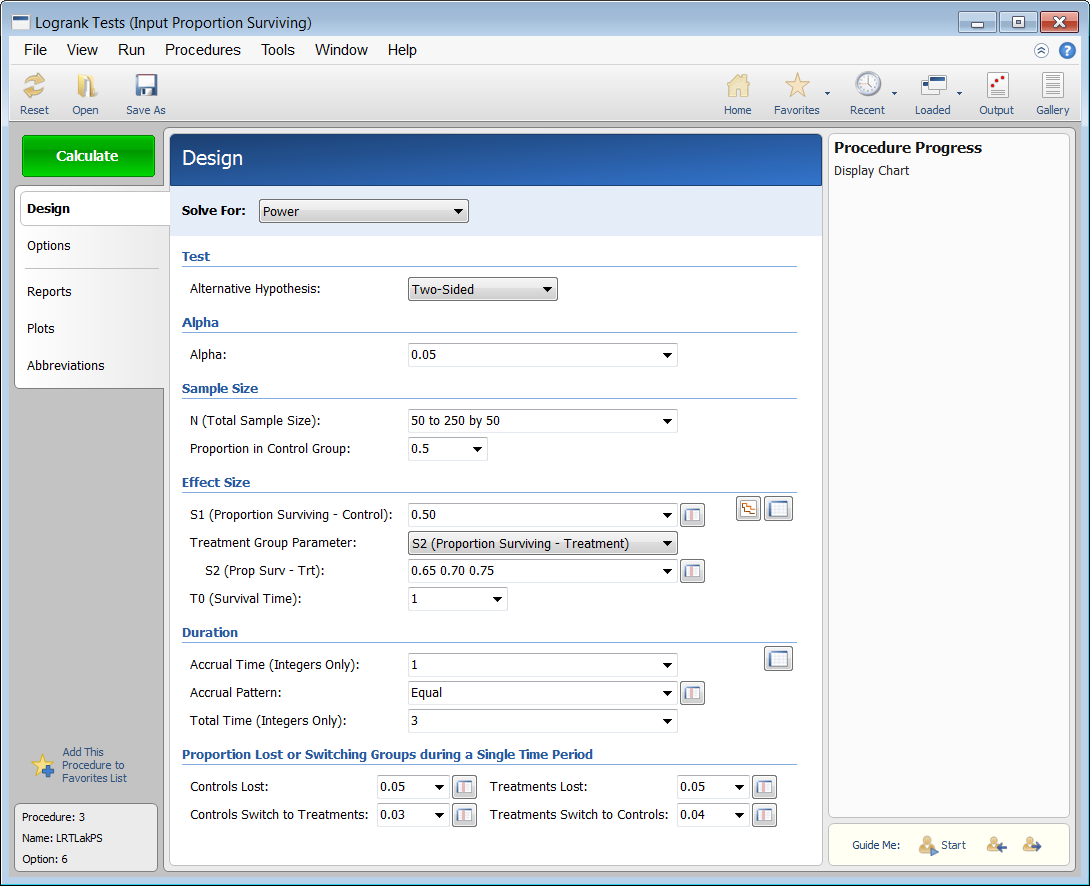
PASS Output Window
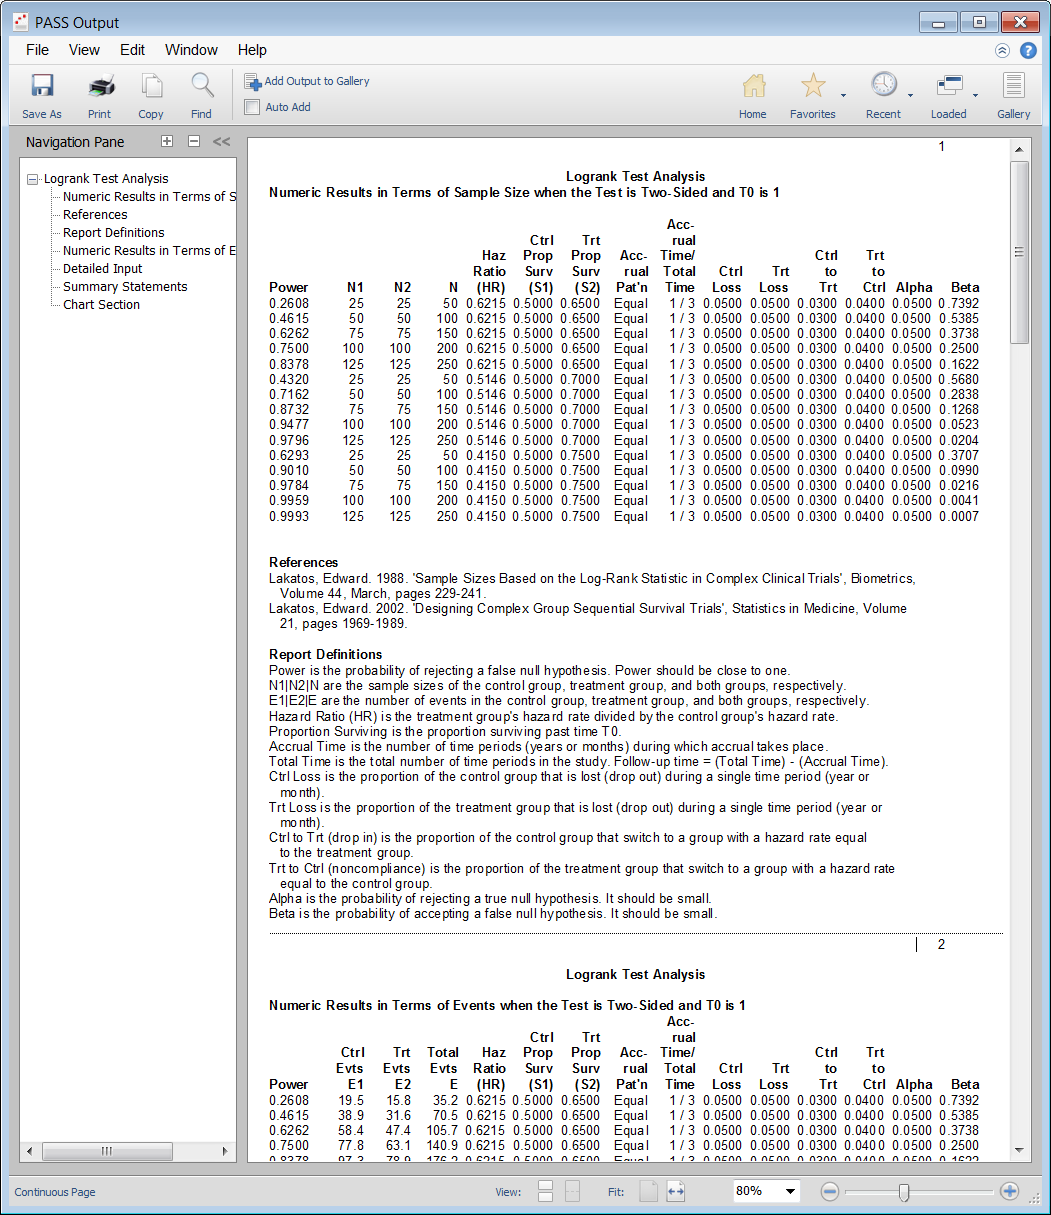
Power Curve for the Logrank Tests Procedure
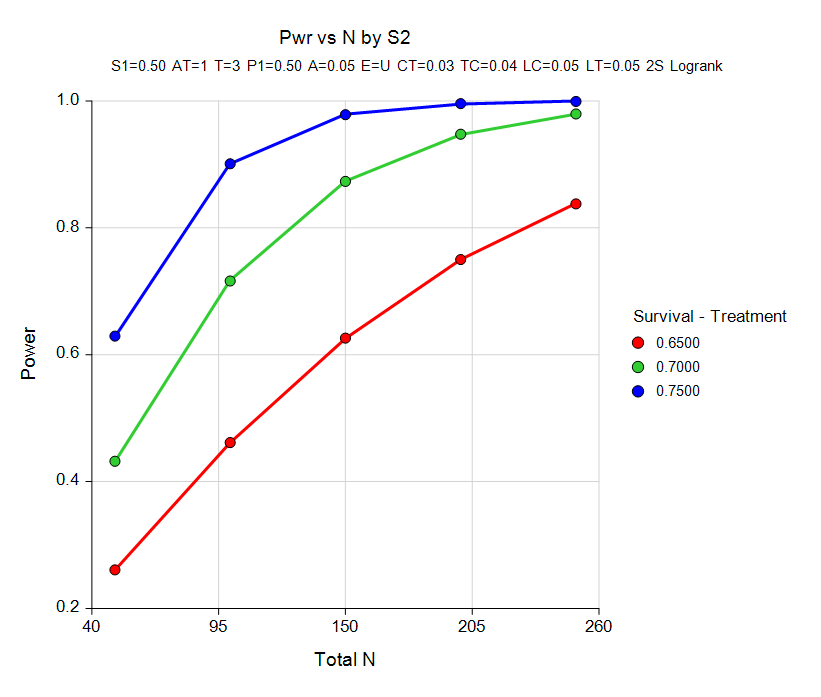
Sample Size for Logrank Tests for Survival Curve Inequality
There are several procedures in PASS for determining sample size or power for inequality tests of two survival curves:- Logrank Tests (Input Hazard Rates)
- Logrank Tests (Input Median Survival Times)
- Logrank Tests (Input Proportion Surviving)
- Logrank Tests (Input Mortality)
- Tests for Two Survival Curves Using Cox’s Proportional Hazards Model
- Tests for the Difference of Two Hazard Rates Assuming an Exponential Model
- Logrank Tests Accounting for Competing Risks
Sample Size for Other Tests for Survival Curve Inequality using Simulation
A simulation based procedure is used to evaluate sample size and power for each of the following tests for comparing two survival curves:- Logrank
- Gehan-Wilcoxon
- Taron-Ware
- Peto-Peto
- Modified Peto-Peto
- Fleming-Harrington
Sample Size for Non-Inferiority Tests for Two Survival Curves
The sample size and power analysis procedures in PASS for non-inferiority of two survival curves are:- Non-Inferiority Logrank Tests
- Non-Inferiority Tests for Two Survival Curves Using Cox’s Proportional Hazards Model
- Non-Inferiority Tests for the Difference of Two Hazard Rates Assuming an Exponential Model
Sample Size for Equivalence Tests for Two Survival Curves
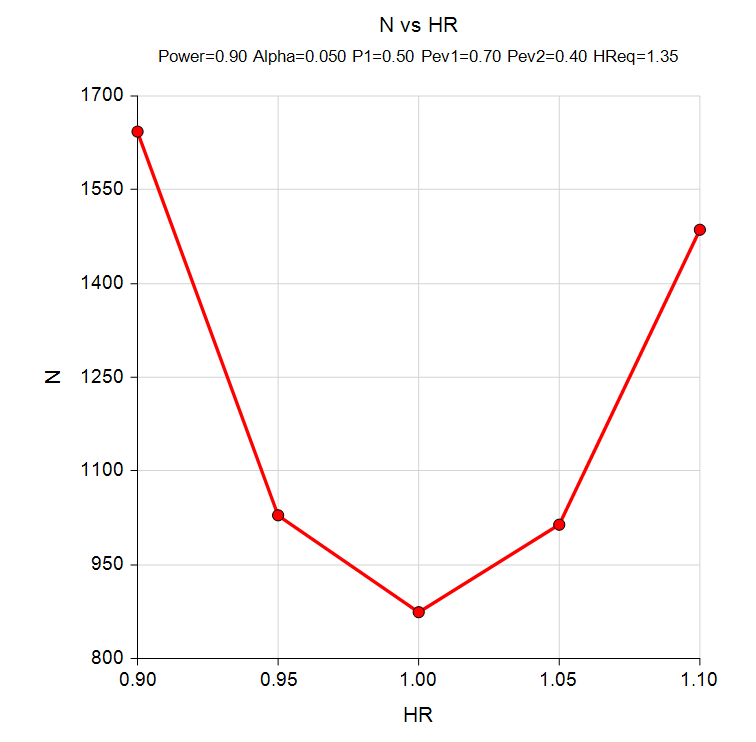
There are two survival equivalence procedures in PASS. The first procedure uses the Cox's proportional hazards model and the second assumes an exponential model.Sample Size Curve for Survival Equivalence with Hazard Ratio on X Axis
Sample Size for Superiority by a Margin Tests for Two Survival Curves
There are two survival procedures for showing superiority by a margin in PASS. The first procedure uses the Cox's proportional hazards model and the second assumes an exponential model.Sample Size for Group-Sequential Logrank Tests
In PASS, there is an analytic procedure for group-sequential logrank tests as well as four simulation procedures. The simulation procedures differ only in the survival input (hazard rates, median survival times, proportion surviving, or mortality). The following test methods are available in the simulation procedures:- Logrank
- Gehan-Wilcoxon
- Taron-Ware
- Peto-Peto
- Modified Peto-Peto
- Fleming-Harrington
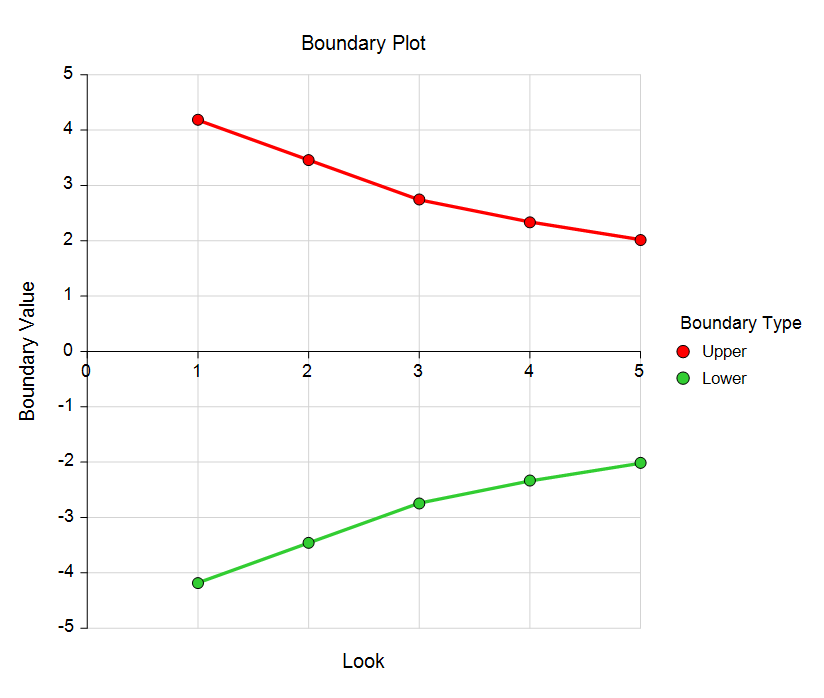
Group-Sequential Logrank Test Boundary Plot with 5 Looks
Sample Size for Group-Sequential Tests for Two Hazard Rates (Simulation)
This procedure can be used to determine power, sample size and/or boundaries for group-sequential Z-tests comparing the survival curves of two groups. This methodology assumes an underlying Exponential model. For one- and two-sided tests, efficacy and/or futility boundaries can be generated. The spacing of the stages can be equal or custom specified. Individual stages may also be skipped. Boundaries can be computed based on popular alpha- and beta-spending functions (O’Brien-Fleming Analog, Pocock Analog, Hwang-Shih-DeCani Gamma family, linear) or custom spending functions, or boundaries may be input directly, if desired. Futility boundaries can be binding or non-binding. Corresponding P-Value boundaries are given for each boundary statistic. Alpha and/or beta spent at each stage is reported. Plots of boundaries are also produced. This procedure is used as the planning tool for determining sample size and initial boundaries. Stage data, as it is obtained, can be evaluated using the companion procedure Group-Sequential Analysis for Two Hazard Rates. The companion procedure also gives the option for sample-size re-estimation and updated boundaries for current-stage information. In that procedure, simulation can be used to evaluate boundary-crossing probabilities given the current stage results.Sample Size for Group-Sequential Non-Inferiority Tests for Two Hazard Rates (Simulation)
This procedure can be used to determine power, sample size and/or boundaries for group-sequential Z-tests comparing the survival curves of two groups, with a non-inferiority margin. Stage data, as it is obtained, can be evaluated using the companion procedure Group-Sequential Non-Inferiority Analysis for Two Hazard Rates. The companion procedure also gives the option for sample-size re-estimation and updated boundaries for current-stage information.Sample Size for Group-Sequential Superiority by a Margin Tests for Two Hazard Rates (Simulation)
This procedure can be used to determine power, sample size and/or boundaries for group-sequential Z-tests comparing the survival curves of two groups, with a superiority margin. Stage data, as it is obtained, can be evaluated using the companion procedure Group-Sequential Superiority by a Margin Analysis for Two Hazard Rates. The companion procedure also gives the option for sample-size re-estimation and updated boundaries for current-stage information.Sample Size for Conditional Power of Logrank Tests
In sequential designs, one or more intermediate analyses of the emerging data are conducted to evaluate whether the experiment should be continued. This may be done to conserve resources or to allow a data monitoring board to evaluate safety and efficacy when subjects are entered in a staggered fashion over a long period of time. Conditional power (a frequentist concept) is the probability that the final result will be significant, given the data obtained up to the time of the interim look. Predictive power (a Bayesian concept) is the result of averaging the conditional power over the posterior distribution of effect size. Both of these methods fall under the heading of stochastic curtailment techniques. This procedure computes conditional and predicted power for the case when a logrank test is used to compare the hazard rate of a treatment group to that of a control group. Conditional power procedures are also available in PASS for the case of Non-Inferiority and Superiority by a Margin.Sample Size for Cox Regression
Cox proportional hazards regression models the relationship between the hazard function λ(t|X) of survival time and k covariates using the formulalog(λ(t|X) / λ0(t|X)) = β1X1 + β2X2 + ... + βkXk
where λ0(t|X) is the baseline hazard. Note that the covariates may be discrete or continuous. The Cox Regression procedure in PASS calculates power and sample size for testing the hypothesis that β1=0 versus the alternative that β1=B . Note that β1 is the change in log hazard for a one-unit change in X1 when the rest of the covariates are held constant. The procedure assumes that this hypothesis will be tested using the Wald (or score) statistic.