Descriptive Statistics in NCSS
NCSS contains a wide variety of easy-to-use tools for describing and summarizing data efficiently and accurately. Informative plots are generated right along with customizable descriptive reports. It’s easy in NCSS to generate and modify tables of summary statistics that can be copied right into a report or presentation. Use the links below to jump to the descriptive statistics topic you would like to examine. To see how these tools can benefit you, we recommend you download and install the free trial of NCSS. Jump to:- Introduction
- Technical Details
- Descriptive Statistics
- Descriptive Statistics - Summary Tables
- Descriptive Statistics - Summary Lists
Introduction
One of the most basic yet most important tasks of any data-driven project is to summarize the data and present it in a way that is easy to understand, visualize, and interpret. NCSS allows you to do just that. A wide variety of descriptive statistics are available in NCSS, including the most basic statistics like mean and confidence interval, median, percentiles, proportion, range, variance and standard deviation and more advanced statistics like skewness, kurtosis, coefficient of variation (COV), and mean absolute deviation (MAD) to name just a few.Technical Details
This page is designed to give a general overview of the capabilities of NCSS for computing summary statistics. If you would like to examine the formulas and technical details relating to a specific NCSS procedure, click on the corresponding '[Documentation PDF]' link under each heading to load the complete procedure documentation. There you will find formulas, references, discussions, and examples or tutorials describing the procedure in detail.Descriptive Statistics
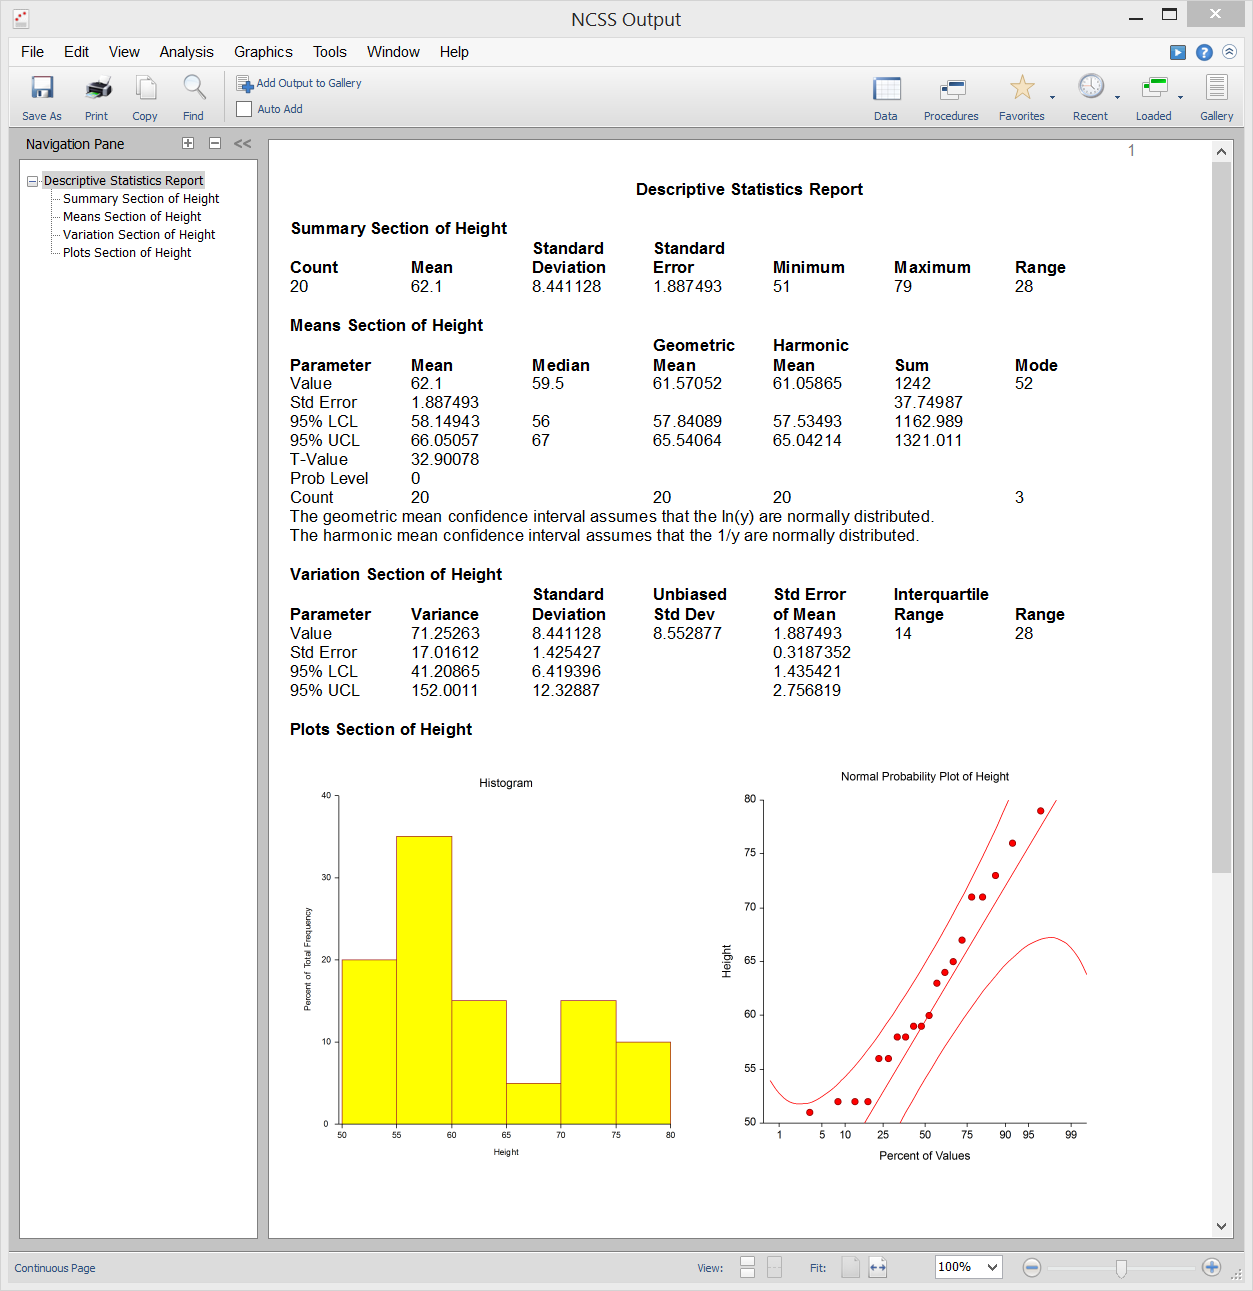
[Documentation PDF]Descriptive statistics are summary measures used to describe the most basic features of a dataset such as center, variability, and distributional characteristics. The Descriptive Statistics procedure in NCSS allows you to summarize continuous data both graphically and statistically using a wide variety of measures of location (center), spread (variability), and the underlying distribution. NCSS can produce summaries for one or more variables in a single run, optionally grouped by other categorical “grouping” variables. Sample output from the Descriptive Statistics procedure in NCSS is given below.
Sample Output

Descriptive Statistics - Summary Tables
[Documentation PDF]The Descriptive Statistics – Summary Tables procedure in NCSS produces tables containing one or more of the following summary statistics:
- Count
- Missing Count
- Sum
- Mean
- Standard Deviation (SD)
- Standard Error (SE)
- 95% Confidence Limit for the Mean
- Median
- Minimum
- Maximum
- Range
- Interquartile Range (IQR)
- 10th, 25th, 75th, and 90th Percentiles
- Variance
- Mean Absolute Deviation (MAD)
- Mean Absolute Deviation from the Median (MADM)
- Coefficient of Variation (COV)
- Coefficient of Dispersion (COD)
- Skewness
- Kurtosis
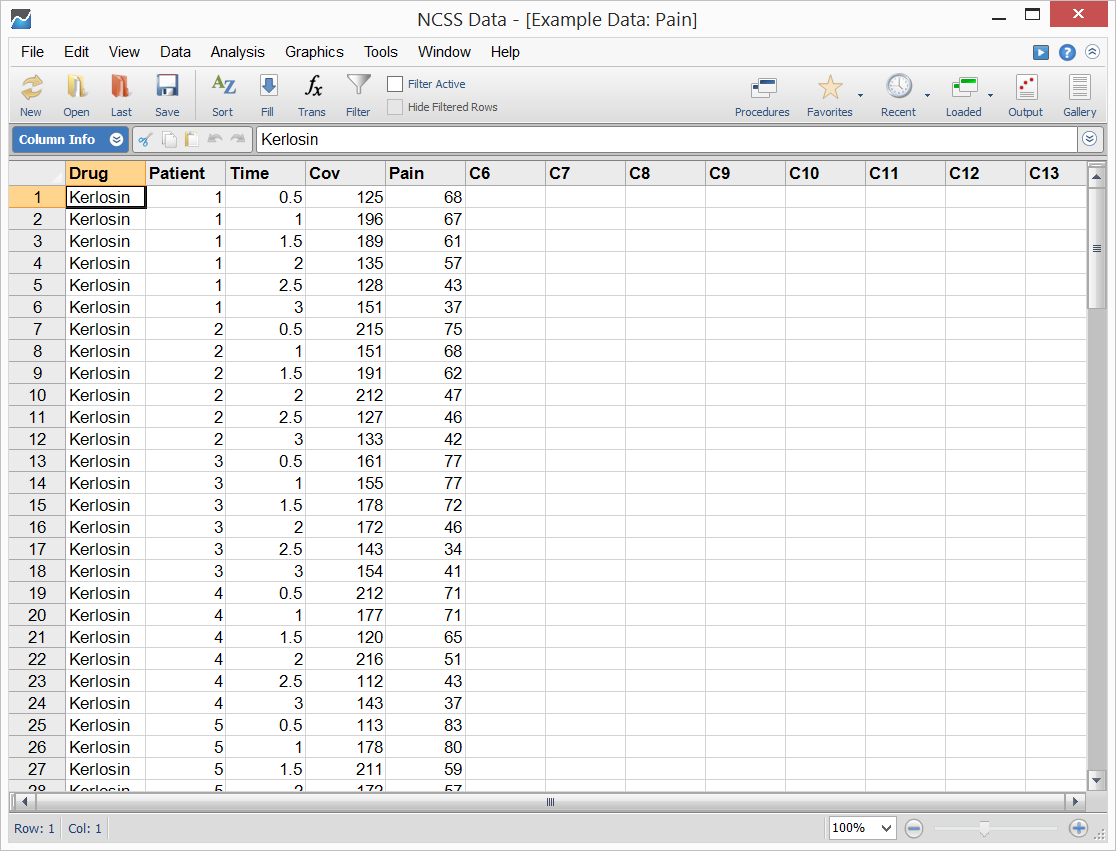
Sample Data

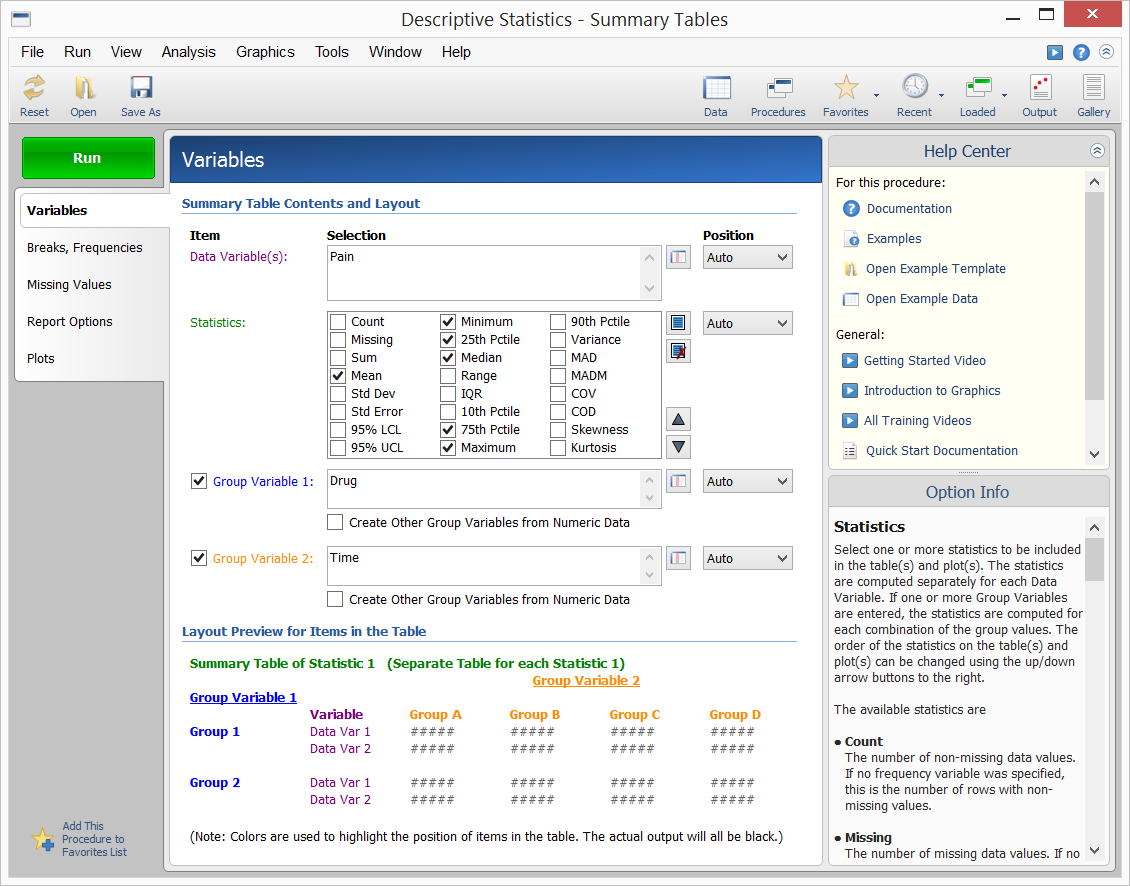
Variable and Table Layout Specification

Sample Output

Descriptive Statistics - Summary Lists
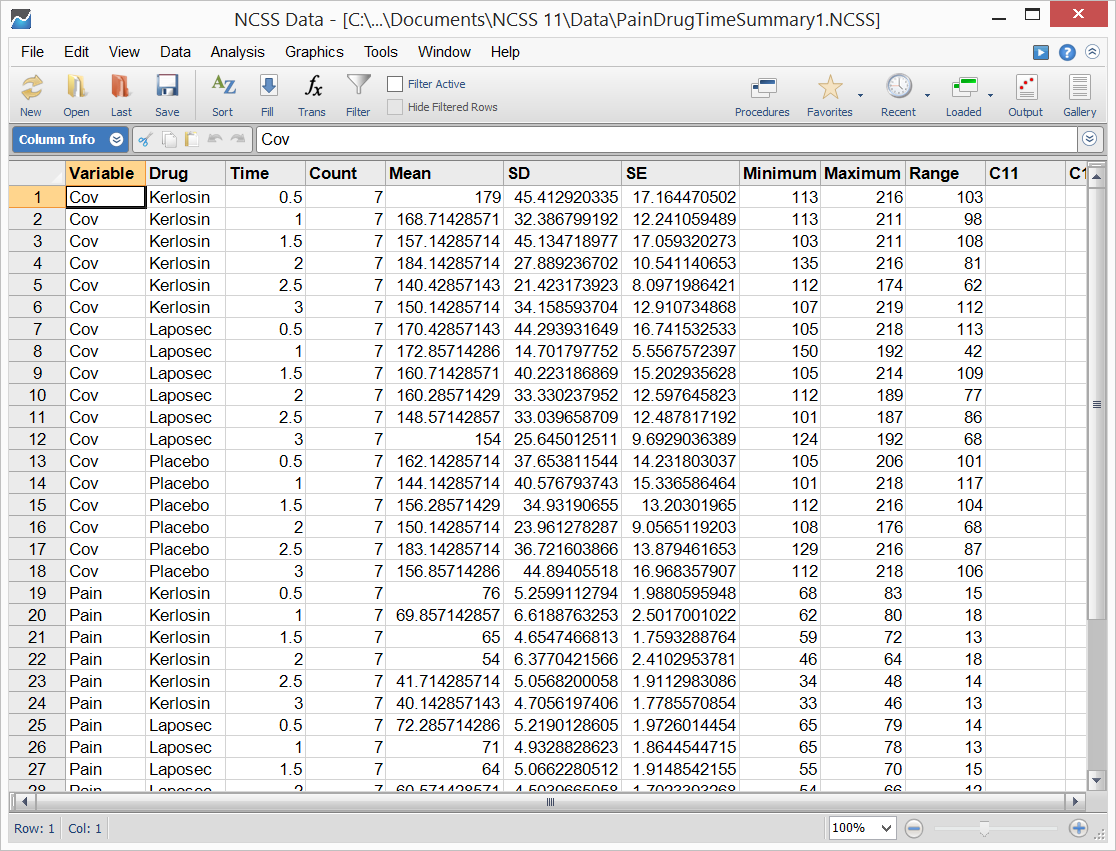
[Documentation PDF]The Descriptive Statistics - Summary Lists procedure in NCSS adds the capability to store summary statistics directly to a new NCSS dataset, which can be further analyzed using other capabilities within NCSS. The same summary statistics that are available in the Descriptive Statistics – Summary Tables procedure are available here. Sample summary data output is shown below.
Sample Summary Data Output

