PASS Upgrade Information
- New in PASS 2024
- New in PASS 2023
- New in PASS 2022
- New in PASS 2021
- New in PASS 2020
- New in PASS 2019
- New in PASS 16
- New in PASS 15
- New in PASS 14
- New in PASS 13
- New in PASS 12
- New in PASS 11
What’s New in PASS 2024?
We are pleased to announce the release of PASS 2024. PASS 2024 adds 40 new sample size procedures and includes a variety of enhancements. Among the new procedures are 16 meta-analysis procedures, 4 procedures for comparing two groups with clustering in only one arm, and 13 additional multi-arm treatment versus control procedures. There are also new procedures for specificity, two survival curves using Cox's Proportional Hazards in a cluster-randomized design, and biosimilar tests for two means.
New Procedures in PASS 2024
Meta-Analysis
- Meta-Analysis of Means using a Fixed-Effects Model
- Meta-Analysis of Means using a Random-Effects Model
- Meta-Analysis of Paired Means using a Fixed-Effects Model
- Meta-Analysis of Paired Means using a Random-Effects Model
- Meta-Analysis of Means using a Fixed-Effects Model in a Cluster-Randomized Design
- Meta-Analysis of Means using a Random-Effects Model in a Cluster-Randomized Design
- -
- Meta-Analysis of Correlations using a Fixed-Effects Model
- Meta-Analysis of Correlations using a Random-Effects Model
- -
- Meta-Analysis of Tests for the Odds Ratio of Two Proportions using a Fixed-Effects Model
- Meta-Analysis of Tests for the Odds Ratio of Two Proportions using a Random-Effects Model
- Meta-Analysis of Tests for the Risk Ratio of Two Proportions using a Fixed-Effects Model
- Meta-Analysis of Tests for the Risk Ratio of Two Proportions using a Random-Effects Model
- Meta-Analysis of Tests for the Odds Ratio of Two Proportions using a Fixed-Effects Model in a Cluster-Randomized Design
- Meta-Analysis of Tests for the Odds Ratio of Two Proportions using a Random-Effects Model in a Cluster-Randomized Design
- Meta-Analysis of Tests for the Risk Ratio of Two Proportions using a Fixed-Effects Model in a Cluster-Randomized Design
- Meta-Analysis of Tests for the Risk Ratio of Two Proportions using a Random-Effects Model in a Cluster-Randomized Design
Comparing Two Groups with Clustering in Only One Arm
- Tests for Two Means in a Cluster-Randomized Design with Clustering in Only One Arm
- Non-Inferiority Tests for Two Means in a Cluster-Randomized Design with Clustering in Only One Arm
- -
- Tests for Two Proportions in a Cluster-Randomized Design with Clustering in Only One Arm
- Non-Inferiority Tests for Two Proportions in a Cluster-Randomized Design with Clustering in Only One Arm
Multi-Arm Treatment versus Control
- Multi-Arm Equivalence Tests for Treatment and Control Means in a Cluster-Randomized Design
- Multi-Arm Superiority by a Margin Tests for Treatment and Control Means in a Cluster-Randomized Design
- -
- Multi-Arm Superiority by a Margin Tests for the Difference of Treatment and Control Proportions in a Cluster-Randomized Design
- Multi-Arm Equivalence Tests for the Difference of Treatment and Control Proportions in a Cluster-Randomized Design
- Multi-Arm Equivalence Tests for the Ratio of Treatment and Control Proportions in a Cluster-Randomized Design
- Multi-Arm Non-Inferiority Tests for the Ratio of Treatment and Control Proportions in a Cluster-Randomized Design
- Multi-Arm Superiority by a Margin Tests for the Ratio of Treatment and Control Proportions in a Cluster-Randomized Design
- -
- Multi-Arm Non-Inferiority Tests for Vaccine Efficacy using the Ratio of Treatment and Control Proportions in a Cluster-Randomized Design
- Multi-Arm Superiority by a Margin Tests for Vaccine Efficacy using the Ratio of Treatment and Control Proportions in a Cluster-Randomized Design
- -
- Multi-Arm Tests for Survival Curves using Cox's Proportional Hazards in a Cluster-Randomized Design
- Multi-Arm Non-Inferiority Tests for Survival Curves using Cox's Proportional Hazards in a Cluster-Randomized Design
- Multi-Arm Superiority by a Margin Tests for Survival Curves using Cox's Proportional Hazards in a Cluster-Randomized Design
- Multi-Arm Equivalence Tests for Survival Curves using Cox's Proportional Hazards in a Cluster-Randomized Design
Specificity
- Tests for Paired Specificities
- Tests for Two Independent Specificities
Two Survival Curves using Cox's Proportional Hazards in a Cluster-Randomized Design
- Tests for Two Survival Curves using Cox's Proportional Hazards in a Cluster-Randomized Design
- Non-Inferiority Tests for Two Survival Curves using Cox's Proportional Hazards in a Cluster-Randomized Design
- Superiority by a Margin Tests for Two Survival Curves using Cox's Proportional Hazards in a Cluster-Randomized Design
- Equivalence Tests for Two Survival Curves using Cox's Proportional Hazards in a Cluster-Randomized Design
Biosimilar Tests for Two Means
- Biosimilar Tests for the Difference Between Means using a Parallel, Two-Group Design
Improved Procedures in PASS 2024
Input and/or Output Updates
The output was enhanced in over 525 procedures. For the procedures below, the input, output, and/or documentation was significantly improved:
- Tests for Paired Sensitivities
- Tests for One-Sample Sensitivity and Specificity
- Tests for Two Independent Sensitivities
- -
- Tests for Two Means in a Cluster-Randomized Design
- Non-Inferiority Tests for Two Means in a Cluster-Randomized Design
- Superiority by a Margin Tests for Two Means in a Cluster-Randomized Design
- Equivalence Tests for Two Means in a Cluster-Randomized Design
Summary Statements
Summary statements were significantly improved in 188 procedures. Now, all procedure summary statements are customized to the Solve For selection.
Examples
Example output and/or validation examples were improved in 14 procedures.
System Improvements in PASS 2024
Application Scaling (or Zoom)
Application Scaling (Zoom) was added for the ability to customize the size of text throughout PASS. The default application scale is 25% larger, with the option to customize the application scale (zoom) between 100% (the size of PASS 2023 and earlier) and 200%.
Application Data Reset and Restore
Application Data Reset and Restore functionality was added to System Options to make it easier to restore PASS to its factory default settings and restore saved settings.
Free Trial
Click here to download a free trial of PASS 2024.
Compatibility of PASS 2024
PASS 2024 is fully compatible with Windows 11, 10, 8.1, 8, 7, and Vista SP2, on both 32-bit and 64-bit operating systems. Click here to view the complete system requirements.
Prices
Upgrade from PASS 2023:
$349 (academic/government)
$449 (commercial)
Upgrade from PASS 2022:
$495 (academic/government)
$649 (commercial)
Upgrade from PASS 2021:
$649 (academic/government)
$849 (commercial)
Upgrade from PASS 2020:
$849 (academic/government)
$1049 (commercial)
Upgrade from PASS 2019:
$1049 (academic/government)
$1249 (commercial)
Upgrade from PASS 16:
$1249 (academic/government)
$1449 (commercial)
Upgrade from PASS 15:
$1449 (academic/government)
$1649 (commercial)
Upgrade from PASS 14:
$1649 (academic/government)
$1849 (commercial)
Upgrade from PASS 13*:
$1849 (academic/government)
$2049 (commercial)
*Older versions (e.g., PASS 12, PASS 11, PASS 2008, PASS 2005, PASS 2002, PASS 2000, and PASS 6.0) are not upgradeable. A new license will need to be purchased to obtain PASS 2024.
Click here to view all prices.
Ordering
To order your upgrade, order from our secure online store, email us at sales@ncss.com, call us at 1-800-898-6109 (US only) or (801) 546-0445, or fax us at (801) 546-3907.
Documentation
PDF versions of the documentation are available directly from each procedure window. These may be displayed or printed. The documentation is also available in the help system or online by clicking here.
Procedures added in the PASS 2023 Upgrade from PASS 2022
Multi-Arm Treatment versus Control
- Multi-Arm Tests for Treatment and Control Proportions
- Multi-Arm Non-Inferiority Tests for the Difference Between Treatment and Control Proportions
- Multi-Arm Superiority by a Margin Tests for the Difference Between Treatment and Control Proportions
- Multi-Arm Equivalence Tests for the Difference Between Treatment and Control Proportions
- Multi-Arm Non-Inferiority Tests for the Ratio of Treatment and Control Proportions
- Multi-Arm Superiority by a Margin Tests for the Ratio of Treatment and Control Proportions
- Multi-Arm Equivalence Tests for the Ratio of Treatment and Control Proportions
- Multi-Arm Non-Inferiority Tests for the Odds Ratio of Treatment and Control Proportions
- Multi-Arm Superiority by a Margin Tests for the Odds Ratio of Treatment and Control Proportions
- Multi-Arm Equivalence Tests for the Odds Ratio of Treatment and Control Proportions
- -
- Multi-Arm Tests for Treatment and Control Proportions in a Cluster-Randomized Design
- Multi-Arm Non-Inferiority Tests for Treatment and Control Proportions in a Cluster-Randomized Design
- -
- Multi-Arm Tests for the Difference Between Treatment and Control Means Assuming Equal Variance
- Multi-Arm Non-Inferiority Tests for the Difference Between Treatment and Control Means Assuming Equal Variance
- Multi-Arm Superiority by a Margin Tests for the Difference Between Treatment and Control Means Assuming Equal Variance
- Multi-Arm Equivalence Tests for the Difference Between Treatment and Control Means Assuming Equal Variance
- Multi-Arm Tests for the Ratio of Treatment and Control Means (Normal Data)
- Multi-Arm Non-Inferiority Tests for the Ratio of Treatment and Control Means (Normal Data)
- Multi-Arm Superiority by a Margin Tests for the Ratio of Treatment and Control Means (Normal Data)
- Multi-Arm Equivalence Tests for the Ratio of Treatment and Control Means (Normal Data)
- Multi-Arm Tests for the Ratio of Treatment and Control Means (Log-Normal Data)
- Multi-Arm Non-Inferiority Tests for the Ratio of Treatment and Control Means (Log-Normal Data)
- Multi-Arm Superiority by a Margin Tests for the Ratio of Treatment and Control Means (Log-Normal Data)
- Multi-Arm Equivalence Tests for the Ratio of Treatment and Control Means (Log-Normal Data)
- Multi-Arm Tests for the Difference Between Treatment and Control Means Allowing Unequal Variance
- Multi-Arm Non-Inferiority Tests for the Difference Between Treatment and Control Means Allowing Unequal Variance
- Multi-Arm Superiority by a Margin Tests for the Difference Between Treatment and Control Means Allowing Unequal Variance
- Multi-Arm Equivalence Tests for the Difference Between Treatment and Control Means Allowing Unequal Variance
- -
- Multi-Arm Tests for Treatment and Control Means in a Cluster-Randomized Design
- Multi-Arm Non-Inferiority Tests for Treatment and Control Means in a Cluster-Randomized Design
- -
- Multi-Arm Tests for Treatment and Control Survival Curves using Cox's Proportional Hazards Model
- Multi-Arm Non-Inferiority Tests for Treatment and Control Survival Curves using Cox's Proportional Hazards Model
- Multi-Arm Superiority by a Margin Tests for Treatment and Control Survival Curves using Cox's Proportional Hazards Model
- Multi-Arm Equivalence Tests for Treatment and Control Survival Curves using Cox's Proportional Hazards Model
- -
- Multi-Arm Non-Inferiority Tests for Vaccine Efficacy using the Ratio of Treatment and Control Proportions
- Multi-Arm Superiority by a Margin Tests for Vaccine Efficacy using the Ratio of Treatment and Control Proportions
- Multi-Arm Non-Inferiority Tests for Vaccine Efficacy using Treatment vs. Control Hazard Ratios (Cox's Proportional Hazards Model)
- Multi-Arm Superiority by a Margin Tests for Vaccine Efficacy using Treatment vs. Control Hazard Ratios (Cox's Proportional Hazards Model)
AUC and Cmax
- Bioequivalence Tests for AUC and Cmax in a 2x2 Cross-Over Design (Log-Normal Data)
Win-Ratio Composite Endpoint
- Tests for Two Groups using the Win-Ratio Composite Endpoint
- Tests for Two Groups using the Win-Ratio Composite Endpoint in a Stratified Design
Single-Case (AB)^K Designs
- Tests for the Difference Between Treatment and Control Means in a Balanced Single-Case (AB)^K Design with Multiple Cases
Deming Regression
- Deming Regression
Improved Procedures in PASS 2023
Within-Subject Correlation Input Option
The ρ (Within-Subject Correlation) nuisance parameter input option was added for these procedures.
- Non-Inferiority Tests for the Difference Between Two Correlated Proportions
- Non-Inferiority Tests for the Ratio Between Two Correlated Proportions
- Equivalence Tests for the Difference Between Two Correlated Proportions
- Equivalence Tests for the Ratio Between Two Correlated Proportions
Input and/or Output Updates
For these procedures, the input and/or output was improved.
- Tests for Two Correlated Proportions (McNemar Test)
- Non-Inferiority Tests for the Difference Between Two Correlated Proportions
- Non-Inferiority Tests for the Ratio Between Two Correlated Proportions
- Equivalence Tests for the Difference Between Two Correlated Proportions
- Equivalence Tests for the Ratio Between Two Correlated Proportions
- Tests for Two Correlated Proportions with Incomplete Observations
- GEE Tests for Two Correlated Proportions with Dropout
- Tests for One Mean (Simulation)
- Confidence Intervals for One Mean with Tolerance Probability
- Confidence Intervals for One Mean
- Confidence Intervals for Paired Means with Tolerance Probability
- Confidence Intervals for Paired Means
- Confidence Intervals for the Difference Between Two Means with Tolerance Probability
- Confidence Intervals for the Difference Between Two Means
- Confidence Intervals for One Standard Deviation using Standard Deviation
- Confidence Intervals for One Standard Deviation using Relative Error
- Confidence Intervals for the Ratio of Two Variances using Variances
- Confidence Intervals for the Ratio of Two Variances using Relative Error
- Confidence Intervals for One Proportion
- Confidence Intervals for One Standard Deviation with Tolerance Probability
- Confidence Intervals for One Variance using Variance
- Confidence Intervals for One Variance using Relative Error
- Confidence Intervals for One Variance with Tolerance Probability
- Confidence Intervals for the Difference Between Two Proportions
- Confidence Intervals for the Ratio of Two Proportions
- Confidence Intervals for the Odds Ratio of Two Proportions
- Confidence Intervals for Linear Regression Slope
- Confidence Intervals for Pearson's Correlation
- Confidence Intervals for Spearman's Rank Correlation
- Confidence Intervals for Kendall's Tau-b Correlation
- Confidence Intervals for Point Biserial Correlation
- Confidence Intervals for Intraclass Correlation
- Confidence Intervals for Coefficient Alpha
- Confidence Intervals for Kappa
- Confidence Intervals for the Area Under an ROC Curve
- Confidence Intervals for Michaelis-Menten Parameters
- Confidence Intervals for Cp
- Confidence Intervals for Cpk
- Confidence Intervals for the Exponential Lifetime Mean
- Confidence Intervals for an Exponential Lifetime Percentile
- Confidence Intervals for Exponential Reliability
- Confidence Intervals for the Exponential Hazard Rate
- Confidence Intervals for One-Way Repeated Measures Contrasts
- Confidence Intervals for the Odds Ratio in Logistic Regression with One Binary X
- Confidence Intervals for the Odds Ratio in Logistic Regression with Two Binary X's
- Confidence Intervals for the Interaction Odds Ratio in Logistic Regression with Two Binary X's
- Confidence Intervals for One-Sample Sensitivity
- Confidence Intervals for One-Sample Specificity
- Confidence Intervals for One-Sample Sensitivity and Specificity
- Confidence Intervals for a Percentile of a Normal Distribution
- Confidence Intervals for One Proportion in a Stratified Design
- Confidence Intervals for One Mean in a Stratified Design
- Confidence Intervals for One Mean in a Cluster-Randomized Design
- Confidence Intervals for One Proportion in a Cluster-Randomized Design
- Confidence Intervals for One Proportion in a Stratified Cluster-Randomized Design
- Confidence Intervals for One Mean in a Stratified Cluster-Randomized Design
- Confidence Intervals for the Weibull Shape Parameter
- Confidence Intervals for Intraclass Correlation with Assurance Probability (Lower One-Sided)
- Confidence Intervals for Intraclass Correlation with Assurance Probability (Two-Sided)
- Confidence Intervals for Vaccine Efficacy using a Cohort Design
- Confidence Intervals for Vaccine Efficacy using an Unmatched Case-Control Design
- Confidence Intervals for the Odds Ratio of Two Proportions using an Unmatched Case-Control Design
- Confidence Intervals for the Difference Between Two Correlated Proportions
Input Options for Paired Variable Standard Deviations
For these procedures, paired variable SD's (σ1 and σ2) and Correlation (ρ) and/or Within-Subject Population SD (σᴡ) input options were added.
- Paired T-Tests
- Paired T-Tests for Non-Inferiority
- Paired T-Tests for Superiority by a Margin
- Paired T-Tests for Equivalence
- Paired Z-Tests
- Paired Z-Tests for Non-Inferiority
- Paired Z-Tests for Superiority by a Margin
- Paired Z-Tests for Equivalence
- Paired Wilcoxon Signed-Rank Tests
- Paired Wilcoxon Signed-Rank Tests for Non-Inferiority
- Paired Wilcoxon Signed-Rank Tests for Superiority by a Margin
- Conditional Power and Sample Size Reestimation of Paired T-Tests
- Conditional Power and Sample Size Reestimation of Paired T-Tests for Non-Inferiority
- Conditional Power and Sample Size Reestimation of Paired T-Tests for Superiority by a Margin
- Confidence Intervals for Paired Means
- Confidence Intervals for Paired Means with Tolerance Probability
- Multiple Testing for One Mean (One-Sample or Paired Data)
- Conditional Power and Sample Size Reestimation of Tests for Two Means in a 2x2 Cross-Over Design
- Conditional Power and Sample Size Reestimation of Non-Inferiority Tests for Two Means in a 2x2 Cross-Over Design
- Conditional Power and Sample Size Reestimation of Superiority by a Margin Tests for Two Means in a 2x2 Cross-Over Design
- Tests for Paired Means (Simulation)
- Tests for the Difference Between Two Means in a 2x2 Cross-Over Design
- Non-Inferiority Tests for the Difference Between Two Means in a 2x2 Cross-Over Design
- Superiority by a Margin Tests for the Difference of Two Means in a 2x2 Cross-Over Design
- Equivalence Tests for the Difference Between Two Means in a 2x2 Cross-Over Design
Summary Statements
Summary statements were improved in over 350 procedures.
Documentation
Documentation improvements were made in hundreds of chapters.
Procedures added in the PASS 2022 Upgrade from PASS 2021
Assurance
Assurance is also known as expected power, average power, statistical assurance, hybrid classical-Bayesian procedure, or probability of success. For a brief introduction to assurance in PASS, click here.
- Assurance for Two-Sample T-Tests Assuming Equal Variance
- Assurance for Two-Sample Z-Tests Assuming Equal Variance
- Assurance for Two-Sample T-Tests Allowing Unequal Variance
- Assurance for Two-Sample T-Tests for Non-Inferiority Assuming Equal Variance
- Assurance for Two-Sample T-Tests for Superiority by a Margin Assuming Equal Variance
- Assurance for Two-Sample T-Tests for Equivalence Assuming Equal Variance
- Assurance for Two-Sample T-Tests for Non-Inferiority Allowing Unequal Variance
- Assurance for Two-Sample T-Tests for Superiority by a Margin Allowing Unequal Variance
- Assurance for Two-Sample T-Tests for Equivalence Allowing Unequal Variance
- -
- Assurance for Tests for Two Proportions
- Assurance for Non-Zero Null Tests for the Difference Between Two Proportions
- Assurance for Non-Inferiority Tests for the Difference Between Two Proportions
- Assurance for Superiority by a Margin Tests for the Difference Between Two Proportions
- Assurance for Equivalence Tests for the Difference Between Two Proportions
- Assurance for Non-Unity Null Tests for the Ratio of Two Proportions
- Assurance for Non-Unity Null Tests for the Odds Ratio of Two Proportions
- Assurance for Superiority by a Margin Tests for the Ratio of Two Proportions
- Assurance for Non-Inferiority Tests for the Ratio of Two Proportions
- Assurance for Superiority by a Margin Tests for the Odds Ratio of Two Proportions
- Assurance for Non-Inferiority Tests for the Odds Ratio of Two Proportions
- Assurance for Equivalence Tests for the Ratio of Two Proportions
- Assurance for Equivalence Tests for the Odds Ratio of Two Proportions
- -
- Assurance for Logrank Tests (Freedman)
- Assurance for Tests for Two Survival Curves Using Cox's Proportional Hazards Model
- Assurance for Non-Inferiority Tests for Two Survival Curves Using Cox's Proportional Hazards Model
- Assurance for Superiority by a Margin Tests for Two Survival Curves Using Cox's Proportional Hazards Model
- Assurance for Equivalence Tests for Two Survival Curves Using Cox's Proportional Hazards Model
- Assurance for Tests for the Difference of Two Hazard Rates Assuming an Exponential Model
- Assurance for Non-Inferiority Tests for the Difference of Two Hazard Rates Assuming an Exponential Model
- Assurance for Superiority by a Margin Tests for the Difference of Two Hazard Rates Assuming an Exponential Model
- Assurance for Equivalence Tests for the Difference of Two Hazard Rates Assuming an Exponential Model
- -
- Assurance for Tests for the Ratio of Two Negative Binomial Rates
- Assurance for Non-Inferiority Tests for the Ratio of Two Negative Binomial Rates
- Assurance for Superiority by a Margin Tests for the Ratio of Two Negative Binomial Rates
- Assurance for Equivalence Tests for the Ratio of Two Negative Binomial Rates
- -
- Assurance for Tests for Two Means in a Cluster-Randomized Design
- Assurance for Non-Inferiority Tests for Two Means in a Cluster-Randomized Design
- Assurance for Superiority by a Margin Tests for Two Means in a Cluster-Randomized Design
- Assurance for Equivalence Tests for Two Means in a Cluster-Randomized Design
- Assurance for Tests for Two Proportions in a Cluster-Randomized Design
- Assurance for Non-Zero Null Tests for the Difference of Two Proportions in a Cluster-Randomized Design
- Assurance for Non-Inferiority Tests for the Difference of Two Proportions in a Cluster-Randomized Design
- Assurance for Superiority by a Margin Tests for the Difference of Two Proportions in a Cluster-Randomized Design
- Assurance for Equivalence Tests for the Difference of Two Proportions in a Cluster-Randomized Design
- Assurance for Logrank Tests in a Cluster-Randomized Design
- -
- Assurance for Tests for the Difference Between Two Poisson Rates
- Assurance for Tests for the Ratio of Two Poisson Rates
- Assurance for Non-Inferiority Tests for the Ratio of Two Poisson Rates
- Assurance for Superiority by a Margin Tests for the Ratio of Two Poisson Rates
- Assurance for Equivalence Tests for the Ratio of Two Poisson Rates
- -
- Assurance for Non-Inferiority Tests for Vaccine Efficacy using the Ratio of Two Proportions
- Assurance for Superiority by a Margin Tests for Vaccine Efficacy using the Ratio of Two Proportions
Bridging Studies
- Bridging Study using the Equivalence Test of Two Groups (Continuous Outcome)
- Bridging Study using a Non-Inferiority Test of Two Groups (Continuous Outcome)
- -
- Bridging Study using the Equivalence Test of Two Groups (Binary Outcome)
- Bridging Study using a Non-Inferiority Test of Two Groups (Binary Outcome)
- -
- Bridging Study Sensitivity Index
- Bridging Study Test of Sensitivity using a Two-Group T-Test (Continuous Outcome)
Group-Sequential Tests (with Efficacy & Futility Boundary Options)
For each of these group-sequential power and sample size procedures, there are corresponding group-sequential analysis and sample-size re-estimation procedures in NCSS 2022.
- Group-Sequential Tests for Two Poisson Rates (Simulation)
- Group-Sequential Non-Inferiority Tests for Two Poisson Rates (Simulation)
- Group-Sequential Superiority by a Margin Tests for Two Poisson Rates (Simulation)
- -
- Group-Sequential Tests for One Hazard Rate (Simulation)
- Group-Sequential Non-Inferiority Tests for One Hazard Rate (Simulation)
- Group-Sequential Superiority by a Margin Tests for One Hazard Rate (Simulation)
- -
- Group-Sequential Tests for One Poisson Rate (Simulation)
- Group-Sequential Non-Inferiority Tests for One Poisson Rate (Simulation)
- Group-Sequential Superiority by a Margin Tests for One Poisson Rate (Simulation)
Mann-Whitney
- Mann-Whitney U or Wilcoxon Rank-Sum Tests (Noether)
- Stratified Wilcoxon-Mann-Whitney (van Elteren) Test
Acceptance Sampling
- Acceptance Sampling for Attributes with Zero Nonconformities
- Acceptance Sampling for Attributes with Fixed Nonconformities
Other
- Tests for the Ratio of Two Poisson Rates (Zhu)
Improved Procedures in PASS 2022
Conditional Power and Sample Size Reestimation
The conditional power procedures for means were improved to include the option of Tk or Zk.
- Conditional Power and Sample Size Reestimation of Tests for Two Means in a 2x2 Cross-Over Design
- Conditional Power and Sample Size Reestimation of Non-Inferiority Tests for Two Means in a 2x2 Cross-Over Design
- Conditional Power and Sample Size Reestimation of Superiority by a Margin Tests for Two Means in a 2x2 Cross-Over Design
- Conditional Power and Sample Size Reestimation of Paired T-Tests
- Conditional Power and Sample Size Reestimation of Paired T-Tests for Non-Inferiority
- Conditional Power and Sample Size Reestimation of Paired T-Tests for Superiority by a Margin
- Conditional Power and Sample Size Reestimation of Two-Sample T-Tests
- Conditional Power and Sample Size Reestimation of Two-Sample T-Tests for Non-Inferiority
- Conditional Power and Sample Size Reestimation of Two-Sample T-Tests for Superiority by a Margin
- Conditional Power and Sample Size Reestimation of One-Sample T-Tests
- Conditional Power and Sample Size Reestimation of One-Sample T-Tests for Non-Inferiority
- Conditional Power and Sample Size Reestimation of One-Sample T-Tests for Superiority by a Margin
Acceptance Sampling
This procedure was improved to allow Lot Size to take on multiple values.
- Acceptance Sampling for Attributes
Difference of Two Proportions
For these procedures, the option to input a proportion and a proportion difference was added.
- Non-Zero Null Tests for the Difference Between Two Proportions
- Non-Inferiority Tests for the Difference Between Two Proportions
- Superiority by a Margin Tests for the Difference Between Two Proportions
- Equivalence Tests for the Difference Between Two Proportions
Simple Linear Regression
An R-Squared option for variance input was added in these procedures.
- Simple Linear Regression
- Non-Zero Null Tests for Simple Linear Regression
- Non-Inferiority Tests for Simple Linear Regression
- Superiority by a Margin Tests for Simple Linear Regression
- Equivalence Tests for Simple Linear Regression
Summary Statements
Summary statements were improved in 85 procedures.
Enhancements in PASS 2022
Windows 11 Compatibility
Testing was performed and the appropriate modifications were completed to make PASS 2022 compatible with Windows 11.
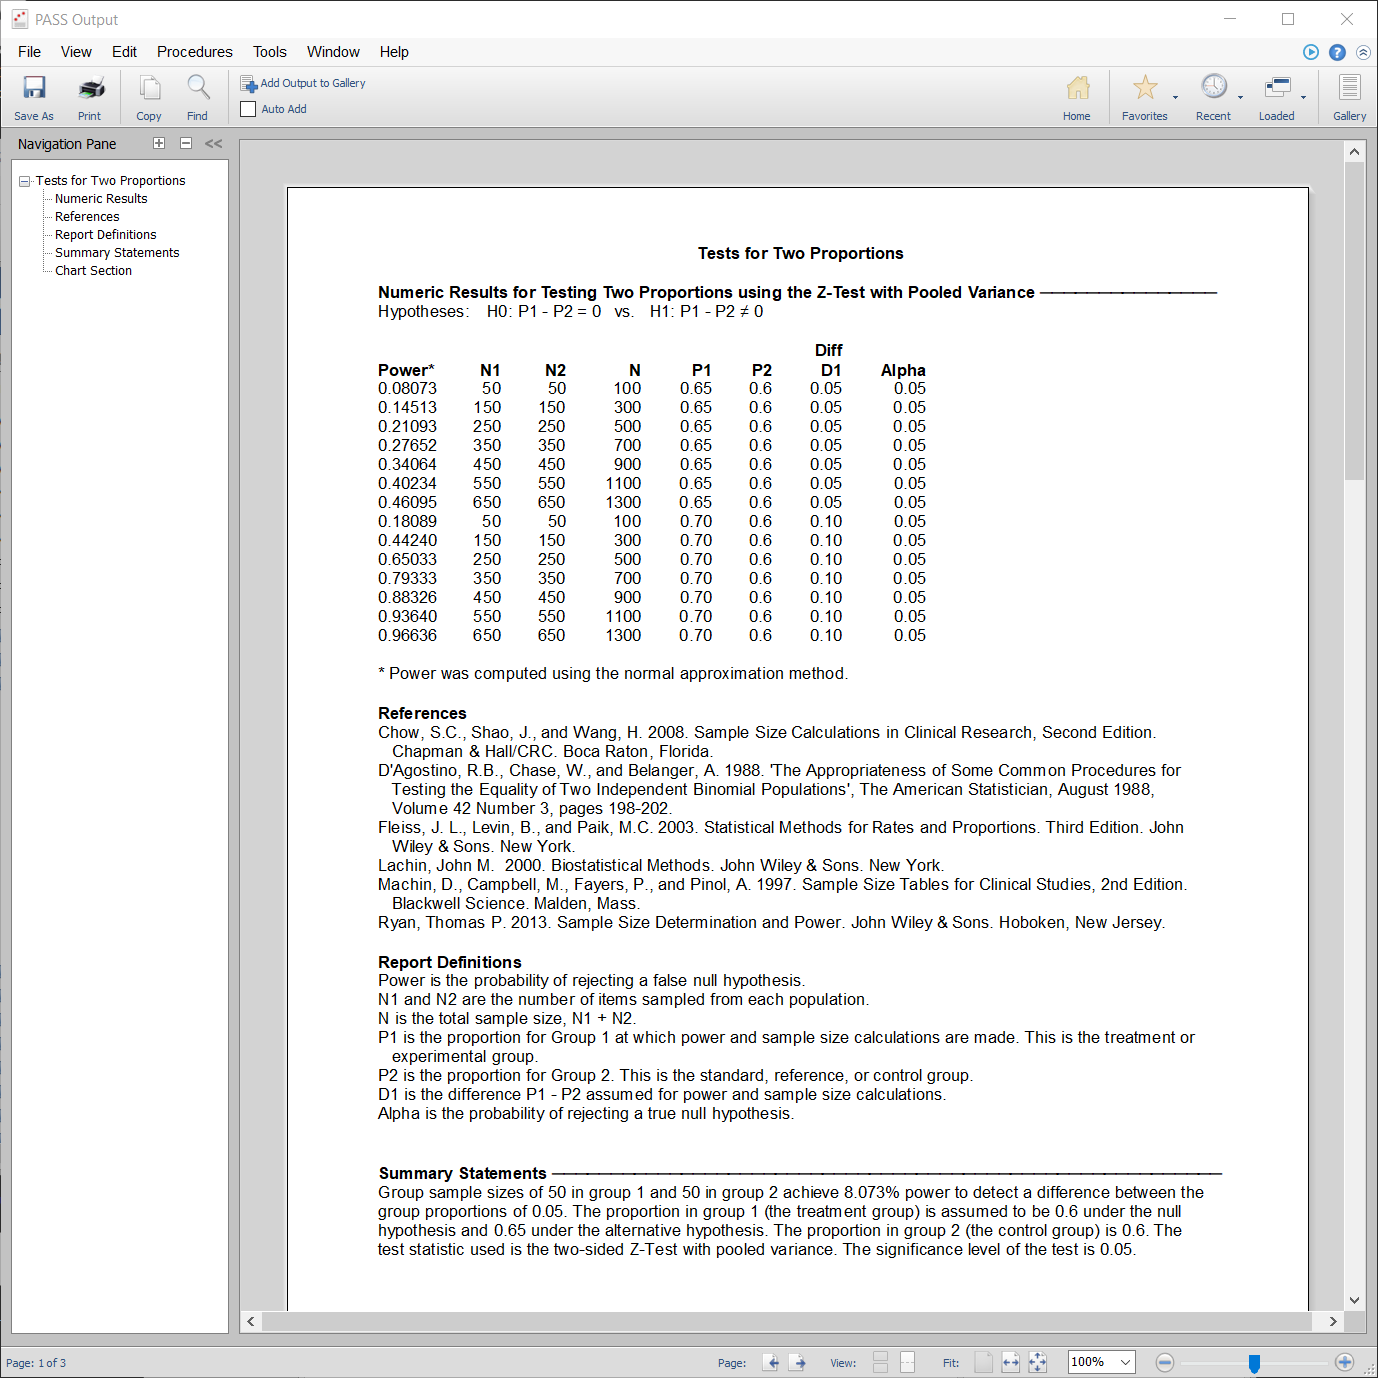
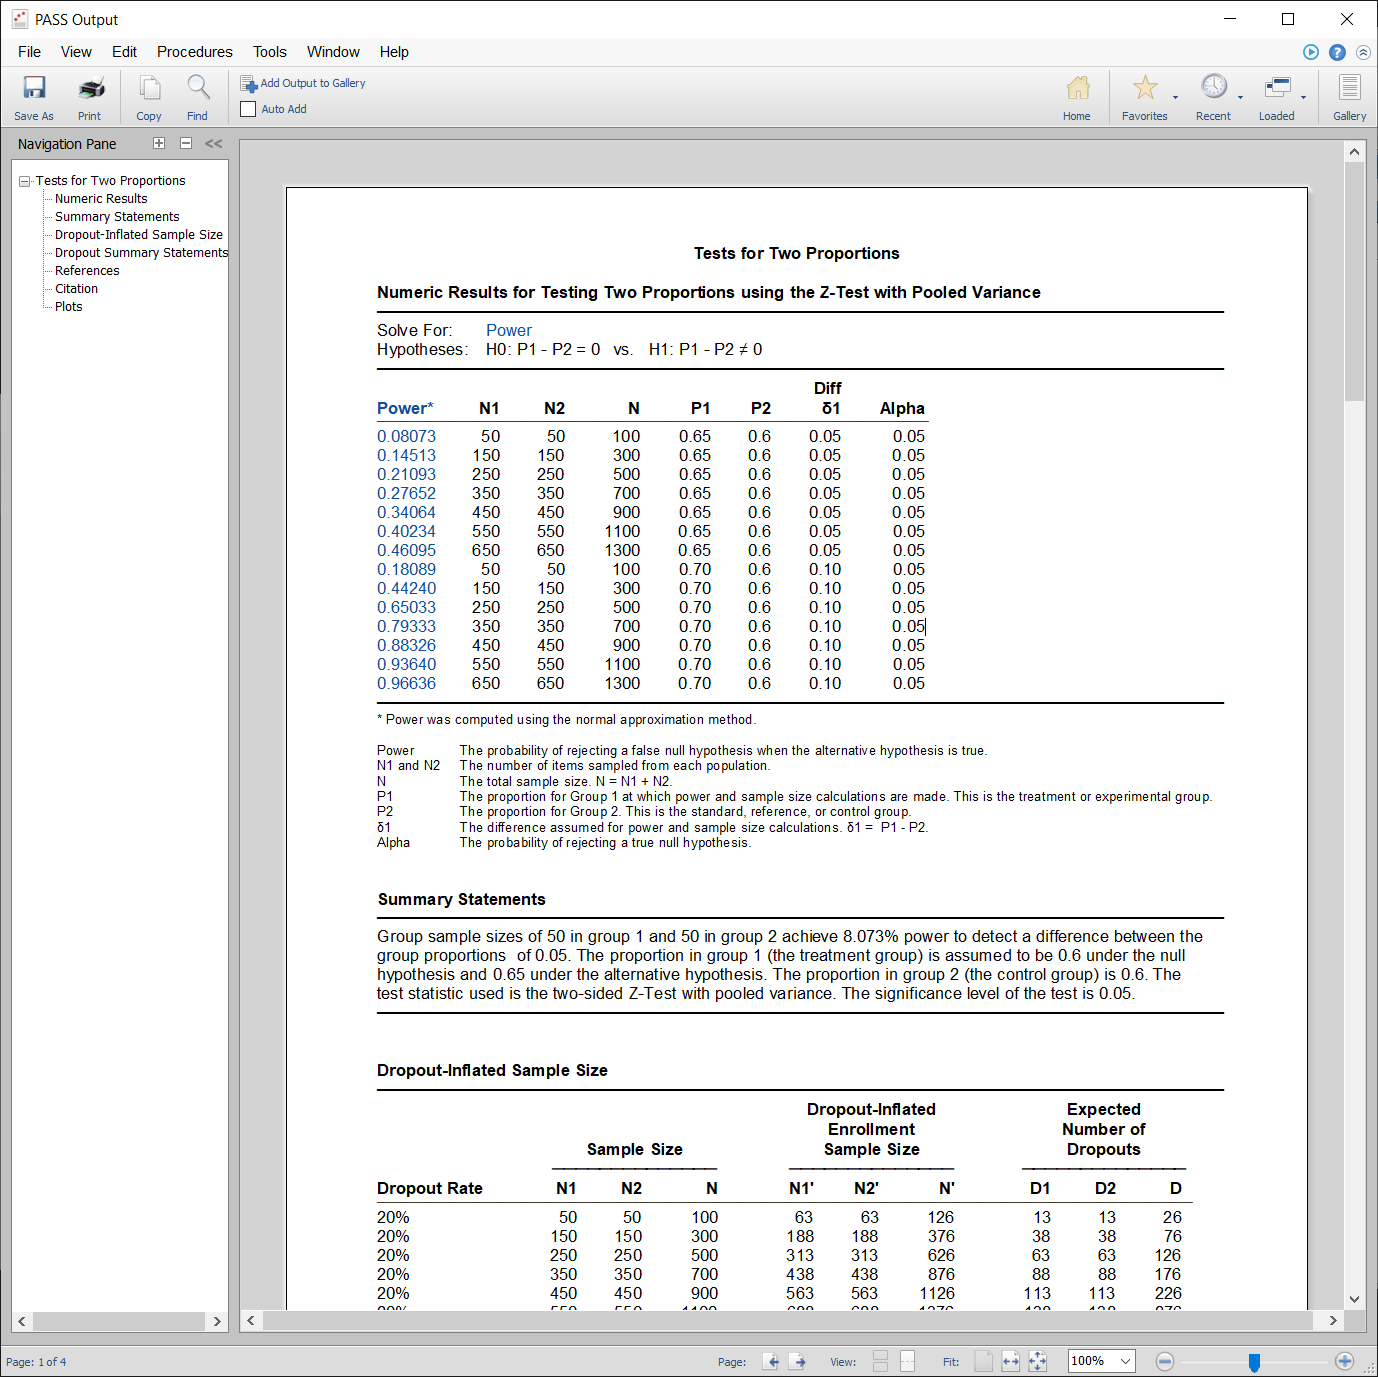
Output Format
The output for all procedures was improved to produce a more readable table format.
Old Output Format
New Output Format
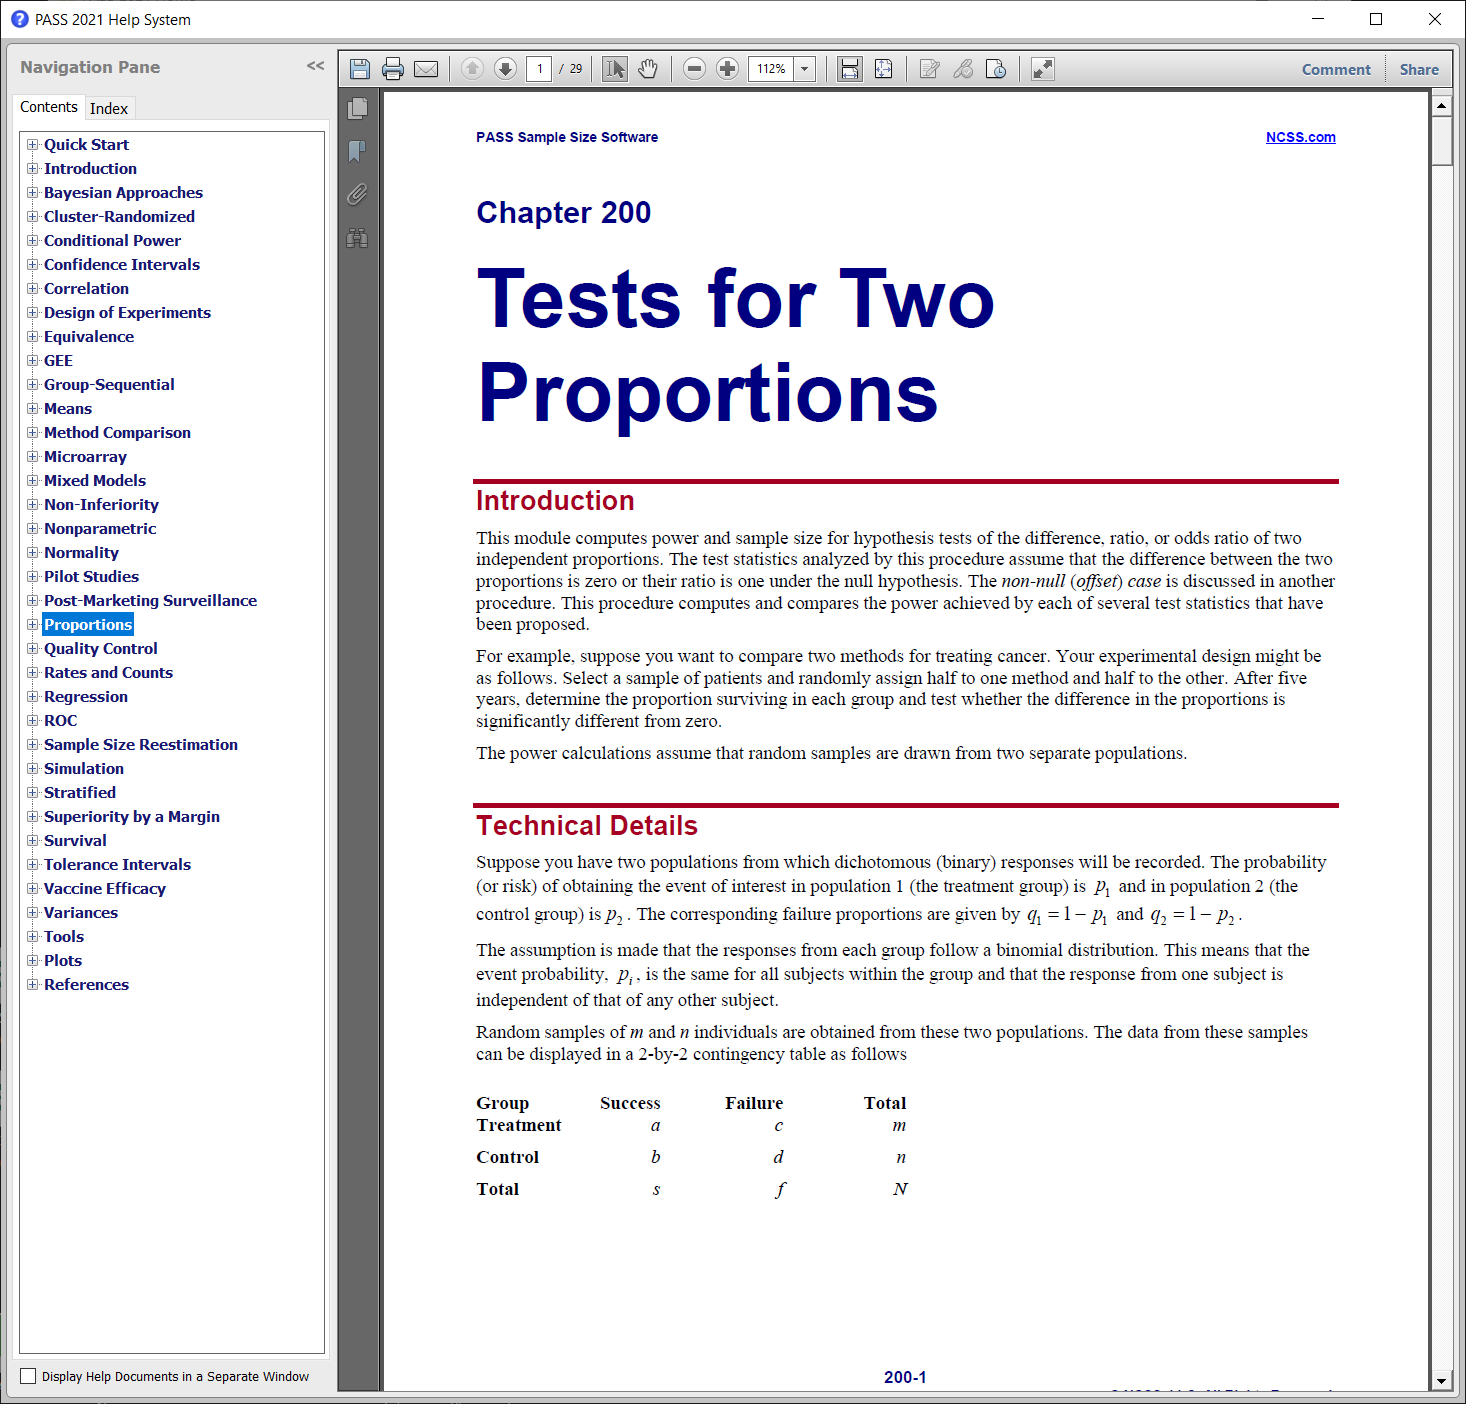
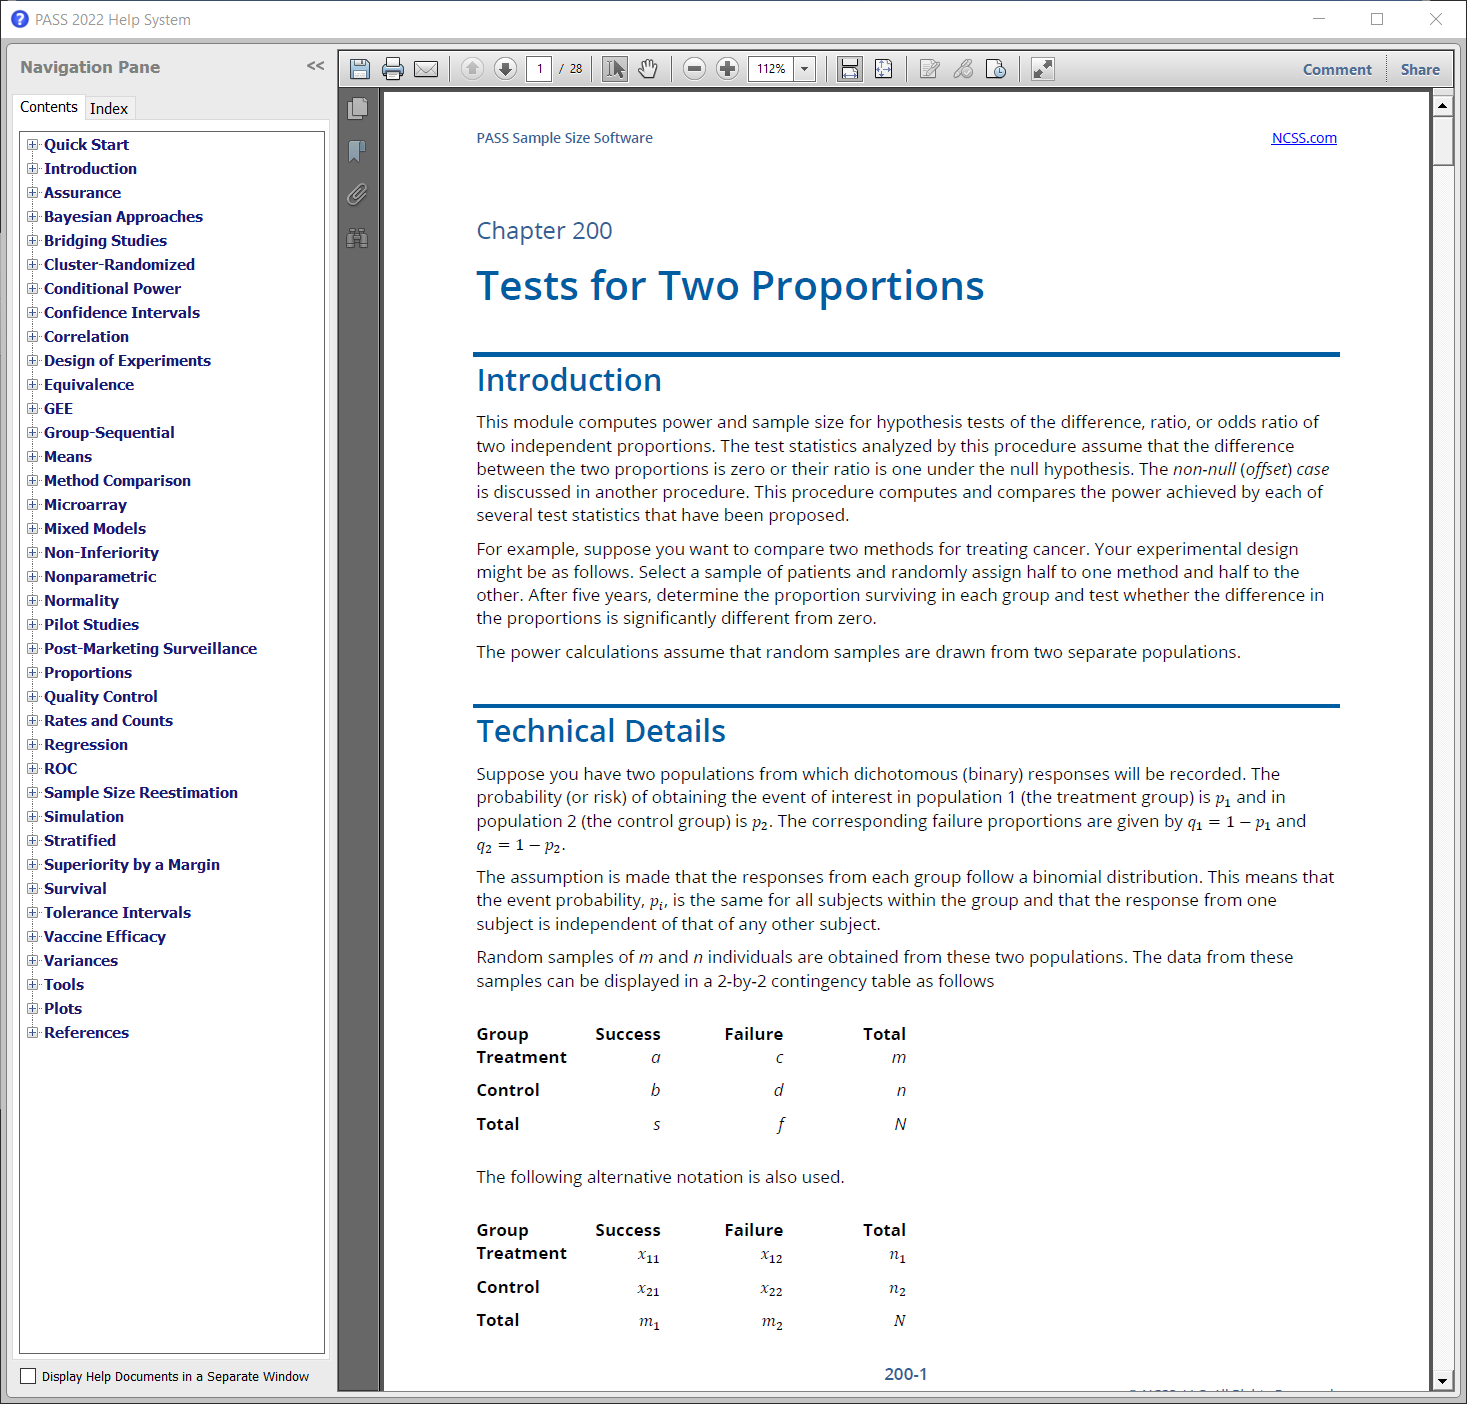
Documentation
All documentation was updated to provide improved readability and consistency.
Old Documentation Appearance
New Documentation Appearance
Procedures added in the PASS 2021 Upgrade from PASS 2020
Vaccine Efficacy
- Confidence Intervals for Vaccine Efficacy using a Cohort Design
- Confidence Intervals for Vaccine Efficacy using an Unmatched Case-Control Design
- -
- Superiority by a Margin Tests for Vaccine Efficacy using the Ratio of Two Proportions
- Non-Inferiority Tests for Vaccine Efficacy using the Ratio of Two Proportions
- Superiority by a Margin Tests for Vaccine Efficacy using the Ratio of Two Proportions in a Cluster-Randomized Design
- Non-Inferiority Tests for Vaccine Efficacy using the Ratio of Two Proportions in a Cluster-Randomized Design
- -
- Superiority by a Margin Tests for Vaccine Efficacy using the Ratio of Two Poisson Rates
- Non-Inferiority Tests for Vaccine Efficacy using the Ratio of Two Poisson Rates
- Superiority by a Margin Tests for Vaccine Efficacy using the Ratio of Two Poisson Rates in a Cluster-Randomized Design
- Non-Inferiority Tests for Vaccine Efficacy using the Ratio of Two Poisson Rates in a Cluster-Randomized Design
- -
- Superiority by a Margin Tests for Vaccine Efficacy using the Ratio of Two Negative Binomial Rates
- Non-Inferiority Tests for Vaccine Efficacy using the Ratio of Two Negative Binomial Rates
- -
- Superiority by a Margin Tests for Vaccine Efficacy using the Hazard Ratio (Cox's Proportional Hazards Model)
- Non-Inferiority Tests for Vaccine Efficacy using the Hazard Ratio (Cox's Proportional Hazards Model)
- -
- Tests for Vaccine Efficacy with Extremely Low Incidence
- Superiority by a Margin Tests for Vaccine Efficacy with Extremely Low Incidence
- Non-Inferiority Tests for Vaccine Efficacy with Extremely Low Incidence
- -
- Tests for Vaccine Efficacy with Composite Efficacy Measure (Ratio)
- Tests for Vaccine Efficacy with Composite Efficacy Measure (Difference)
Group-Sequential Tests (with Efficacy & Futility Boundary Options)
For each of these group-sequential power and sample size procedures, there are corresponding group-sequential analysis and sample-size re-estimation procedures in NCSS 2021.
- Group-Sequential Non-Inferiority Tests for One Mean with Known Variance (Simulation)
- Group-Sequential Superiority by a Margin Tests for One Mean with Known Variance (Simulation)
- -
- Group-Sequential Non-Inferiority T-Tests for One Mean (Simulation)
- Group-Sequential Superiority by a Margin T-Tests for One Mean (Simulation)
- -
- Group-Sequential Tests for One Proportion (Simulation)
- Group-Sequential Non-Inferiority Tests for One Proportion (Simulation)
- Group-Sequential Superiority by a Margin Tests for One Proportion (Simulation)
Ratio of Two Means
- Tests for the Ratio of Two Means (Normal Data)
- Non-Inferiority Tests for the Ratio of Two Means (Normal Data)
- Superiority by a Margin Tests for the Ratio of Two Means (Normal Data)
- Equivalence Tests for the Ratio of Two Means in a 2x2 Cross-Over Design (Normal Data)
Two Poisson Rates in a Cluster-Randomized Design
- Superiority by a Margin Tests for the Difference Between Two Poisson Rates in a Cluster-Randomized Design
- Non-Inferiority Tests for the Difference Between Two Poisson Rates in a Cluster-Randomized Design
- -
- Superiority by a Margin Tests for the Ratio of Two Poisson Rates in a Cluster-Randomized Design
- Non-Inferiority Tests for the Ratio of Two Poisson Rates in a Cluster-Randomized Design
Method Comparison Studies
- Exact Method for Assessing Agreement in Method Comparison Studies
Confidence Intervals
- Confidence Intervals for a Percentile of a Normal Distribution using Assurance Probability
- Confidence Intervals for a Percentile of a Normal Distribution using Expected Width
- -
- Confidence Intervals for the Bland-Altman Range of Agreement using Assurance Probability
- Confidence Intervals for the Bland-Altman Range of Agreement using Expected Width
- -
- Confidence Intervals for Regression-Based Reference Limits using Assurance Probability
- Confidence Intervals for Regression-Based Reference Limits using Expected Relative Precision
Studentized Range
- Studentized Range Test
- Studentized Range Tests for Equivalence
- Non-Zero Null Studentized Range Tests
Analysis of Variance
- One-Way Analysis of Variance Contrasts Allowing Unequal Variances
- One-Way Analysis of Variance Contrasts Assuming Equal Variances
- -
- One-Way Analysis of Variance Allowing Unequal Variances
- One-Way Analysis of Variance Assuming Equal Variances (F-Tests)
- One-Way Analysis of Variance F-Tests using Effect Size
- -
- Equivalence Tests for One-Way Analysis of Variance Assuming Equal Variances
- Equivalence Tests for One-Way Analysis of Variance Allowing Unequal Variances
- Non-Zero Null Tests for One-Way Analysis of Variance Assuming Equal Variances
- -
- 2x2 Factorial Analysis of Variance Allowing Unequal Variances
Analysis of Covariance
- Analysis of Covariance (ANCOVA)
- Analysis of Covariance Contrasts
Two Ordered Categorical Variables
- Tests for Two Ordered Categorical Variables (Non Proportional Odds, Wilcoxon-Mann-Whitney)
Logrank Tests
- Logrank Tests (Freedman)
Weibull
- One-Sample Tests of Weibull Hazard Rates
- Confidence Interval for Weibull Shape Parameter
Fisher's Exact Test
- Fisher's Exact Test
Intraclass Correlation
- Confidence Intervals for Intraclass Correlation with Assurance Probability (Lower One-Sided)
- Confidence Intervals for Intraclass Correlation with Assurance Probability (Two-Sided)
Two Proportions
- Confidence Intervals for Odds Ratio of Two Proportions using an Unmatched Case-Control Design
- Confidence Intervals for the Difference of Two Correlated Proportions
Phase II Selection Design
- Randomized Phase II Selection Design for Binary Data (Simon)
Dose-Finding
- Dose-Finding using the Bayesian Continual Reassessment Method (CRM)
Bayesian Approach
- Tests of Two Means Assuming Equal Variances using a Bayesian Approach
Three-Arm Mean Ratio
- Equivalence Tests for the Mean Ratio in a Three-Arm Trial (Normal Data)
Enhancements in PASS 2021
Report Auto-sizing
A program-wide auto-sizing of report columns was integrated, giving improved column spacing in reports.
Old Report Columns Display
New Report Columns Display
Random Seed
For all procedures that utilize random number generation, a Random Seed option was added, to obtain output reproducibility.
Decimals Display
A system-wide improvement was implemented to better determine the number of decimals to display in each column.
Access Improvements
The Report Options dropdown was added to the Procedure Window toolbar. The menu and toolbar of the Output and Gallery windows were updated.
Window Loading Time
Optimization techniques were employed to improve the loading time of various windows.
Operational Qualification (Validation) Processing Time
The time to execute the operational qualification (all-procedure validation) was significantly reduced.
Procedures added in the PASS 2020 Upgrade from PASS 2019
Group-Sequential Tests (with Futility Boundary Options)
For each of these group-sequential power and sample size procedures, there are corresponding group-sequential analysis and sample-size re-estimation procedures in NCSS 2020.
- Group-Sequential Tests for Two Hazard Rates (Simulation)
- Group-Sequential Non-Inferiority Tests for Two Hazard Rates (Simulation)
- Group-Sequential Superiority by a Margin Tests for Two Hazard Rates (Simulation)
- -
- Group-Sequential Non-Inferiority Tests for Two Means with Known Variances (Simulation)
- Group-Sequential Superiority by a Margin Tests for Two Means with Known Variances (Simulation)
- Group-Sequential Non-Inferiority T-Tests for Two Means (Simulation)
- Group-Sequential Superiority by a Margin T-Tests for Two Means (Simulation)
- -
- Group-Sequential Non-Inferiority Tests for Two Proportions (Simulation)
- Group-Sequential Superiority by a Margin Tests for Two Proportions (Simulation)
- -
- Group-Sequential Tests for One Mean with Known Variance (Simulation)
- Group-Sequential T-Tests for One Mean (Simulation)
GEE Tests
- GEE Tests for Two Means in a Stratified Cluster-Randomized Design
- GEE Tests for Two Means in a Cluster-Randomized Design
- GEE Tests for Multiple Means in a Cluster-Randomized Design
- GEE Tests for Multiple Proportions in a Cluster-Randomized Design
- GEE Tests for Multiple Poisson Rates in a Cluster-Randomized Design
- GEE Tests for Two Correlated Proportions with Dropout
Post-Marketing Surveillance for Poisson Rates
- Tests for One Poisson Rate with No Background Incidence (Post-Marketing Surveillance)
- Tests for One Poisson Rate with Known Background Incidence (Post-Marketing Surveillance)
- -
- Tests for Two Poisson Rates with Background Incidence Estimated by the Control (Post-Marketing Surveillance)
- Tests for Two Poisson Rates in a Matched Case-Control Design (Post-Marketing Surveillance)
Split-Mouth Design
- Tests for Two Means in a Split-Mouth Design
- Tests for Two Proportions in a Split-Mouth Design
Confidence Intervals in Cluster and/or Stratified Designs
- Confidence Intervals for One Proportion in a Stratified Design
- Confidence Intervals for One Proportion in a Cluster-Randomized Design
- Confidence Intervals for One Proportion in a Stratified Cluster-Randomized Design
- -
- Confidence Intervals for One Mean in a Stratified Design
- Confidence Intervals for One Mean in a Cluster-Randomized Design
- Confidence Intervals for One Mean in a Stratified Cluster-Randomized Design
Other Cluster-Randomized Design Scenarios
- Tests for Two Proportions in a Stratified Cluster-Randomized Design (Cochran-Mantel-Haenszel Test)
- Tests for the Difference Between Two Poisson Rates in a Cluster-Randomized Design with Adjustment for Varying Cluster Sizes
- Mixed Models Tests for Two Means in a Cluster-Randomized Design
Other Proportion Tests
- Tests for Two Correlated Proportions with Incomplete Observations
- Tests for Multiple Proportions in a One-Way Design
- Two-Stage Designs for Tests of One Proportion (Simon)
Multiple Poisson Rates
- Tests for Multiple Poisson Rates in a One-Way Design
Exponential Hazard Rate
- One-Sample Tests for Exponential Hazard Rate
Ratio of Two Means
- Equivalence Tests for the Ratio of Two Means (Normal Data)
Procedures that were Updated and/or Improved in PASS 2020
Randomization Lists
- Randomization Lists
Conditional Power and Sample Size Re-estimation
- Conditional Power and Sample Size Reestimation of Logrank Tests
- Conditional Power and Sample Size Reestimation of Non-Inferiority Logrank Tests
- Conditional Power and Sample Size Reestimation of Superiority by a Margin Logrank Tests
- -
- Conditional Power and Sample Size Reestimation of Tests for the Difference Between Two Proportions
- Conditional Power and Sample Size Reestimation of Non-Inferiority Tests for Two Proportions
- Conditional Power and Sample Size Reestimation of Superiority by a Margin Tests for Two Proportions
- -
- Conditional Power and Sample Size Reestimation of Tests for One Proportion
- Conditional Power and Sample Size Reestimation of Non-Inferiority Tests for One Proportion
- Conditional Power and Sample Size Reestimation of Superiority by a Margin Tests for One Proportion
- -
- Conditional Power and Sample Size Reestimation of Tests for Two Means in a 2x2 Cross-Over Design
- Conditional Power and Sample Size Reestimation of Non-Inferiority Tests for Two Means in a 2x2 Cross-Over Design
- Conditional Power and Sample Size Reestimation of Superiority by a Margin Tests for Two Means in a 2x2 Cross-Over Design
- -
- Conditional Power and Sample Size Reestimation of Paired T-Tests
- Conditional Power and Sample Size Reestimation of Paired T-Tests for Non-Inferiority
- Conditional Power and Sample Size Reestimation of Paired T-Tests for Superiority by a Margin
- -
- Conditional Power and Sample Size Reestimation of Two-Sample T-Tests
- Conditional Power and Sample Size Reestimation of Two-Sample T-Tests for Non-Inferiority
- Conditional Power and Sample Size Reestimation of Two-Sample T-Tests for Superiority by a Margin
- -
- Conditional Power and Sample Size Reestimation of One-Sample T-Tests
- Conditional Power and Sample Size Reestimation of One-Sample T-Tests for Non-Inferiority
- Conditional Power and Sample Size Reestimation of One-Sample T-Tests for Superiority by a Margin
One-Way ANOVA
- One-Way Analysis of Variance F-Tests
- One-Way Analysis of Variance F-Tests using Effect Size
- One-Way Analysis of Variance Contrasts
Simulation of Means Tests
- Tests for One Mean (Simulation)
- Tests for Paired Means (Simulation)
- Tests for Two Means (Simulation)
- Mann-Whitney U or Wilcoxon Rank-Sum Tests (Simulation)
Other Tests
- Equivalence Tests for the Ratio of Two Means (Log-Normal Data)
- -
- Tests for Two Proportions in a Stratified Design (Cochran-Mantel-Haenszel Test)
- -
- Tests for the Difference Between Two Poisson Rates in a Cluster-Randomized Design
- -
- Tests for Two Correlated Proportions (McNemar Test)
Procedures added in the PASS 2019 Upgrade from PASS 16
Group-Sequential Tests (with Futility Boundary Options)
For each of these group-sequential power and sample size procedures, there are corresponding group-sequential analysis and sample-size re-estimation procedures in NCSS 2019.
- Group-Sequential Tests for Two Means with Known Variances (Simulation)
- Group-Sequential T-Tests for Two Means (Simulation)
- Group-Sequential Tests for Two Proportions (Simulation)
Conditional Power
- Conditional Power of Two-Sample T-Tests for Non-Inferiority
- Conditional Power of Two-Sample T-Tests for Superiority by a Margin
- -
- Conditional Power of Non-Inferiority Tests for the Difference Between Two Proportions
- Conditional Power of Superiority by a Margin Tests for the Difference Between Two Proportions
- -
- Conditional Power of Non-Inferiority Logrank Tests
- Conditional Power of Superiority by a Margin Logrank Tests
- -
- Conditional Power of Non-Inferiority Tests for Two Means in a 2x2 Cross-Over Design
- Conditional Power of Superiority by a Margin Tests for Two Means in a 2x2 Cross-Over Design
- -
- Conditional Power of One-Sample T-Tests for Non-Inferiority
- Conditional Power of One-Sample T-Tests for Superiority by a Margin
- -
- Conditional Power of Paired T-Tests for Non-Inferiority
- Conditional Power of Paired T-Tests for Superiority by a Margin
- -
- Conditional Power of Non-Inferiority Tests for One Proportion
- Conditional Power of Superiority by a Margin Tests for One Proportion
Tests of Mediation Effect
- Tests of Mediation Effect using the Sobel Test
- Tests of Mediation Effect in Linear Regression
- Tests of Mediation Effect in Logistic Regression
- Tests of Mediation Effect in Poisson Regression
- Tests of Mediation Effect in Cox Regression
- Joint Tests of Mediation in Linear Regression with Continuous Variables
Two Proportions
- Superiority by a Margin Tests for the Difference Between Two Proportions
- Superiority by a Margin Tests for the Ratio of Two Proportions
- Superiority by a Margin Tests for the Odds Ratio of Two Proportions
- Superiority by a Margin Tests for the Difference of Two Proportions in a Cluster-Randomized Design
- Superiority by a Margin Tests for the Ratio of Two Proportions in a Cluster-Randomized Design
Mixed Models Tests
- Mixed Models Tests for Two Means at the End of Follow-Up in a 3-Level Hierarchical Design (Level-3 Randomization)
- Mixed Models Tests for Two Means at the End of Follow-Up in a 2-Level Hierarchical Design
- -
- Mixed Models Tests for Interaction in a 2×2 Factorial 2-Level Hierarchical Design (Level-2 Randomization)
- Mixed Models Tests for Interaction in a 2×2 Factorial 2-Level Hierarchical Design (Level-1 Randomization)
- -
- Mixed Models Tests for Interaction in a 2×2 Factorial 3-Level Hierarchical Design (Level-3 Randomization)
- Mixed Models Tests for Interaction in a 2×2 Factorial 3-Level Hierarchical Design (Level-2 Randomization)
- Mixed Models Tests for Interaction in a 2×2 Factorial 3-Level Hierarchical Design (Level-1 Randomization)
- -
- Mixed Models Tests for Slope-Interaction in a 2×2 Factorial 3-Level Hierarchical Design with Random Slopes (Level-3 Randomization)
- Mixed Models Tests for Slope-Interaction in a 2×2 Factorial 3-Level Hierarchical Design with Random Slopes (Level-2 Randomization)
- Mixed Models Tests for Slope-Interaction in a 2×2 Factorial 2-Level Hierarchical Design with Random Slopes (Level-2 Randomization)
- -
- Mixed Models Tests for Slope-Interaction in a 2×2 Factorial 3-Level Hierarchical Design with Fixed Slopes (Level-3 Randomization)
- Mixed Models Tests for Slope-Interaction in a 2×2 Factorial 3-Level Hierarchical Design with Fixed Slopes (Level-2 Randomization)
- Mixed Models Tests for Slope-Interaction in a 2×2 Factorial 2-Level Hierarchical Design with Fixed Slopes (Level-2 Randomization)
Simple Linear Regression
- Simple Linear Regression
- Non-Zero Null Tests for Simple Linear Regression
- Non-Inferiority Tests for Simple Linear Regression
- Superiority by a Margin Tests for Simple Linear Regression
- Equivalence Tests for Simple Linear Regression
- Simple Linear Regression using R-Squared
- Non-Zero Null Tests for Simple Linear Regression using R-Squared
Multiple Regression
- Multiple Regression
Bayesian Adjustment
- Bayesian Adjustment using the Posterior Error Approach
Reference Intervals
- Reference Intervals for Normal Data
- Nonparametric Reference Intervals for Non-Normal Data
Pilot Studies
- UCL of the Standard Deviation from a Pilot Study
- Sample Size of a Pilot Study using the Upper Confidence Limit of the SD
- Sample Size of a Pilot Study using the Non-Central t to Allow for Uncertainty in the SD
- Required Sample Size to Detect a Problem in a Pilot Study
- Pilot Study Sample Size Rules of Thumb
Two Groups, Two-Part Model
- Tests for Two Groups Assuming a Two-Part Model
- Tests for Two Groups Assuming a Two-Part Model with Detection Limits
Bland-Altman Method
- Bland-Altman Method for Assessing Agreement in Method Comparison Studies
Within-Subject Variances
- Equivalence Tests for the Ratio of Two Within-Subject Variances in a Parallel Design
- Non-Inferiority Tests for the Ratio of Two Within-Subject Variances in a Parallel Design
- Superiority by a Margin Tests for the Ratio of Two Within-Subject Variances in a Parallel Design
- Tests for the Ratio of Two Within-Subject Variances in a Parallel Design
- Non-Unity Null Tests for the Ratio of Within-Subject Variances in a Parallel Design
- -
- Equivalence Tests for the Ratio of Two Within-Subject Variances in a 2×2M Replicated Cross-Over Design
- Non-Inferiority Tests for the Ratio of Two Within-Subject Variances in a 2×2M Replicated Cross-Over Design
- Superiority by a Margin Tests for the Ratio of Two Within-Subject Variances in a 2×2M Replicated Cross-Over Design
- Tests for the Ratio of Two Within-Subject Variances in a 2×2M Replicated Cross-Over Design
- Non-Unity Null Tests for the Ratio of Within-Subject Variances in a 2×2M Replicated Cross-Over Design
Within-Subject CV's
- Tests for the Difference of Two Within-Subject CV's in a Parallel Design
- Non-Zero Null Tests for the Difference of Two Within-Subject CV's in a Parallel Design
- Non-Inferiority Tests for the Difference of Two Within-Subject CV's in a Parallel Design
- Superiority by a Margin Tests for the Difference of Two Within-Subject CV's in a Parallel Design
- Equivalence Tests for the Difference of Two Within-Subject CV's in a Parallel Design
Variance Ratios
- Tests for the Ratio of Two Variances
- Non-Unity Null Tests for the Ratio of Two Variances
- Non-Inferiority Tests for the Ratio of Two Variances
- Superiority by a Margin Tests for the Ratio of Two Variances
- Equivalence Tests for the Ratio of Two Variances
Between-Subject Variances
- Tests for Two Between-Subject Variances in a 2×2M Replicated Cross-Over Design
- Non-Unity Null Tests for Two Between-Subject Variances in a 2×2M Replicated Cross-Over Design
- Non-Inferiority Tests for Two Between-Subject Variances in a 2×2M Replicated Cross-Over Design
- Superiority by a Margin Tests for Two Between-Subject Variances in a 2×2M Replicated Cross-Over Design
Two Total Variances
- Tests for Two Total Variances in a 2×2M Replicated Cross-Over Design
- Non-Unity Null Tests for Two Total Variances in a 2×2M Replicated Cross-Over Design
- Non-Inferiority Tests for Two Total Variances in a 2×2M Replicated Cross-Over Design
- Superiority by a Margin Tests for Two Total Variances in a 2×2M Replicated Cross-Over Design
- -
- Tests for Two Total Variances in a Replicated Design
- Non-Unity Null Tests for Two Total Variances in a Replicated Design
- Non-Inferiority Tests for Two Total Variances in a Replicated Design
- Superiority by a Margin Tests for Two Total Variances in a Replicated Design
- -
- Tests for Two Total Variances in a 2×2 Cross-Over Design
- Non-Unity Null Tests for Two Total Variances in a 2×2 Cross-Over Design
- Non-Inferiority Tests for Two Total Variances in a 2×2 Cross-Over Design
- Superiority by a Margin Tests for Two Total Variances in a 2×2 Cross-Over Design
Two Between Variances
- Tests for Two Between Variances in a Replicated Design
- Non-Unity Null Tests for Two Between Variances in a Replicated Design
- Non-Inferiority Tests for Two Between Variances in a Replicated Design
- Superiority by a Margin Tests for Two Between Variances in a Replicated Design
One Mean
- One-Sample T-Tests
- One-Sample Z-Tests
- One-Sample Z-Tests for Non-Inferiority
- One-Sample Z-Tests for Superiority by a Margin
- One-Sample Z-Tests for Equivalence
Wilcoxon Signed-Rank Tests
- Wilcoxon Signed-Rank Tests
- Wilcoxon Signed-Rank Tests for Non-Inferiority
- Wilcoxon Signed-Rank Tests for Superiority by a Margin
Paired Tests
-
- Paired T-Tests
- Paired T-Tests for Non-Inferiority
- Paired T-Tests for Superiority by a Margin
- -
- Paired Z-Tests
- Paired Z-Tests for Non-Inferiority
- Paired Z-Tests for Superiority by a Margin
- Paired Z-Tests for Equivalence
- -
- Paired Wilcoxon Signed-Rank Tests
- Paired Wilcoxon Signed-Rank Tests for Non-Inferiority
- Paired Wilcoxon Signed-Rank Tests for Superiority by a Margin
Two-Sample T-Tests
- Two-Sample T-Tests for Non-Inferiority Assuming Equal Variance
- Two-Sample T-Tests for Non-Inferiority Allowing Unequal Variance
- -
- Two-Sample T-Tests for Superiority by a Margin Assuming Equal Variance
- Two-Sample T-Tests for Superiority by a Margin Allowing Unequal Variance
- -
- Two-Sample T-Tests for Equivalence Allowing Unequal Variance
Mann-Whitney U or Wilcoxon Rank-Sum Tests
- Mann-Whitney U or Wilcoxon Rank-Sum Tests
- Mann-Whitney U or Wilcoxon Rank-Sum Tests for Non-Inferiority
- Mann-Whitney U or Wilcoxon Rank-Sum Tests for Superiority by a Margin
Updated and/or Improved Procedures in the PASS 2019 Upgrade from PASS 16
Conditional Power
- Conditional Power of Logrank Tests
- Conditional Power of Tests for the Difference Between Two Proportions
- Conditional Power of Tests for One Proportion
- Conditional Power of Tests for Two Means in a 2x2 Cross-Over Design
- Conditional Power of Paired T-Tests
- Conditional Power of Two-Sample T-Tests
- Conditional Power of One-Sample T-Tests
Survival
- Tests for the Difference of Two Hazard Rates Assuming an Exponential Model
- Tests for Two Survival Curves Using Cox's Proportional Hazards Model
- -
- Non-Inferiority Logrank Tests
- Non-Inferiority Tests for Two Survival Curves Using Cox's Proportional Hazards Model
- Non-Inferiority Tests for the Difference of Two Hazard Rates Assuming an Exponential Model
- -
- Superiority by a Margin Tests for Two Survival Curves Using Cox's Proportional Hazards Model
- Superiority by a Margin Tests for the Difference of Two Hazard Rates Assuming an Exponential Model
- -
- Equivalence Tests for Two Survival Curves Using Cox's Proportional Hazards Model
- Equivalence Tests for the Difference of Two Hazard Rates Assuming an Exponential Model
Proportions
- Non-Inferiority Tests for the Difference Between Two Proportions
- Non-Inferiority Tests for the Ratio of Two Proportions
- Non-Inferiority Tests for the Odds Ratio of Two Proportions
- -
- Non-Inferiority Tests for the Difference Between Two Correlated Proportions
- Non-Inferiority Tests for the Ratio of Two Correlated Proportions
- -
- Non-Inferiority Tests for the Difference of Two Proportions in a Cluster-Randomized Design
- Non-Inferiority Tests for the Ratio of Two Proportions in a Cluster-Randomized Design
- -
- Equivalence Tests for the Difference Between Two Proportions
- Equivalence Tests for the Ratio of Two Proportions
- Equivalence Tests for the Odds Ratio of Two Proportions
- -
- Equivalence Tests for the Difference of Two Proportions in a Cluster-Randomized Design
- Equivalence Tests for the Ratio of Two Proportions in a Cluster-Randomized Design
- -
- Equivalence Tests for the Difference Between Two Correlated Proportions
- Equivalence Tests for the Ratio of Two Correlated Proportions
- -
- Non-Zero Null Tests for the Difference Between Two Proportions
- Non-Unity Null Tests for the Ratio of Two Proportions
- Non-Unity Null Tests for the Odds Ratio of Two Proportions
- -
- Non-Zero Null Tests for the Difference of Two Proportions in a Cluster-Randomized Design
- Non-Unity Null Tests for the Ratio of Two Proportions in a Cluster-Randomized Design
- -
- Tests for Two Proportions in a Stratified Design (Cochran-Mantel-Haenszel Test)
- Tests for Two Proportions in a Cluster-Randomized Design
Means
- One-Sample T-Tests for Superiority by a Margin
- One-Sample T-Tests for Non-Inferiority
- One-Sample T-Tests for Equivalence
- -
- Paired T-Tests for Equivalence
- -
- Two-Sample T-Tests Assuming Equal Variance
- Two-Sample T-Tests Allowing Unequal Variance
- Two-Sample T-Tests for Equivalence Assuming Equal Variance
- -
- Tests for the Ratio of Two Means
- Non-Inferiority Tests for the Ratio of Two Means
- Superiority by a Margin Tests for the Ratio of Two Means
- Equivalence Tests for the Ratio of Two Means
- -
- Tests for the Difference Between Two Means in a 2x2 Cross-Over Design
- Tests for the Ratio of Two Means in a 2x2 Cross-Over Design
- Non-Inferiority Tests for the Difference Between Two Means in a 2x2 Cross-Over Design
- Non-Inferiority Tests for the Ratio of Two Means in a 2x2 Cross-Over Design
- Superiority by a Margin Tests for the Difference of Two Means in a 2x2 Cross-Over Design
- Superiority by a Margin Tests for the Ratio of Two Means in a 2x2 Cross-Over Design
- Equivalence Tests for the Difference Between Two Means in a 2x2 Cross-Over Design
- Equivalence Tests for the Ratio of Two Means in a 2x2 Cross-Over Design
- -
- Tests for Two Means in a Cluster-Randomized Design
- Non-Inferiority Tests for Two Means in a Cluster-Randomized Design
- Superiority by a Margin Tests for Two Means in a Cluster-Randomized Design
- Equivalence Tests for Two Means in a Cluster-Randomized Design
- -
- Hotelling's One-Sample T2
- Hotelling's Two-Sample T2
- -
- Multiple Testing for One Mean (One-Sample or Paired Data)
- Multiple Testing for Two Means
Linear Regression Slope
- Confidence Intervals for Linear Regression Slope
Coefficient Alpha
- Tests for One Coefficient Alpha
- Tests for Two Coefficient Alphas
Variances
- Tests for One Variance
Procedures added in the PASS 16 Upgrade from PASS 15
Logistic Regression
- Tests for the Odds Ratio in Logistic Regression with One Normal X (Wald Test)
- Tests for the Odds Ratio in Logistic Regression with One Normal X and Other Xs (Wald Test)
- Tests for the Odds Ratio in Logistic Regression with One Binary X and Other Xs (Wald Test)
Repeated Measures Slopes (GEE)
- GEE Tests for the Slope of Two Groups in a Repeated Measures Design (Continuous Outcome)
- GEE Tests for the Slope of Two Groups in a Repeated Measures Design (Binary Outcome)
- GEE Tests for the Slope of Two Groups in a Repeated Measures Design (Count Outcome)
- -
- GEE Tests for the Slope of Multiple Groups in a Repeated Measures Design (Continuous Outcome)
- GEE Tests for the Slope of Multiple Groups in a Repeated Measures Design (Count Outcome)
Repeated Measures Time-Averaged Differences (GEE)
- GEE Tests for the TAD of Two Groups in a Repeated Measures Design (Continuous Outcome)
- GEE Tests for the TAD of Two Groups in a Repeated Measures Design (Binary Outcome)
- GEE Tests for the TAD of Two Groups in a Repeated Measures Design (Count Outcome)
- -
- GEE Tests for the TAD of Multiple Groups in a Repeated Measures Design (Continuous Outcome)
- GEE Tests for the TAD of Multiple Groups in a Repeated Measures Design (Binary Outcome)
- GEE Tests for the TAD of Multiple Groups in a Repeated Measures Design (Count Outcome)
Hierarchical Design Comparisons using Mixed Models
- Mixed Models Tests for Two Means in a 2-Level Hierarchical Design (Level-2 Randomization)
- Mixed Models Tests for Two Means in a 2-Level Hierarchical Design (Level-1 Randomization)
- -
- Mixed Models Tests for Two Proportions in a 2-Level Hierarchical Design (Level-2 Randomization)
- Mixed Models Tests for Two Proportions in a 2-Level Hierarchical Design (Level-1 Randomization)
- -
- Mixed Models Tests for the Slope Difference in a 2-Level Hierarchical Design with Fixed Slopes
- Mixed Models Tests for the Slope Difference in a 2-Level Hierarchical Design with Random Slopes
- -
- Mixed Models Tests for Two Means in a 3-Level Hierarchical Design (Level-3 Randomization)
- Mixed Models Tests for Two Means in a 3-Level Hierarchical Design (Level-2 Randomization)
- Mixed Models Tests for Two Means in a 3-Level Hierarchical Design (Level-1 Randomization)
- -
- Mixed Models Tests for Two Proportions in a 3-Level Hierarchical Design (Level-3 Randomization)
- Mixed Models Tests for Two Proportions in a 3-Level Hierarchical Design (Level-2 Randomization)
- Mixed Models Tests for Two Proportions in a 3-Level Hierarchical Design (Level-1 Randomization)
- -
- Mixed Models Tests for the Slope Diff. in a 3-Level Hier. Design with Fixed Slopes (Level-2 Rand.)
- Mixed Models Tests for the Slope Diff. in a 3-Level Hier. Design with Random Slopes (Level-2 Rand.)
- Mixed Models Tests for the Slope Diff. in a 3-Level Hier. Design with Fixed Slopes (Level-3 Rand.)
- Mixed Models Tests for the Slope Diff. in a 3-Level Hier. Design with Random Slopes (Level-3 Rand.)
2x2 Cross-Over Design – Odds Ratio
- Tests for the Odds Ratio of Two Proportions in a 2x2 Cross-Over Design
- Non-Inferiority Tests for the Odds Ratio of Two Proportions in a 2x2 Cross-Over Design
- Superiority by a Margin Tests for the Odds Ratio of Two Proportions in a 2x2 Cross-Over Design
- Equivalence Tests for the Odds Ratio of Two Proportions in a 2x2 Cross-Over Design
2x2 Cross-Over Design – Proportion Difference
- Tests for the Difference of Two Proportions in a 2x2 Cross-Over Design
- Non-Inferiority Tests for the Difference of Two Proportions in a 2x2 Cross-Over Design
- Superiority by a Margin Tests for the Difference of Two Proportions in a 2x2 Cross-Over Design
- Equivalence Tests for the Difference of Two Proportions in a 2x2 Cross-Over Design
2x2 Cross-Over Design – Ratio of Poisson Rates
- Tests for the Ratio of Two Poisson Rates in a 2x2 Cross-Over Design
- Non-Inferiority Tests for the Ratio of Two Poisson Rates in a 2x2 Cross-Over Design
- Superiority by a Margin Tests for the Ratio of Two Poisson Rates in a 2x2 Cross-Over Design
- Equivalence Tests for the Ratio of Two Poisson Rates in a 2x2 Cross-Over Design
2x2 Cross-Over Design – Generalized Odds Ratio for Ordinal Data
- Tests for the Generalized Odds Ratio for Ordinal Data in a 2x2 Cross-Over Design
- Non-Inferiority Tests for the Generalized Odds Ratio for Ordinal Data in a 2x2 Cross-Over Design
- Superiority by a Margin Tests for the Gen. Odds Ratio for Ordinal Data in a 2x2 Cross-Over Design
- Equivalence Tests for the Generalized Odds Ratio for Ordinal Data in a 2x2 Cross-Over Design
Williams Cross-Over Design – Pairwise Proportion Differences
- Tests for Pairwise Proportion Differences in a Williams Cross-Over Design
- Non-Inferiority Tests for Pairwise Proportion Differences in a Williams Cross-Over Design
- Superiority by a Margin Tests for Pairwise Proportion Differences in a Williams Cross-Over Design
- Equivalence Tests for Pairwise Proportion Differences in a Williams Cross-Over Design
Williams Cross-Over Design – Pairwise Mean Differences
- Tests for Pairwise Mean Differences in a Williams Cross-Over Design
- Non-Inferiority Tests for Pairwise Mean Differences in a Williams Cross-Over Design
- Superiority by a Margin Tests for Pairwise Mean Differences in a Williams Cross-Over Design
- Equivalence Tests for Pairwise Mean Differences in a Williams Cross-Over Design
Multiple Correlated Proportions (McNemar-Bowker Test of Symmetry)
- Tests for Multiple Correlated Proportions (McNemar-Bowker Test of Symmetry)
Tools and Features added in PASS 16
- Installation Validation Tool for Installation Qualification (IQ)
- Procedure Validation Tool for Operational Qualification (OQ)
- Report Header Formatting and Colors
Installation Validation Tool for Installation Qualification (IQ)
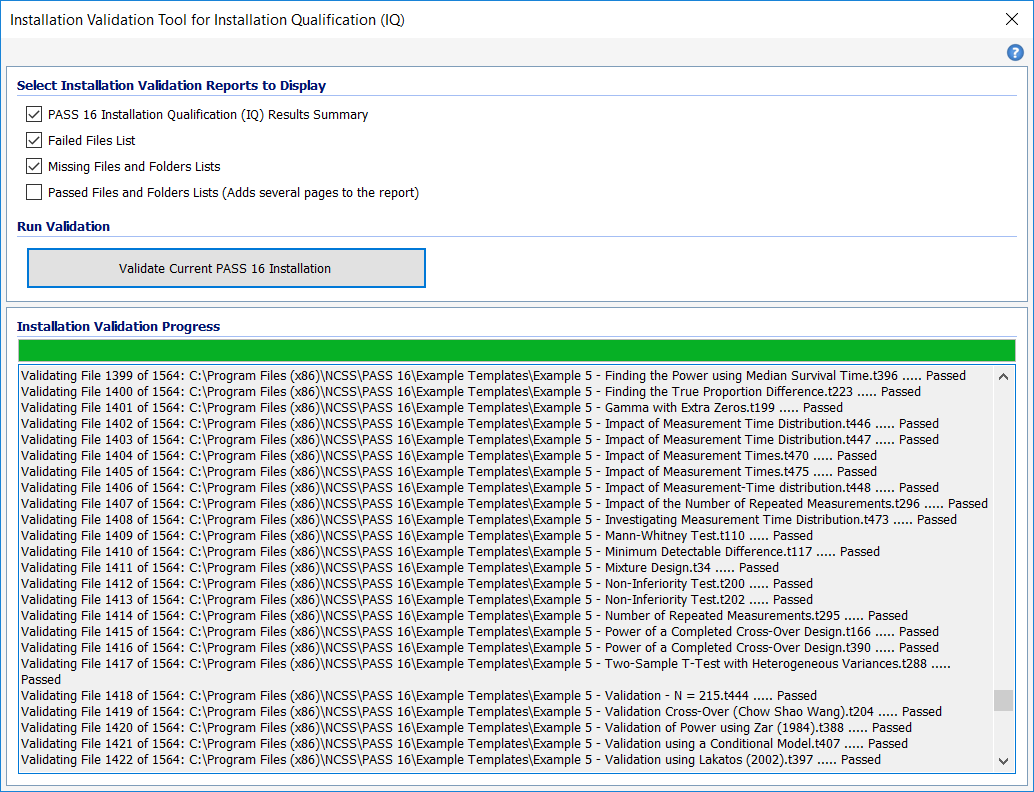
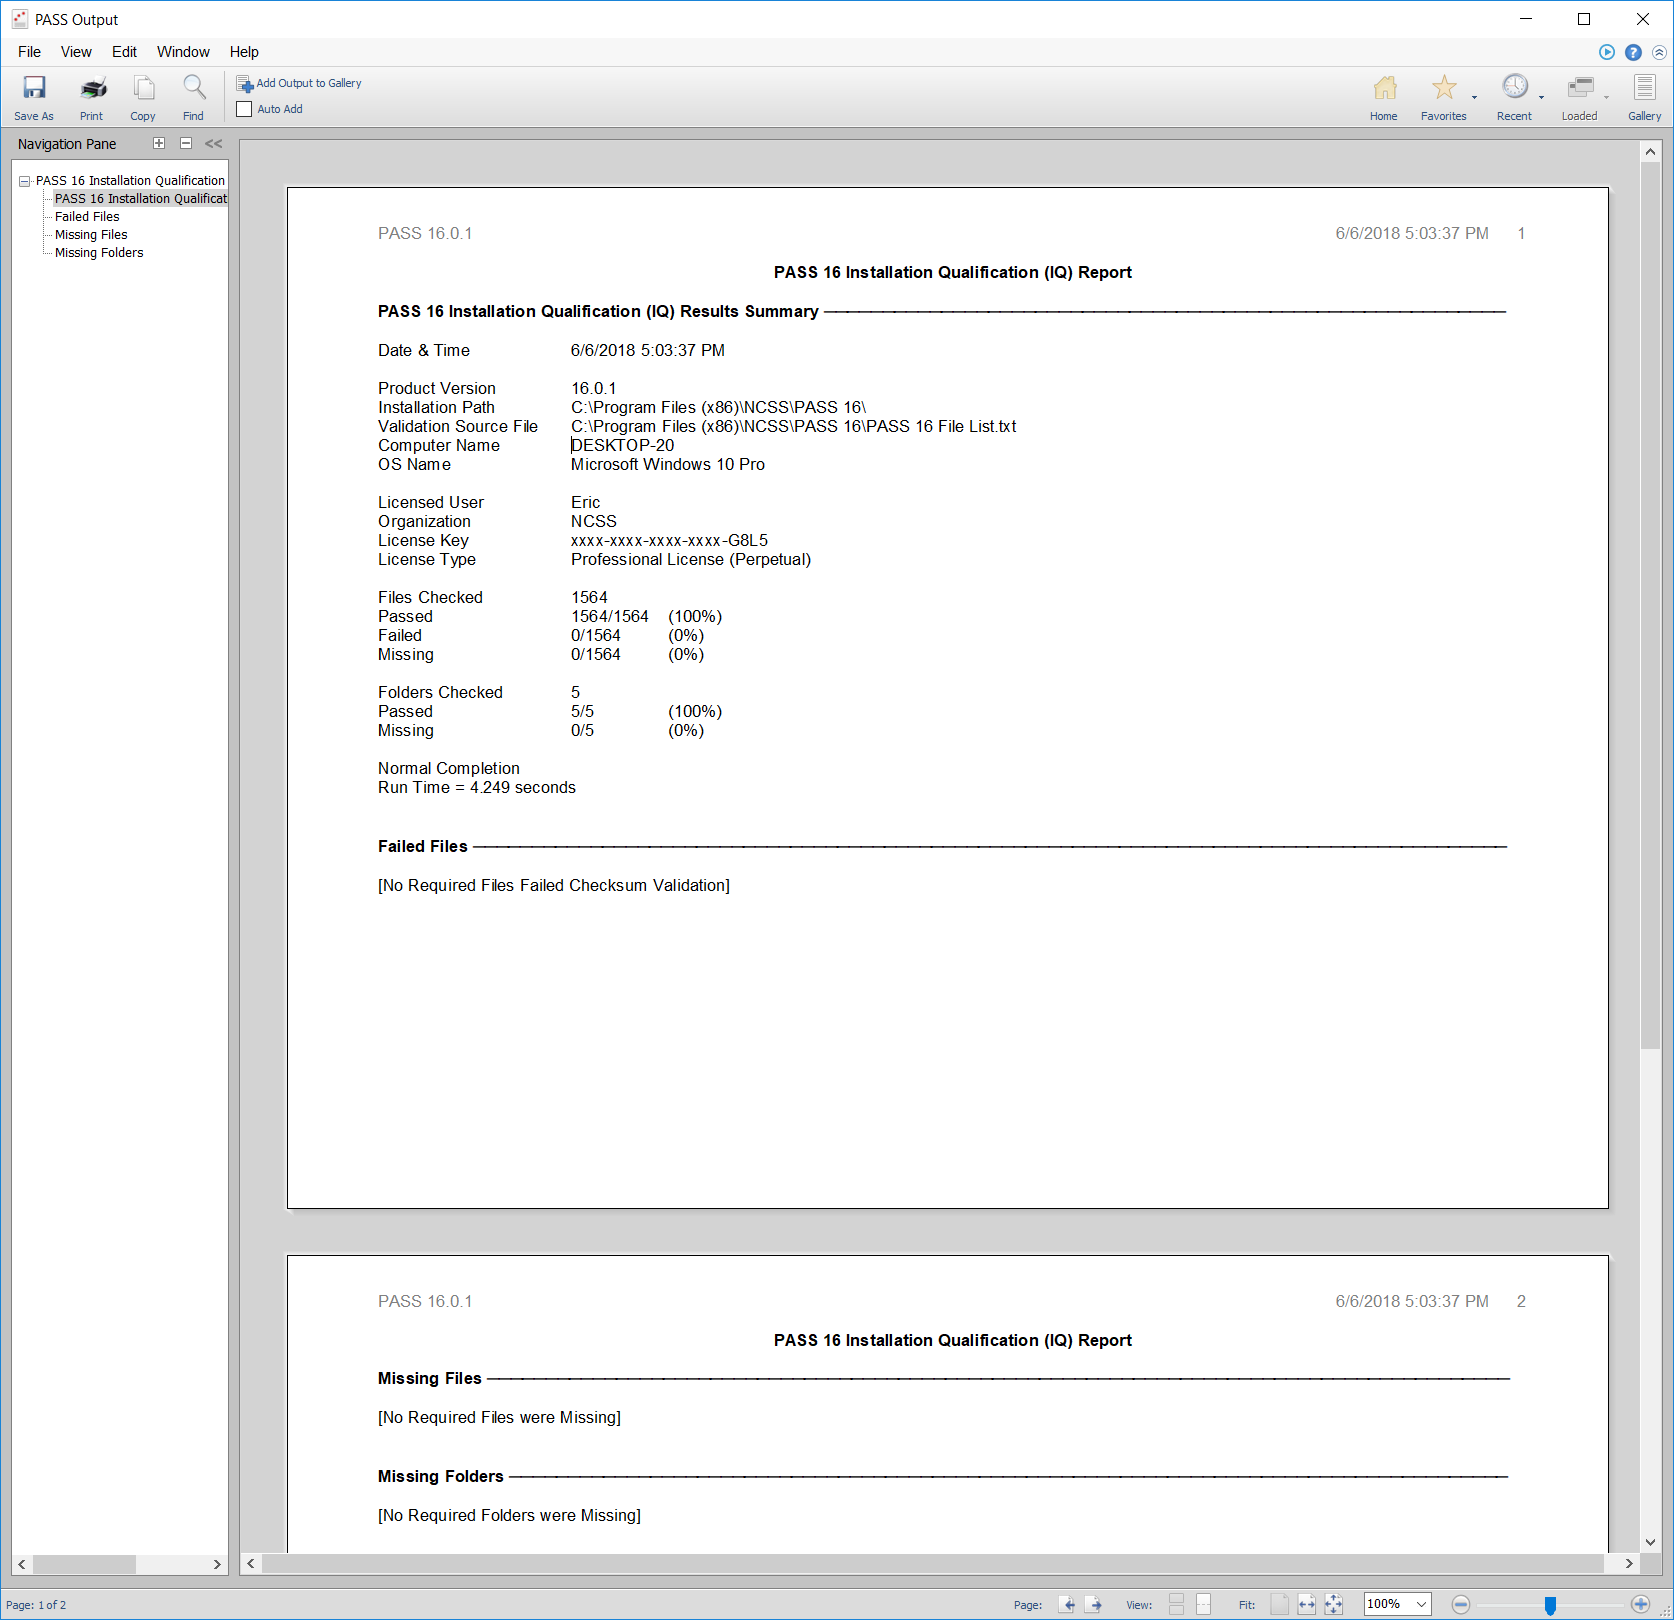
The Installation Validation Tool for Installation Qualification (IQ) may be used to validate that the software is installed completely and correctly. The tool can also be used to verify that no files have been changed since the software was installed.
The Installation Validation Tool compares all PASS installation files against factory requirements and reports if any required files or folders are missing or invalid. Summary and detailed validation reports are created and displayed in the Output Window. If all files and folders pass installation qualification, then you can be certain that the software is installed correctly.
Procedure Validation Tool for Operational Qualification (OQ)
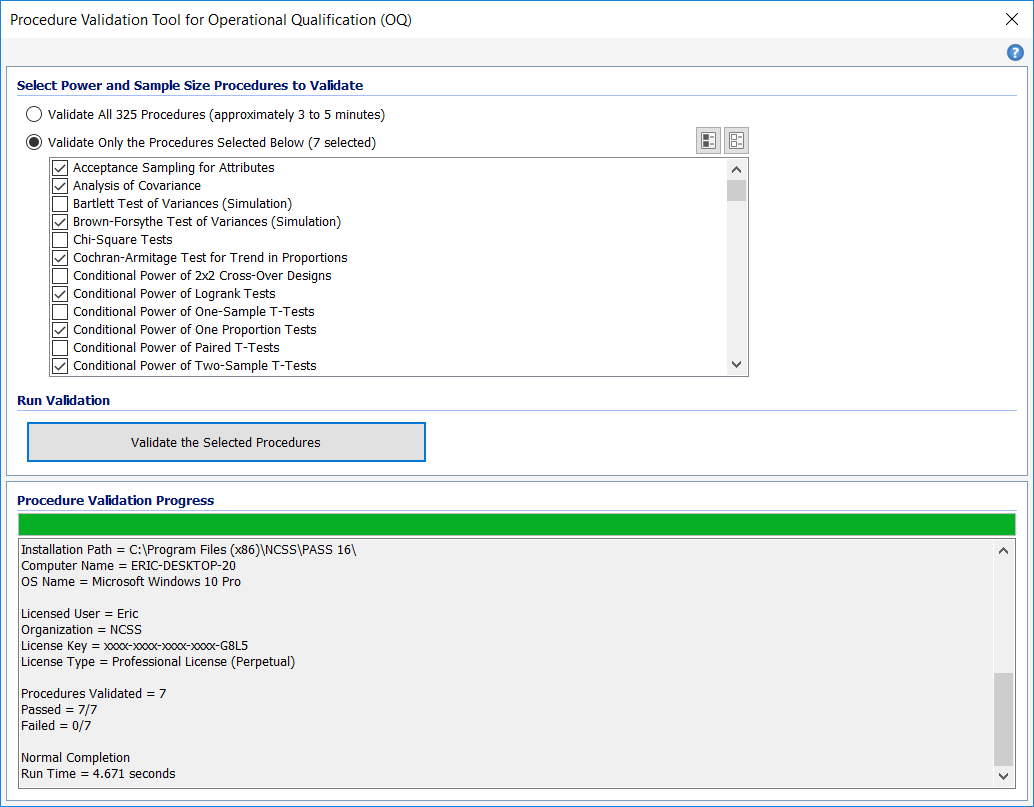
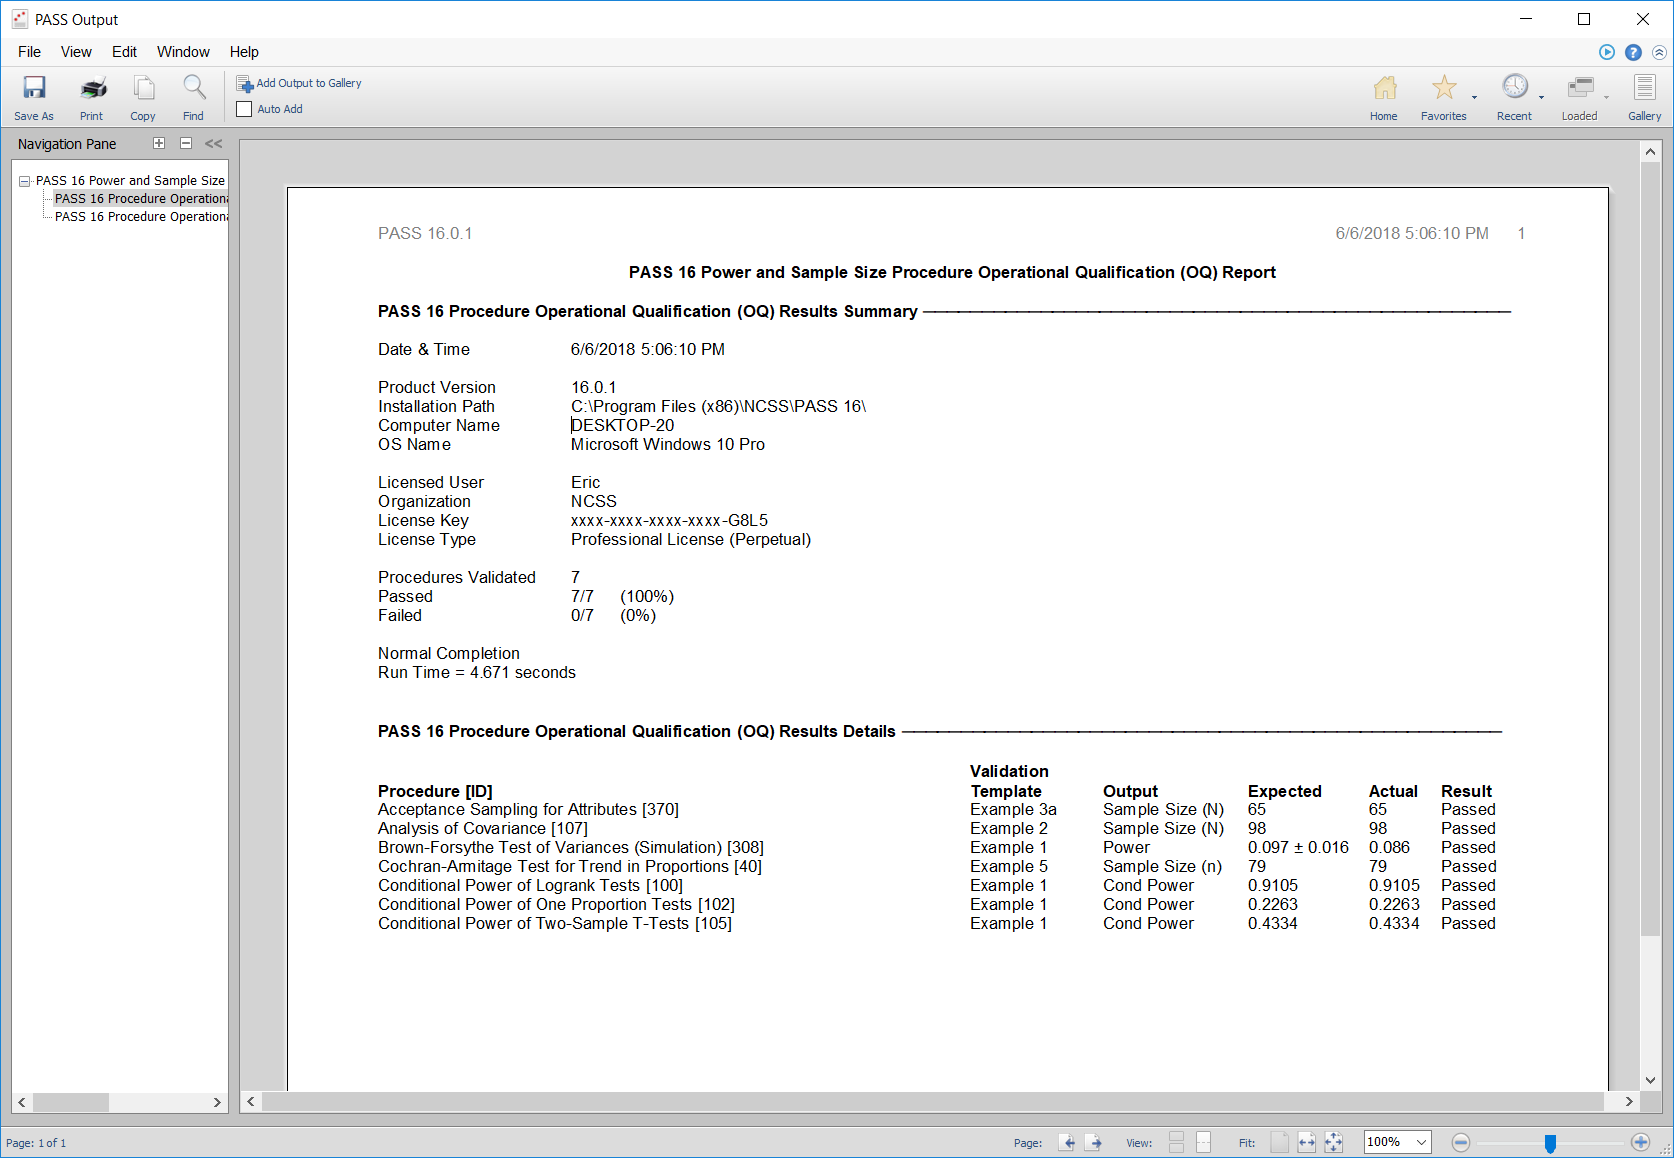
The Procedure Validation Tool for Operational Qualification (OQ) may be used to validate that the software is operating correctly. The tool verifies that one or more (up to all) procedures is/are functioning correctly by loading the procedure(s), executing calculations, and comparing the results to verified and expected outcomes. Summary and detailed validation reports are created and displayed in the Output Window. If all procedures pass operational qualification, then you can be certain that the software is functioning as expected.
Each procedure can also be validated individually by clicking Validate This Procedure in the Help Center or Help menu on any Procedure Window.
Report Header Formatting and Colors
New system options give the user the ability to add (or remove) lines to the titles to improve separation of report sections. Title line color and text color for page headers, titles, and reports may also be specified individually.
Procedures added in the PASS 15 Upgrade from PASS 14
Logistic and Conditional Logistic Regression
- Logistic Regression with One Binary Covariate using the Wald Test
- Logistic Regression with Two Binary Covariates using the Wald Test
- Logistic Regression with Two Binary Covariates and an Interaction using the Wald Test
- Confidence Intervals for the Odds Ratio in a Logistic Regression with Two Binary Covariates
- Confidence Intervals for the Interaction Odds Ratio in a Logistic Regression with Two Binary Covariates
- Tests for the Odds Ratio in a Matched Case-Control Design with a Binary Covariate using Conditional Logistic Regression
- Tests for the Odds Ratio in a Matched Case-Control Design with a Quantitative X using Conditional Logistic Regression
Stepped-Wedge Cluster-Randomized Designs
- Tests for Two Proportions in a Stepped-Wedge Cluster-Randomized Design
- Tests for Two Means in a Stepped-Wedge Cluster-Randomized Design
- Tests for Two Poisson Rates in a Stepped-Wedge Cluster-Randomized Design
Tolerance Intervals
- Tolerance Intervals for Normal Data
- Tolerance Intervals for Any Data (Nonparametric)
- Tolerance Intervals for Exponential Data
- Tolerance Intervals for Gamma Data
Proportions
- Group-Sequential Tests for One Proportion in a Fleming Design
- Multiple Comparisons of Proportions vs. Control
- Tests for One Proportion to Demonstrate Conformance with a Reliability Standard
- Tests for One Proportion to Demonstrate Conformance with a Reliability Standard with Fixed Adverse Events
Poisson and Negative Binomial Rates
- Non-Inferiority Tests for the Ratio of Two Poisson Rates
- Non-Inferiority Tests for the Ratio of Two Negative Binomial Rates
- Superiority by a Margin Tests for the Ratio of Two Poisson Rates
- Superiority by a Margin Tests for the Ratio of Two Negative Binomial Rates
- Equivalence Tests for the Ratio of Two Poisson Rates
- Equivalence Tests for the Ratio of Two Negative Binomial Rates
Effect Size
- Two-Sample T-Tests using Effect Size
- Tests for One Mean using Effect Size
- Tests for Paired Means using Effect Size
- Tests for Two Proportions using Effect Size
- Tests for One Proportion using Effect Size
- One-Way Analysis of Variance F-Tests using Effect Size
- Factorial Analysis of Variance using Effect Size
- Multiple Regression using Effect Size
Survival
- Two-Group Survival Comparison Tests (Simulation)
Sensitivity and Specificity
- Confidence Intervals for One-Sample Sensitivity
- Confidence Intervals for One-Sample Specificity
- Confidence Intervals for One-Sample Sensitivity and Specificity
Matched-Pair Difference in a Cluster-Randomized Design
- Tests for the Matched-Pair Difference of Two Event Rates in a Cluster-Randomized Design
- Tests for the Matched-Pair Difference of Two Proportions in a Cluster-Randomized Design
- Tests for the Matched-Pair Difference of Two Means in a Cluster-Randomized Design
Percentiles
- Confidence Intervals for a Percentile of a Normal Distribution
Features added in PASS 15
- Sample Sizes Adjusted for Drop-Out
- Report of Procedure Input Settings
- Autosave Procedure Settings
Sample Sizes Adjusted for Drop-Out
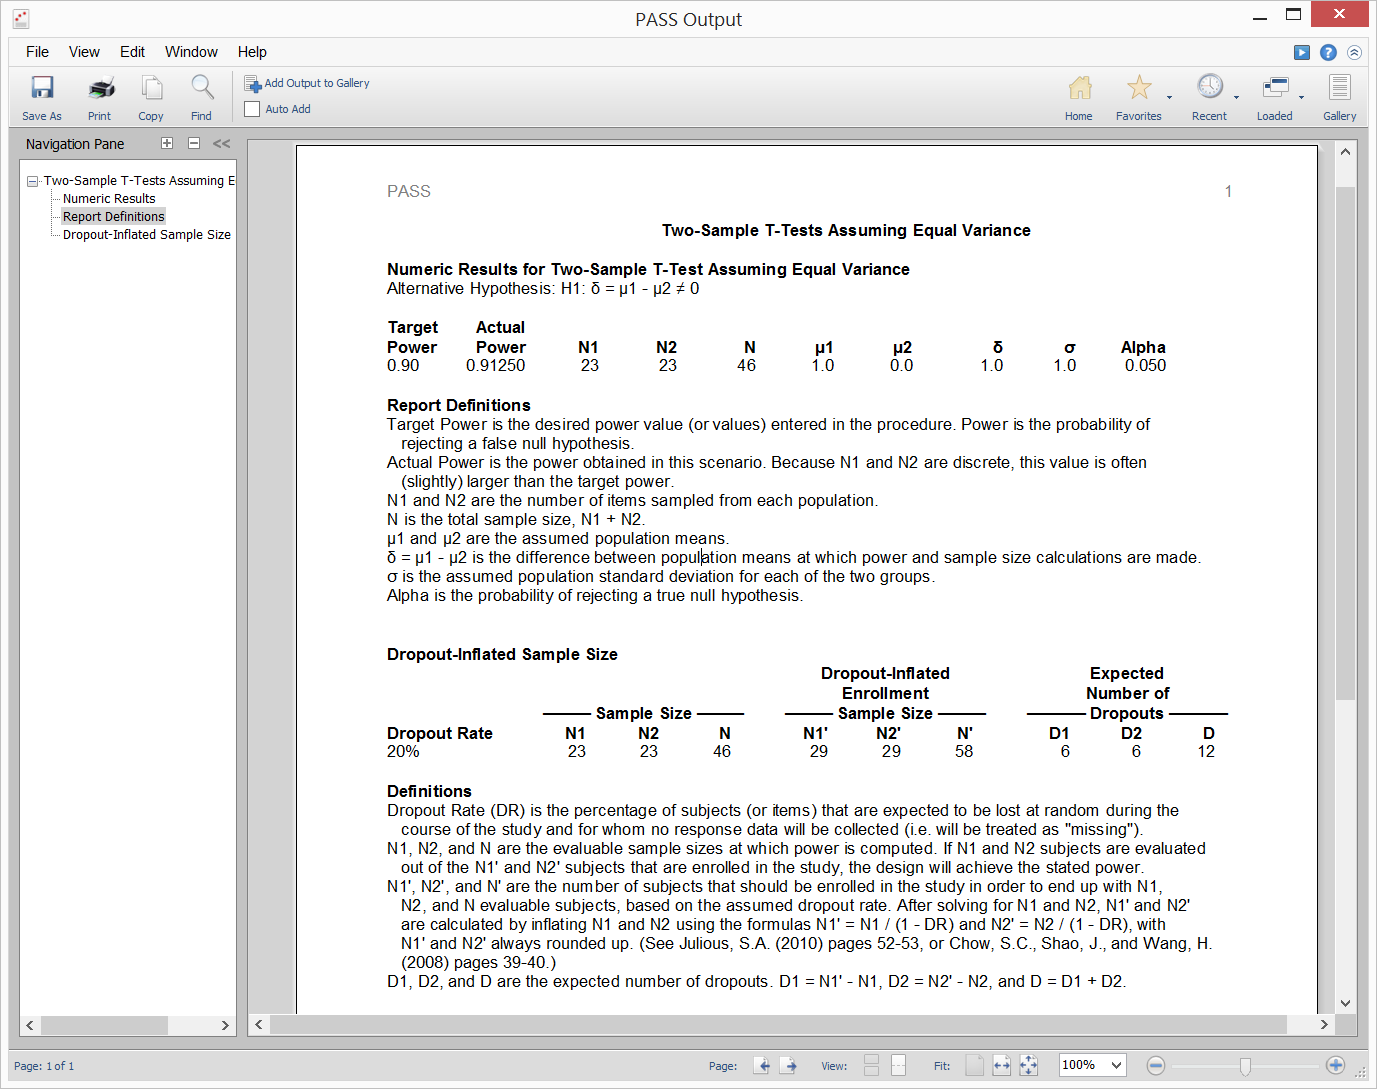
The option for a Dropout-Inflated Sample Size report has been added to most procedures. The user specifies a drop-out (lost, not enrolled, etc.) percentage rate, and the report gives the total number of individuals needed such that power requirements will be met after drop-outs. That is, the report gives the drop-out inflated enrollment sample size.
Report of Procedure Input Settings
An option was added to every procedure to allow the user to show all the procedure input settings as a report of the output.
Autosave Procedure Settings
In PASS 15, the procedure settings are saved for every run of a procedure. This allows the user to go back and load the procedure settings of any PASS 15 run. Each settings file is given a unique date-time stamp to distinguish each run. The autosaved settings file name is also given in the Procedure Input Settings report.
Updated and/or Improved Procedures in PASS 15
Combined Procedures
In previous versions of PASS, some procedures differed only by the input parameter used. In PASS 15, several of these groups of procedures were combined into single procedures.
- Logrank Tests
- Group-Sequential Logrank Tests (Simulation)
- Two-Sample Z-Tests Assuming Equal Variance
- Two-Sample Z-Tests Allowing Unequal Variance
- Two-Sample T-Tests Assuming Equal Variance
- Two-Sample T-Tests Allowing Unequal Variance
Repeated Measures
- Repeated Measures Analysis
Regression
- Multiple Regression
Procedures added in the PASS 14 Upgrade from PASS 13
PASS 14 added over 25 new PASS sample size software procedures, including 13 means procedures, 3 rates and counts procedures, 3 survival analysis procedures, 5 regression procedures, and 2 acceptance sampling procedures.
Means
- Equivalence Tests for the Difference Between Two Paired Means
- Non-Inferiority Tests for Two Means in a Cluster-Randomized Design
- Equivalence Tests for Two Means in a Cluster-Randomized Design
- Superiority by a Margin Tests for Two Means in a Cluster-Randomized Design
- Tests for the Difference of Two Means in a Higher-Order Cross-Over Design
- Tests for the Ratio of Two Means in a Higher-Order Cross-Over Design
- Tests for Fold Change of Two Means
- MxM Cross-Over Designs
- M-Period Cross-Over Designs using Contrasts
- One-Way Repeated Measures
- One-Way Repeated Measures Contrasts
- One-Way Analysis of Variance Contrasts
- Confidence Intervals for One-Way Repeated Measures Contrasts
Rates and Counts
- Tests for the Difference Between Two Poisson Rates
- Tests for the Difference Between Two Poisson Rates in a Cluster-Randomized Design
- Tests for the Ratio of Two Negative Binomial Rates
Survival
- Logrank Tests in a Cluster-Randomized Design
- One-Sample Logrank Tests
- One-Sample Cure Model Tests
Regression
- Reference Intervals for Clinical and Lab Medicine
- Tests for the Difference Between Two Linear Regression Slopes
- Tests for the Difference Between Two Linear Regression Intercepts
- Mendelian Randomization with a Binary Outcome
- Mendelian Randomization with a Continuous Outcome
Acceptance Sampling
- Acceptance Sampling for Attributes
- Operating Characteristic Curves for Acceptance Sampling for Attributes
Procedures Updated in the PASS 14 Upgrade from PASS 13
Over 45 procedures were updated and/or improved as well.
Means
- Tests for Two Means using Ratios
- Tests for Two Means in a Cluster-Randomized Design
- Non-Inferiority Tests for the Difference of Two Means in a Higher-Order Cross-Over Design
- Non-Inferiority Tests for the Ratio of Two Means in a Higher-Order Cross-Over Design
- Equivalence Tests for the Difference of Two Means in a Higher-Order Cross-Over Design
- Equivalence Tests for the Ratio of Two Means in a Higher-Order Cross-Over Design
- Superiority by a Margin Tests for the Difference of Two Means in a Higher-Order Cross-Over Design
- Superiority by a Margin Tests for the Ratio of Two Means in a Higher-Order Cross-Over Design
- One-Way Analysis of Variance F-Tests
Rates and Counts
- Tests for One Poisson Rate
- Tests for the Ratio of Two Poisson Rates
Proportions
- Tests for One Proportion
- Non-Inferiority Tests for One Proportion
- Equivalence Tests for One Proportion
- Superiority by a Margin Tests for One Proportion
- Tests for Two Proportions
- Tests for Two Proportions in a Repeated Measures Design
- Non-Inferiority Tests for the Difference Between Two Proportions
- Non-Inferiority Tests for the Ratio of Two Proportions
- Non-Inferiority Tests for the Odds Ratio of Two Proportions
- Equivalence Tests for the Difference Between Two Proportions
- Equivalence Tests for the Ratio of Two Proportions
- Equivalence Tests for the Odds Ratio of Two Proportions
- Superiority by a Margin Tests for the Difference Between Two Proportions
- Superiority by a Margin Tests for the Ratio of Two Proportions
- Superiority by a Margin Tests for the Odds Ratio of Two Proportions
- Confidence Intervals for the Difference Between Two Proportions
- Confidence Intervals for the Ratio of Two Proportions
- Confidence Intervals for the Odds Ratio of Two Proportions
- Tests for Two Correlated Proportions (McNemar Test)
- Non-Inferiority Tests for the Difference Between Two Correlated Proportions
- Non-Inferiority Tests for the Ratio of Two Correlated Proportions
- Equivalence Tests for the Difference Between Two Correlated Proportions
- Equivalence Tests for the Ratio of Two Correlated Proportions
- Tests for Two Proportions in a Cluster-Randomized Design
- Non-Inferiority Tests for the Difference of Two Proportions in a Cluster-Randomized Design
- Non-Inferiority Tests for the Ratio of Two Proportions in a Cluster-Randomized Design
- Equivalence Tests for the Difference of Two Proportions in a Cluster-Randomized Design
- Equivalence Tests for the Ratio of Two Proportions in a Cluster-Randomized Design
- Superiority by a Margin Tests for the Difference of Two Proportions in a Cluster-Randomized Design
- Superiority by a Margin Tests for the Ratio of Two Proportions in a Cluster-Randomized Design
- Group-Sequential Tests for Two Proportions (Simulation)
- Group-Sequential Non-Inferiority Tests for the Difference of Two Proportions (Simulation)
- Group-Sequential Non-Inferiority Tests for the Ratio of Two Proportions (Simulation)
- Group-Sequential Non-Inferiority Tests for the Odds Ratio of Two Proportions (Simulation)
- Group-Sequential Superiority by a Margin Tests for the Difference of Two Proportions (Simulation)
- Group-Sequential Superiority by a Margin Tests for the Ratio of Two Proportions (Simulation)
- Group-Sequential Superiority by a Margin Tests for the Odds Ratio of Two Proportions (Simulation)
Features added in the PASS 13 Upgrade from PASS 12
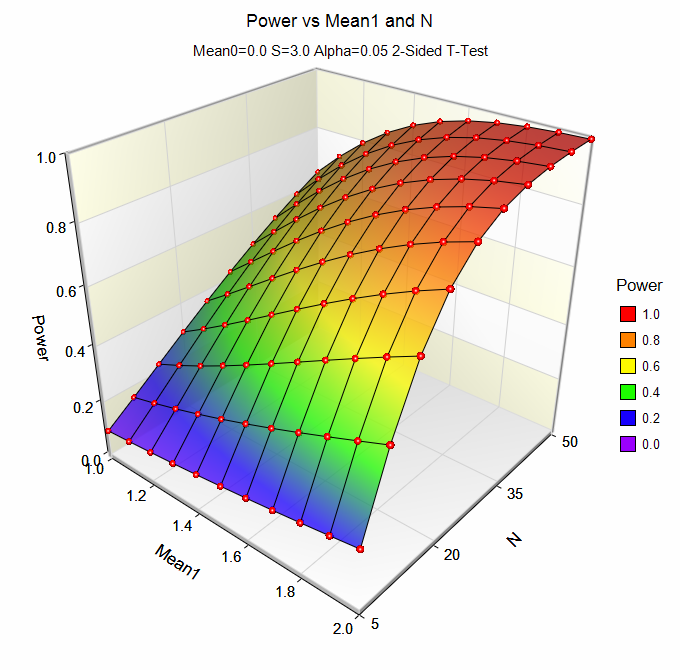
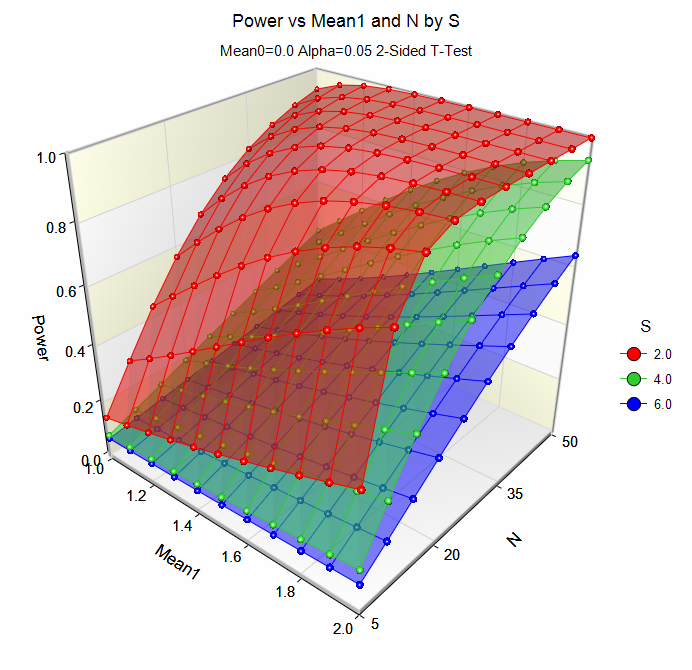
- 3D Power and Sample Size Plots
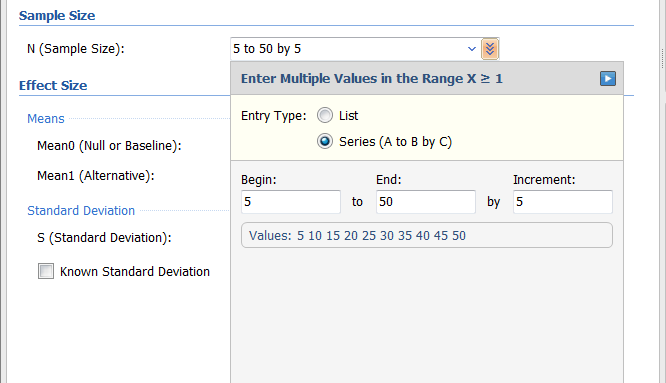
- Multiple Value Selection Improvements
- Help Center and Video Help Expansion
- Two-Sample Sample Size Group Allocation Enhancements
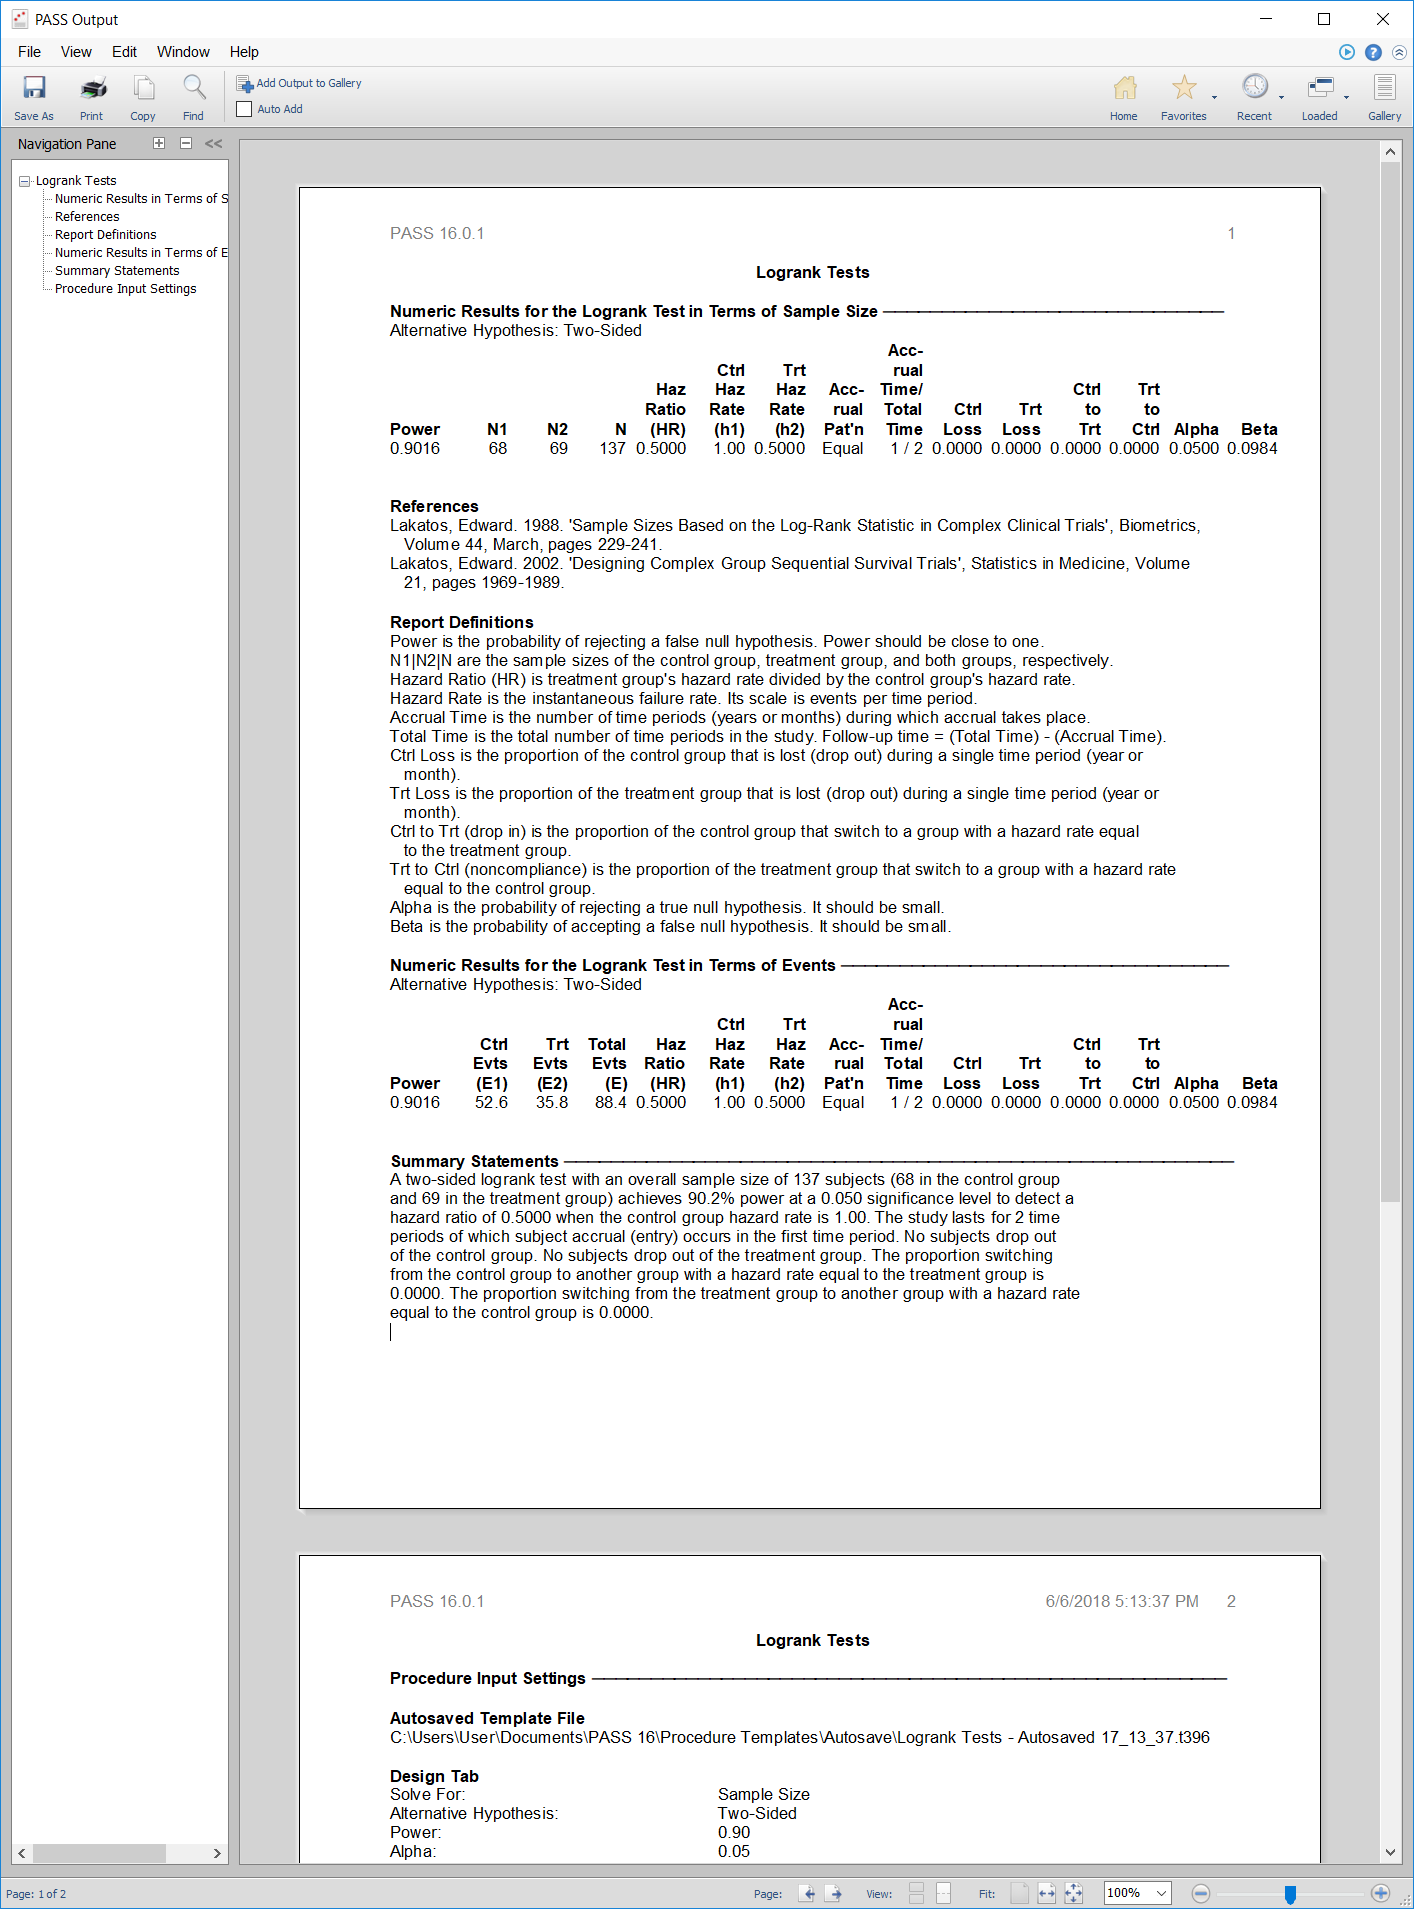
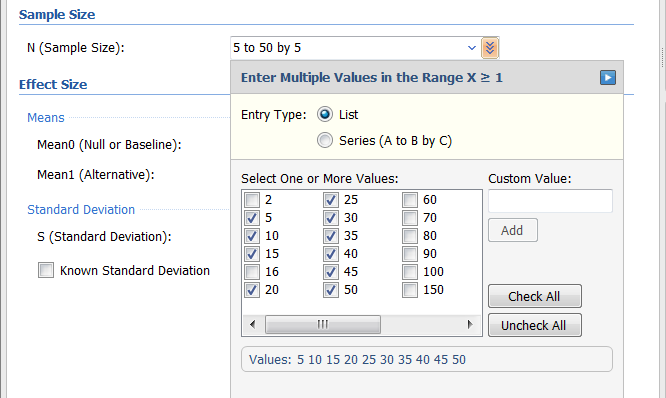
3D Power and Sample Size Plots
Multiple Value Selection Improvements
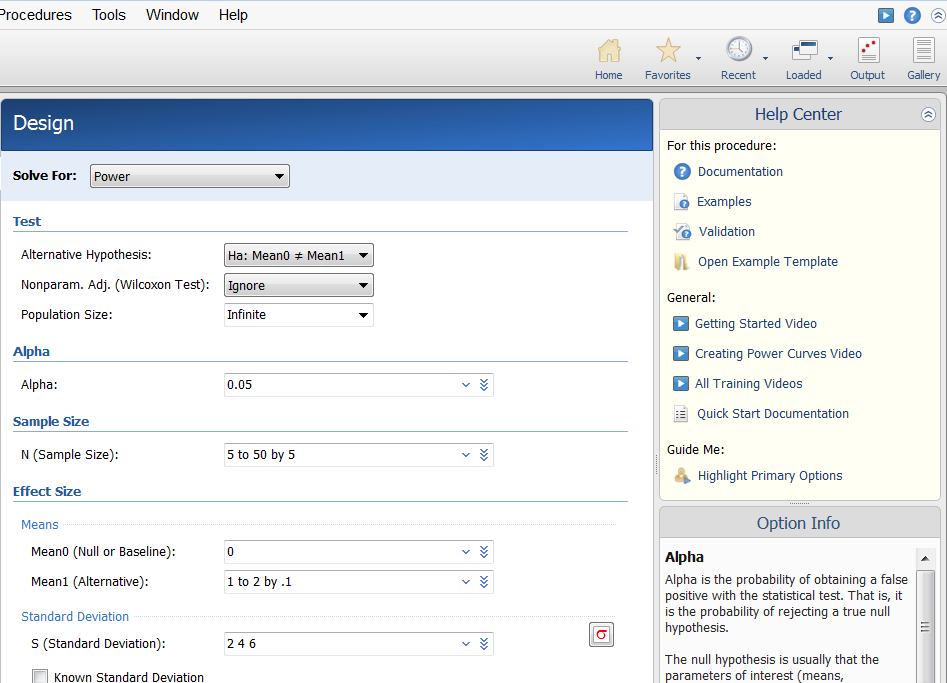
Help Center and Video Help Expansion
Procedures added in the PASS 13 Upgrade from PASS 12
PASS 13 added over 25 new power and sample size procedures, including one-way tests (3), variance tests (5), correlation tests (5), correlation confidence intervals (4), exponential distribution parameter confidence intervals (4), quality control (2), Coefficient (Cronbach's) Alpha confidence interval (1), Kappa confidence interval (1), area under an ROC curve confidence interval (1), Michaelis-Menten parameters confidence intervals (1), and tests for two means in a multicenter randomized design (1).
One-way Tests of Mean or Center
- Kruskal-Wallis Tests (Simulation)
- Terry-Hoeffding Normal-Scores Tests of Means (Simulation)
- Van der Waerden Normal Quantiles Tests of Means (Simulation)
Variance Tests
- Bartlett Test of Variances (Simulation)
- Levene Test of Variances (Simulation)
- Brown-Forsythe Test of Variances (Simulation)
- Conover Test of Variances (Simulation)
- Power Comparison of Tests of Variances (Simulation)
Correlation Tests
- Pearson's Correlation Tests (Simulation)
- Spearman's Rank Correlation Tests (Simulation)
- Kendall's Tau-b Correlation Tests (Simulation)
- Point Biserial Correlation Tests
- Power Comparison of Correlation Tests (Simulation)
Correlation Confidence Intervals
- Confidence Intervals for Spearman's Rank Correlation
- Confidence Intervals for Kendall's Tau-b Correlation
- Confidence Intervals for Point Biserial Correlation
- Confidence Intervals for Intraclass Correlation
Exponential Distribution Parameter Confidence Intervals
- Confidence Intervals for the Exponential Lifetime Mean
- Confidence Intervals for an Exponential Lifetime Percentile
- Confidence Intervals for Exponential Reliability
- Confidence Intervals for the Exponential Hazard Rate
Quality Control
- Confidence Intervals for Cp
- Confidence Intervals for Cpk
Other
- Tests for Two Means in a Multicenter Randomized Design
- Confidence Intervals for Michaelis-Menten Parameters
- Confidence Intervals for the Area Under an ROC Curve
- Confidence Intervals for Kappa
- Confidence Intervals for Coefficient Alpha
Procedures added in the PASS 12 Upgrade from PASS 11
PASS 12 added over 15 new power and sample size procedures, including z tests (3), conditional power (6), repeated measures (2), non-inferiority logrank (2), equivalence logrank (2), Lin's concordance coefficient (1), probit analysis (1), and competing risks (1).
Conditional Power
- Conditional Power of One-Sample T-Tests
- Conditional Power of Two-Sample T-Tests
- Conditional Power of Paired T-Tests
- Conditional Power of 2x2 Cross-Over Designs
- Conditional Power of Logrank Tests
- Conditional Power of One-Proportions Tests
- Conditional Power of Two-Proportions Tests
Z-Test
- Two-Sample Z-Test Assuming Equal Variances
- Two-Sample Z-Test Allowing Unequal Variances
Survival Analysis
- Test for Two Survival Curves using Cox Regression
- Non-Inferiority Test for Two Survival Curves using Cox Regression
- Equivalence Test for Two Survival Curves using Cox Regression
- Superiority Test for Two Survival Curves using Cox Regression
- Test for Difference of Two Hazard Rates Assuming an Exponential Model
- Non-Inferiority Test for Difference of Two Hazard Rates Assuming an Exponential Model
- Equivalence Test for Difference of Two Hazard Rates Assuming an Exponential Model
- Superiority Test for Comparing Hazard Rates assuming Exponential Data
- Logrank Test Accounting for Competing Risks
Other
- Lin's Concordance Correlation Coefficient
- Probit Analysis
- Test for Comparing Mean Change Score in Pre-Post Design
- Confidence Interval for a Proportion from a Finite Population
Revised and Simplified
- Repeated Measures Analysis
- MANOVA
- Two-Sample T-Test Assuming Equal Variances
- Two-Sample T-Test with Unequal Variances
- Mann-Whitney-Wilcoxon Test
Procedures added in the PASS 11 Upgrade from PASS 2008
PASS 11 added 17 new power and sample size procedures and features to PASS, including procedures for analysis of covariance, group-sequential testing, sensitivity and specificity, Poisson means testing, tests for two ordered categorical variables, Williams test for the minimum effective dose, Control Charts, an enhanced user interface, increased computation speed, and an improved graphics system.
New Procedures in the PASS 11 Upgrade from PASS 2008
- Analysis of Covariance (ANCOVA)
- Group-Sequential Tests for Two Means using Simulation
- Group-Sequential Non-Inferiority Tests for Two Means using Simulation
- Group-Sequential Tests for Two Proportions using Simulation
- Group-Sequential Non-Inferiority Tests for Two Proportions using Simulation
- Group-Sequential Logrank Tests using Simulation
- Sensitivity and Specificity Tests for One Group
- Tests for Independent Sensitivities of Two Groups
- Tests for Paired Sensitivities
- Tests for One Poisson Mean
- Tests for Two Poisson Means
- Tests for Two Ordered Categorical Variables
- Williams Test for the Minimum Effective Dose
- Control Charts for Process Means
- Control Charts for Process Variation
As Statistician teaching statistics in the University, I have to say that NCSS is the tool that I have used since 1997. With all the procedures that you need for research or to make a good, informative presentation, it can be used for teaching in a university. Here in Idesem-Chile we have found it to be the best tool to support our measurement activities. I recommend this tool to make your job more enjoyable!
I have been using NCSS in my high school class room for 22 years. I find it very easy to use and my students use it to calculate their results for their lab reports, science fair projects, and now they are using it for AP Research projects. It can be used for everything from the basics to the most advanced statistics. NCSS is very affordable for any high school budget.
