All You Need for Statistical Quality Control at a Much Better Price

In addition to containing a robust suite of control charts and other statistical quality control tools and procedures, the NCSS solution is a comprehensive statistical software package containing hundreds of analysis and graphics tools.
Each of our statistical quality control tools is easy-to-use, well-documented, and carefully validated against published results.
Whether you work in manufacturing, distribution, financial services, health care, transportation, a government agency, or another field, NCSS gives you the statistical quality control tools you need to improve quality control. With over 30 years on the market, NCSS is used by a wide range of small companies and agencies as well as large-scale corporations.
- Acceptance Sampling
- Analysis of Runs
- Analysis of Variance
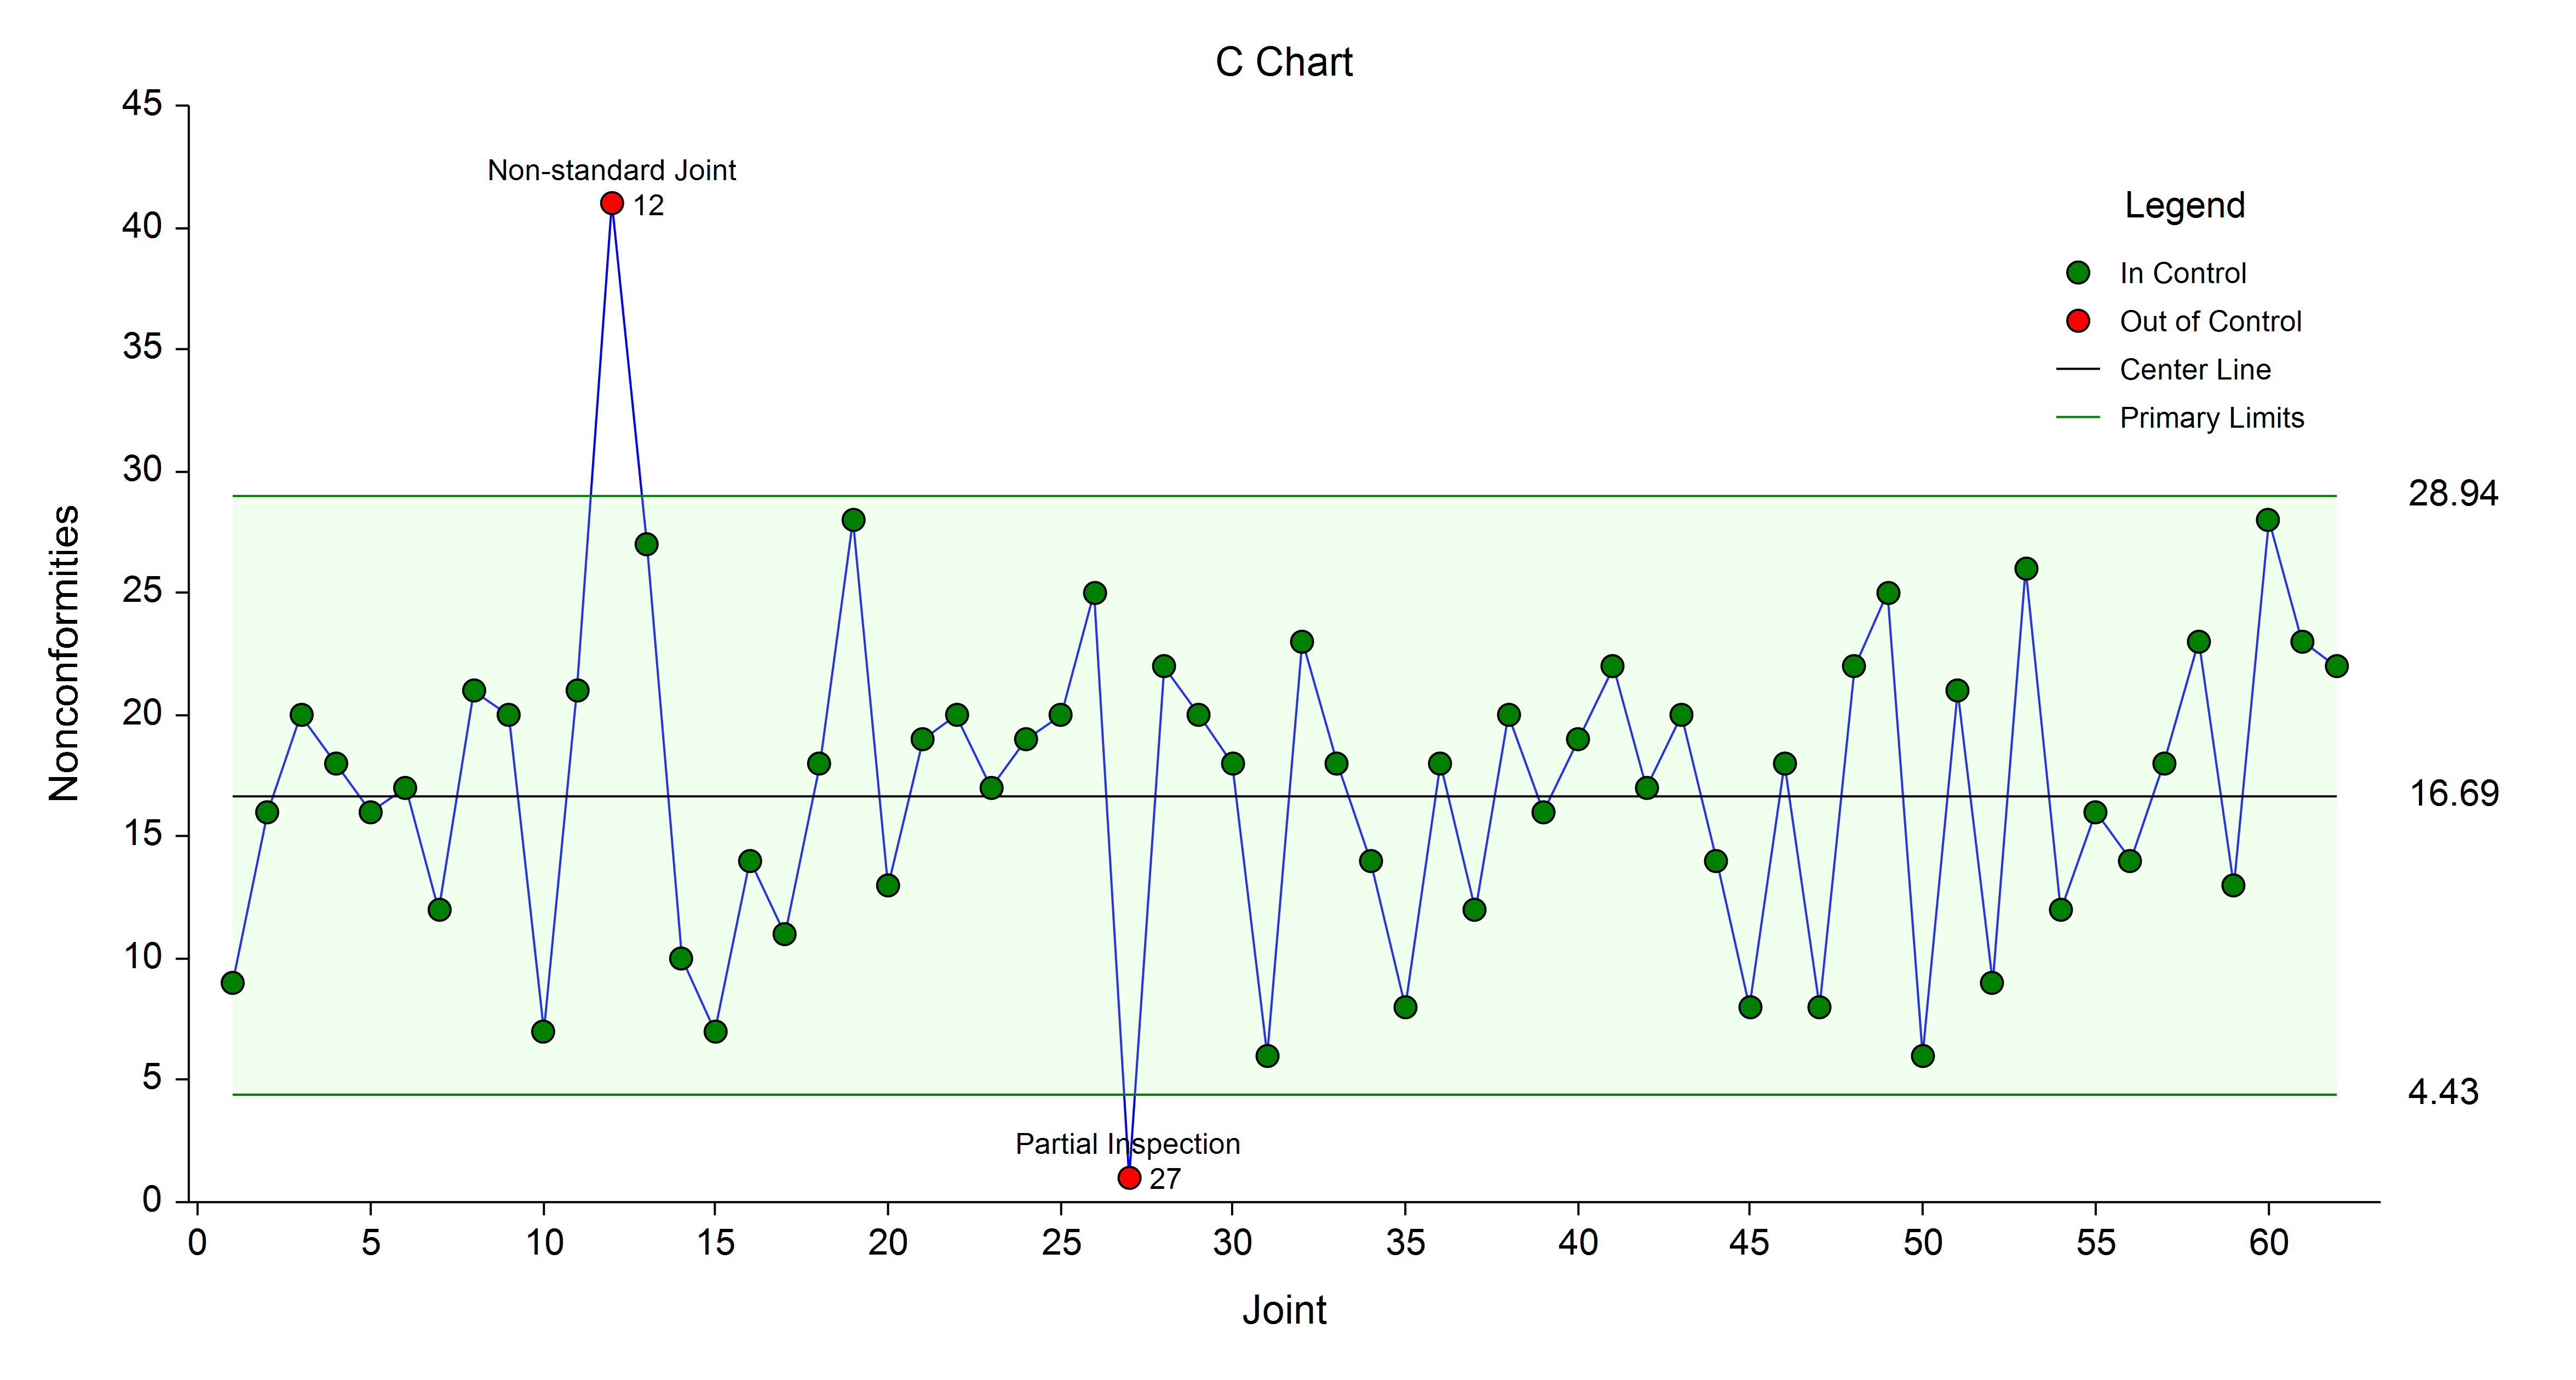
- Control Charts
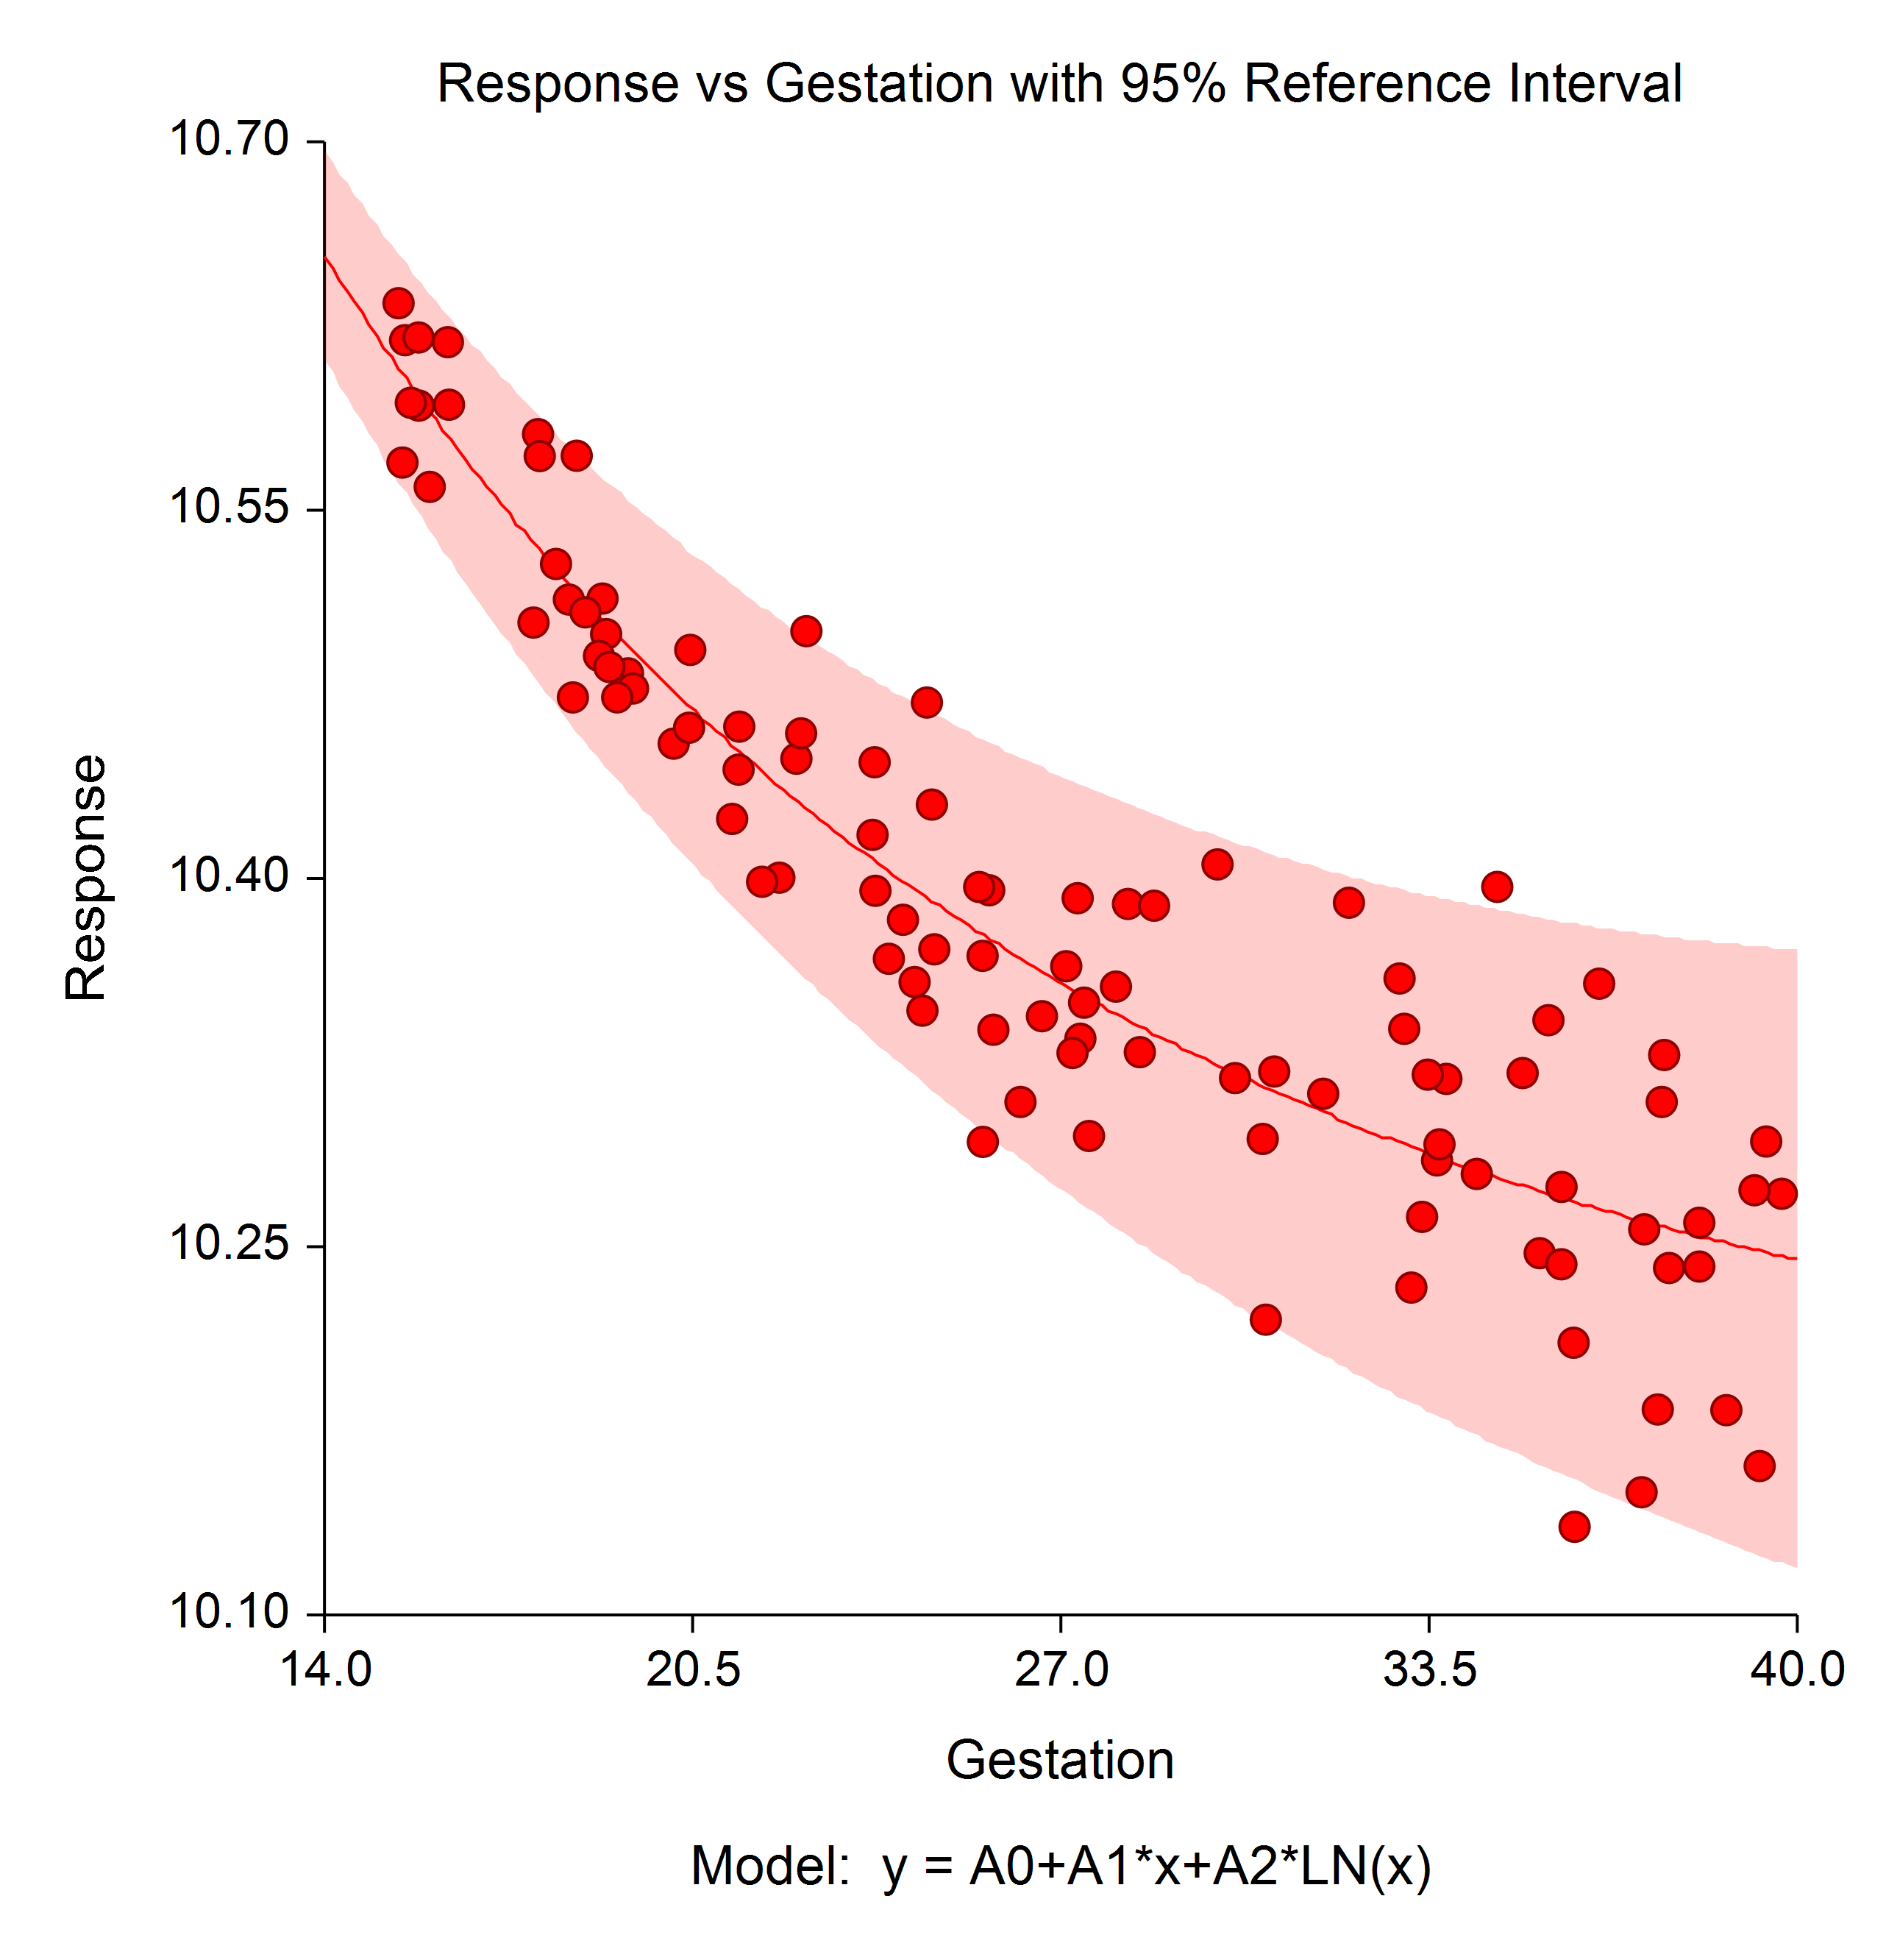
- Curve Fitting
- Experimental Design
- Lag Plots
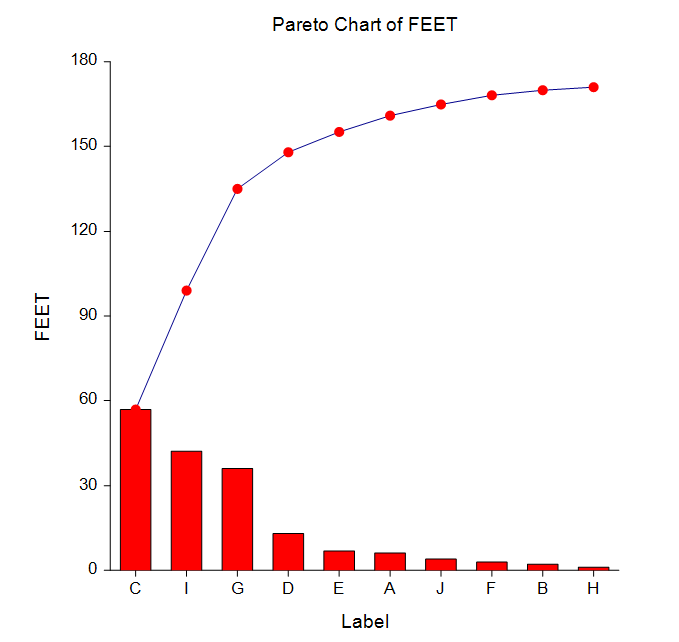
- Pareto Charts
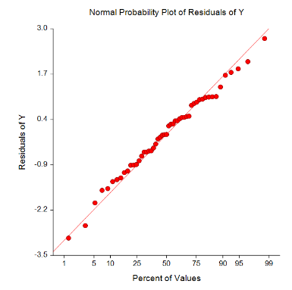
- Probability Plots
- R & R Study
- Regression
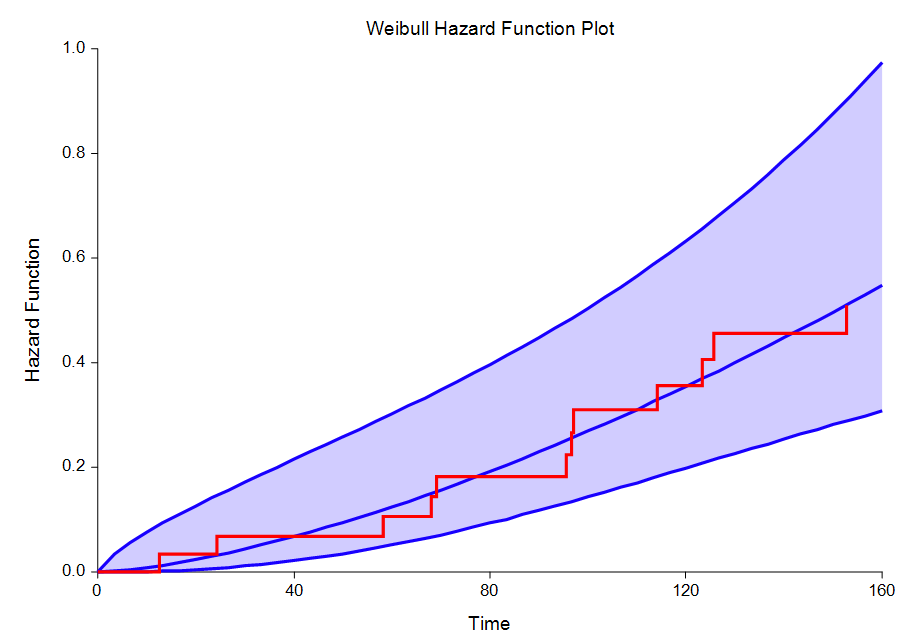
- Reliability Analysis
- Tolerance Intervals
“We have used your product for almost 20 years… Through each version of NCSS, we have been able to count on its user-friendly design, broad range of statistical tools and a high level of very personalized customer support.”
—Dr. George Ebra, Dr. Debra Guest
Quality Control Using NCSS Data Analysis and Graphics Software

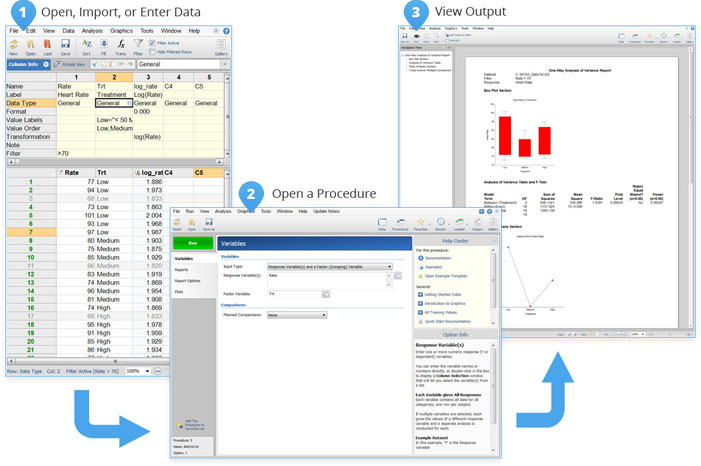
Each step in using NCSS is a breeze, and there are a variety of carefully crafted training videos for each topic. Complete documentation is included with the software, including technical details and examples. Click here to learn more about quality control in NCSS.
User-friendly Graphics
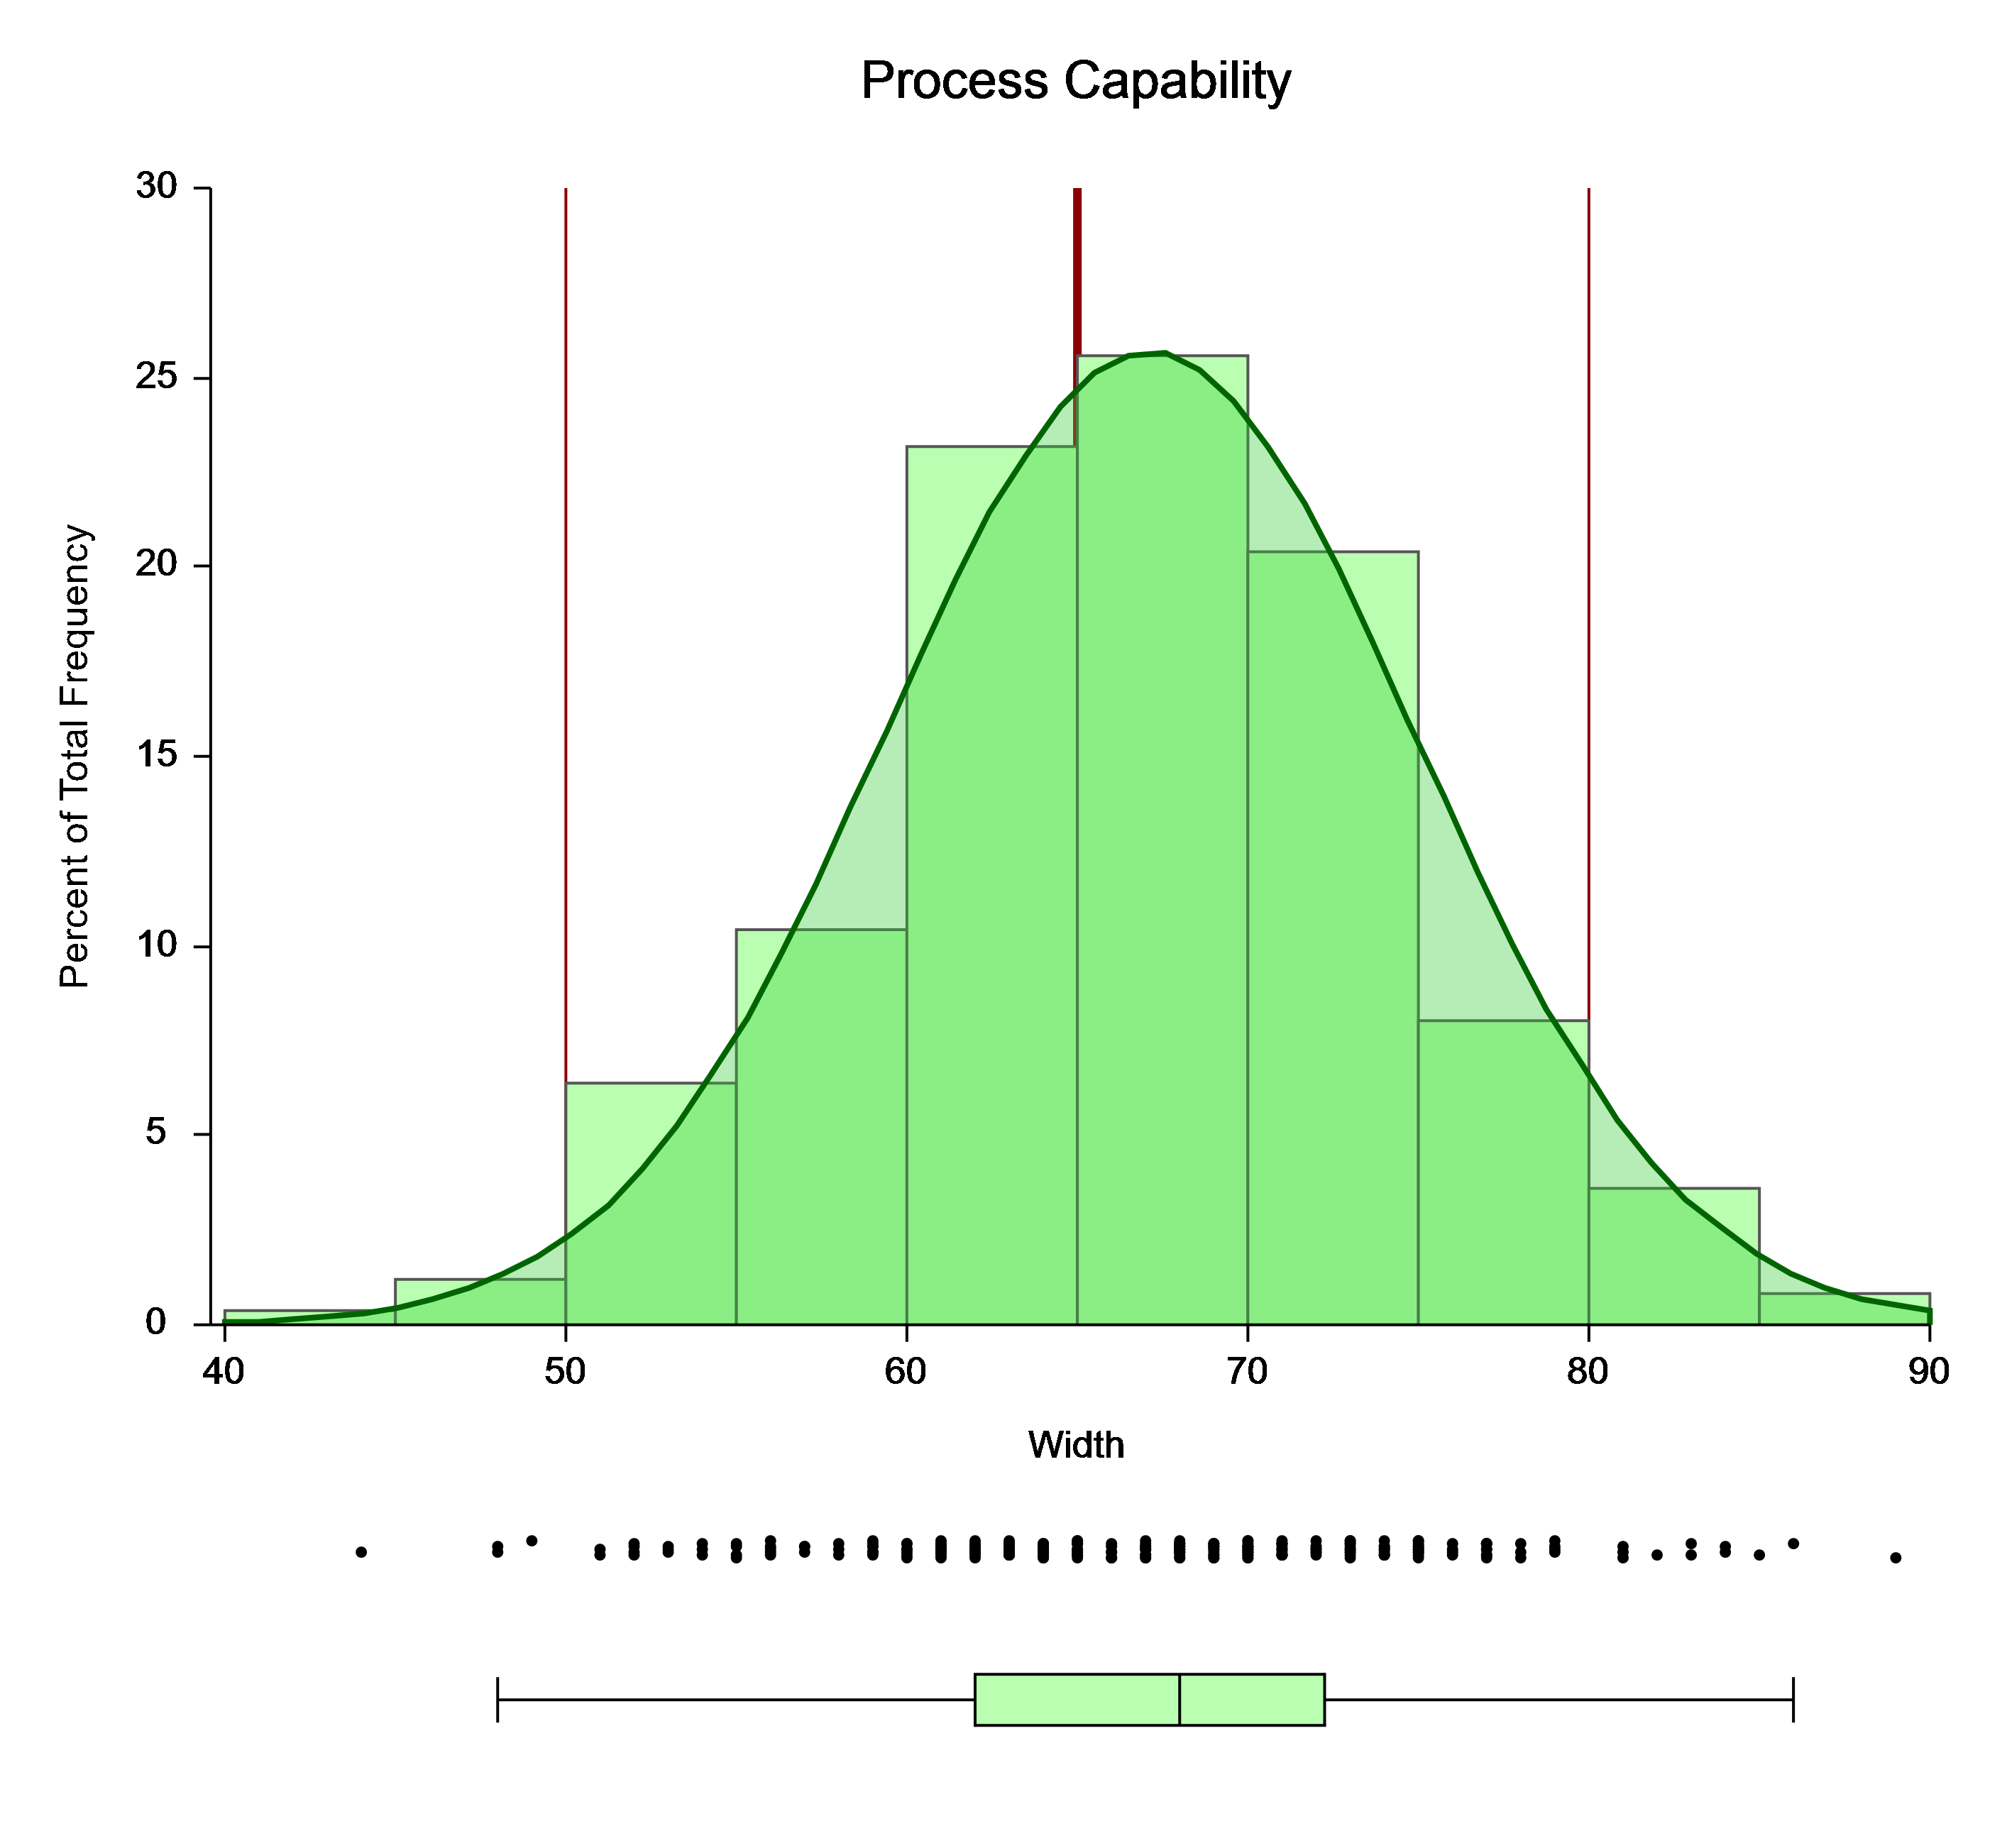
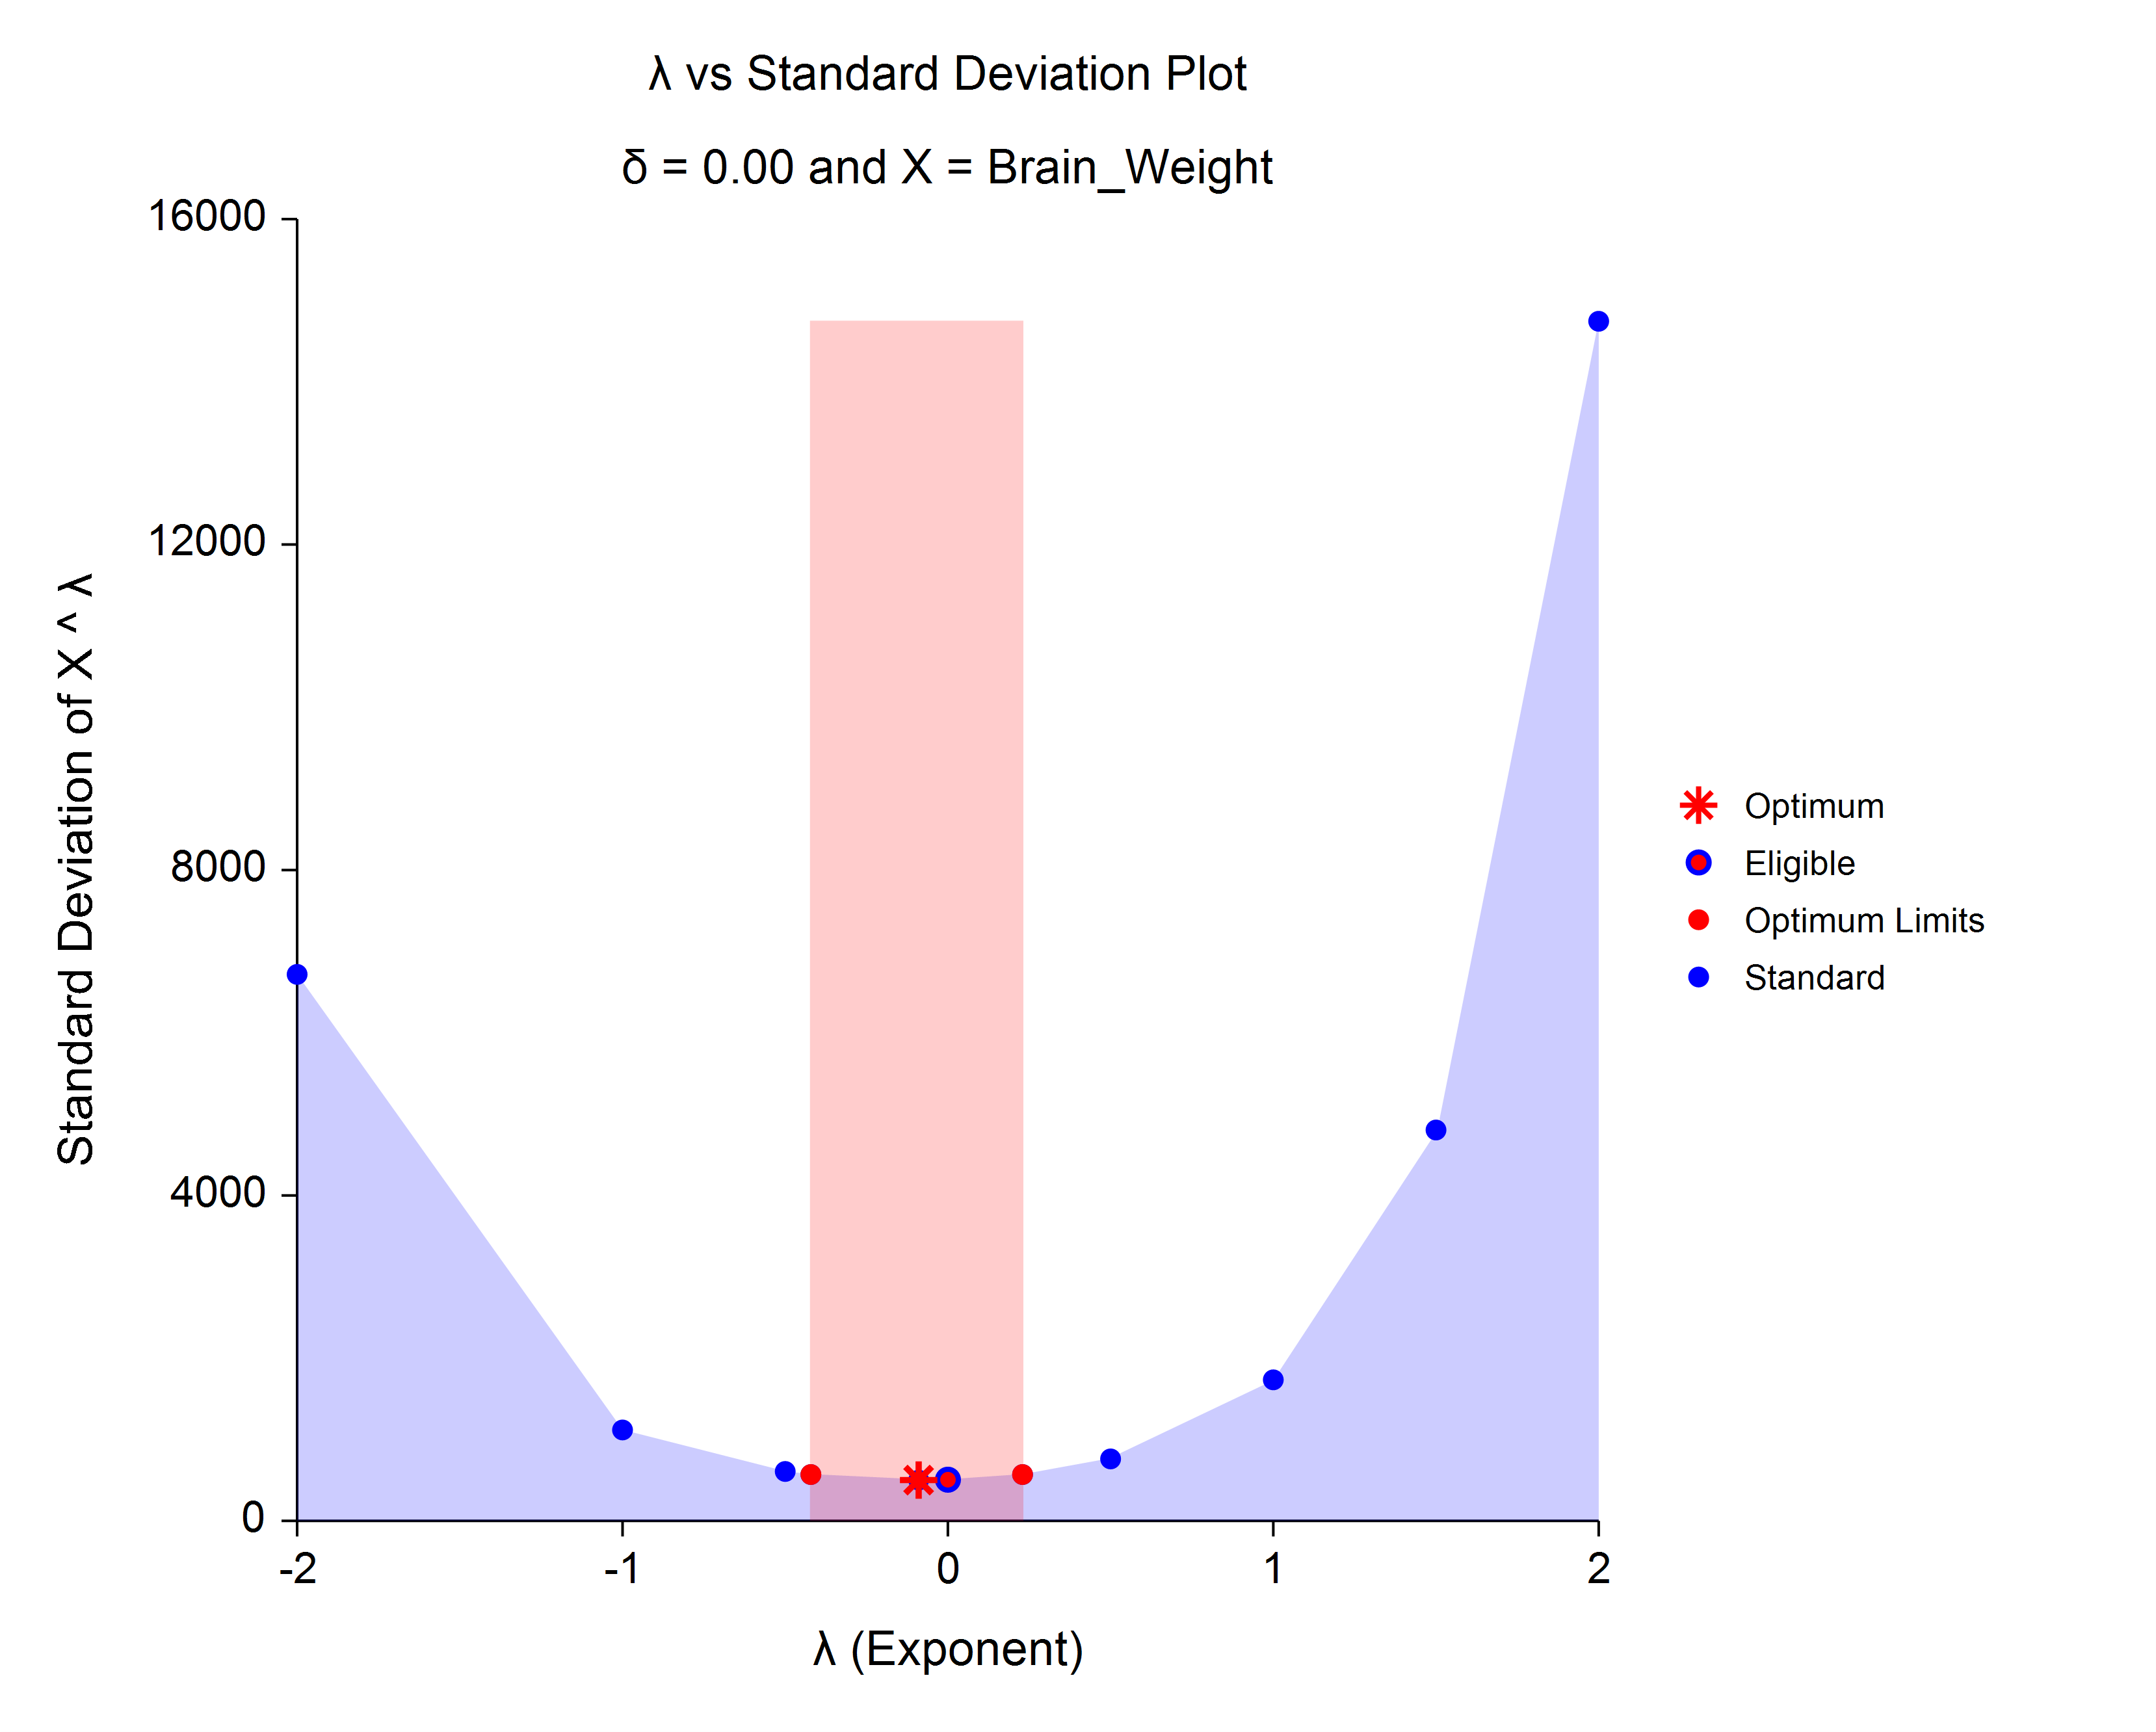
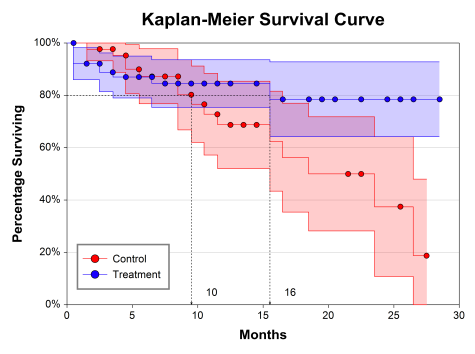
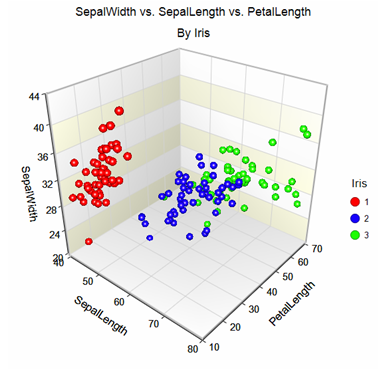
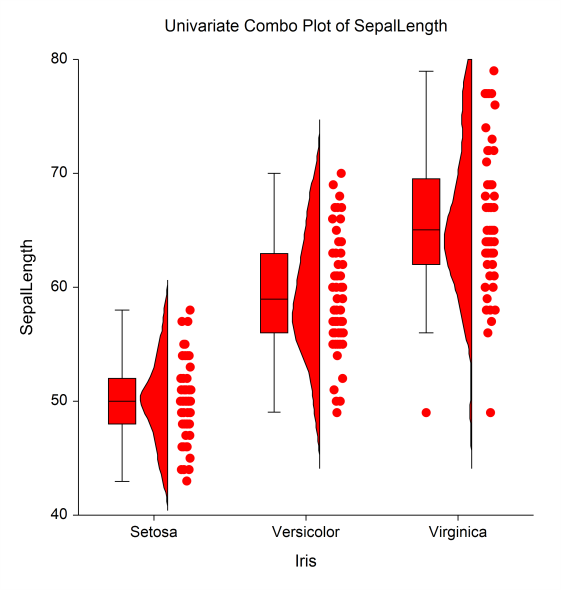
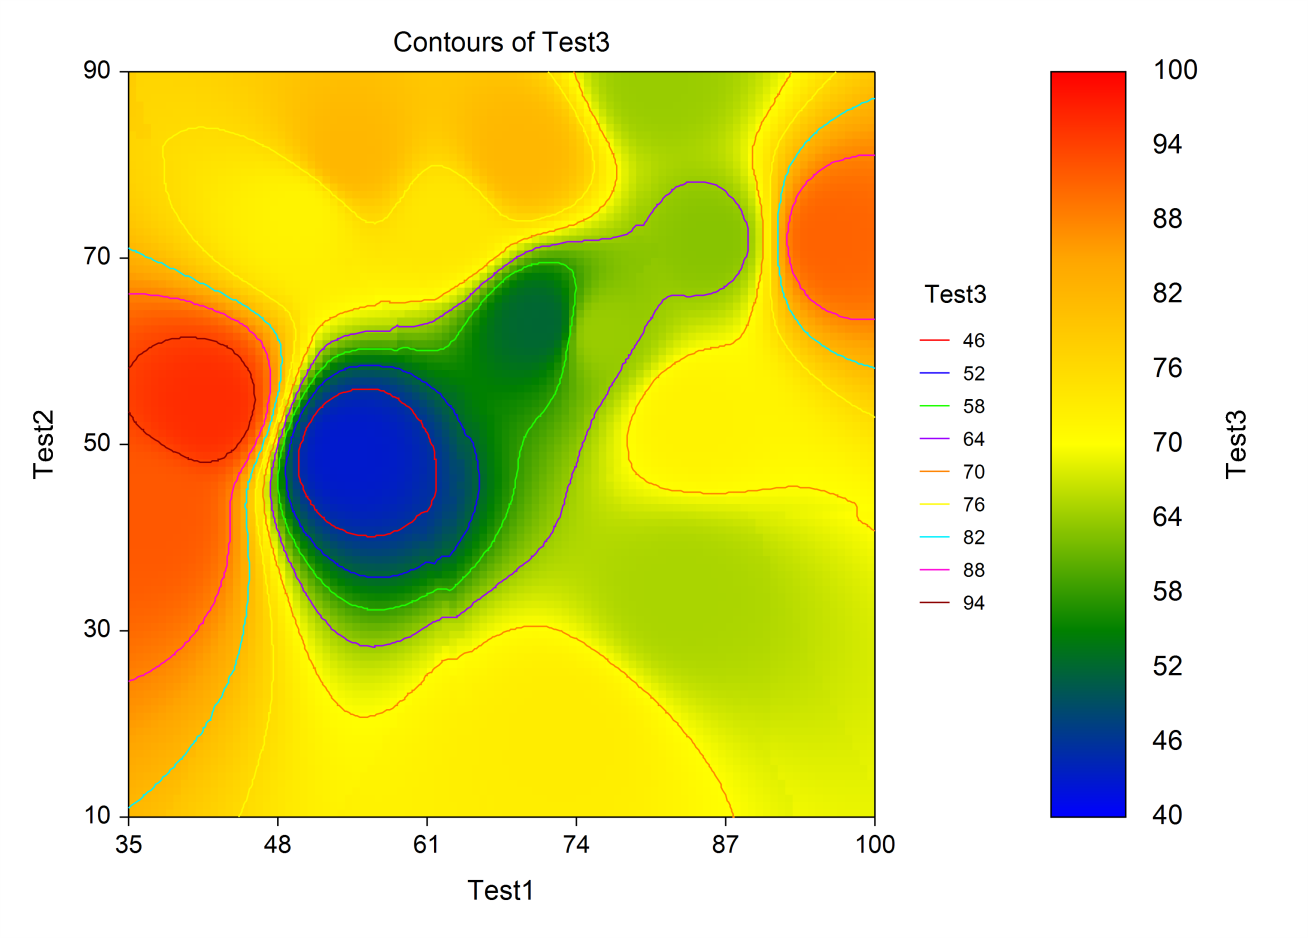
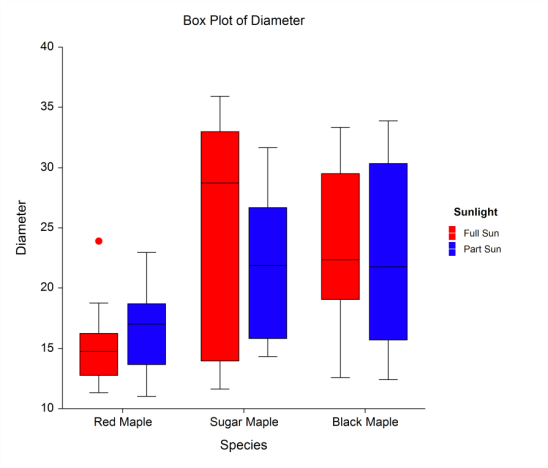
NCSS has a large collection of tools for plots, charts, and graphs. These graphics procedures offer extensive flexibility to get your graph to look just as you want it, while still maintaining ease-of-use and intuitiveness. Videos providing details of individual aspects of graphing in NCSS are available for free at our website.
