Sample Size for Normality Tests in PASS
PASS includes procedures for power analysis and sample size calculations for eight different tests of normality. The normality calculation procedures are easy-to-use and validated for accuracy. For more details about normality tests in PASS, we recommend you
download and install the free trial of the software.
Jump to:
Introduction
The Normality Calculation procedures in PASS allow you to study the power and sample size of eight statistical tests of normality:
- Anderson-Darling
- Kolmogorov-Smirnov
- Kurtosis
- Martinez-Iglewicz
- Omnibus
- Range
- Shapiro-Wilk
- Skewness
Since there are no formulas that allow the calculation of power directly, simulation is used. This gives you the ability to compare the adequacy of each test under a wide variety of situations, using any of several different simulation distributions.
The reason there are so many different normality tests is that there are many different forms of normality. Thode (2002) presents that following recommendations concerning which tests to use for each situation.
- Normal vs. Long-Tailed Symmetric Alternative Distributions
The Shapiro-Wilk and the kurtosis tests have been found to be best for normality testing against long-tailed symmetric alternatives.
- Normal vs. Short-Tailed Symmetric Alternative Distributions
The Shapiro-Wilk and the range tests have been found to be best for normality testing against short-tailed symmetric alternatives.
- Normal vs. Asymmetric Alternative Distributions
The Shapiro-Wilk and the skewness tests have been found to be best for normality testing against asymmetric alternatives.
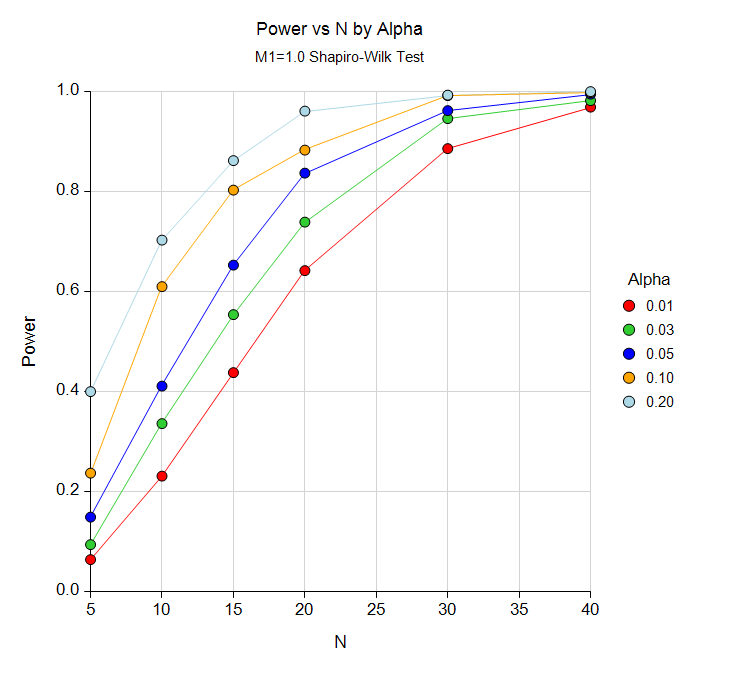
In the Normality Tests procedure in PASS, you may solve for either power or sample size. In a typical scenario where the goal is to estimate the sample size, the user enters power, alpha, the desired test, and specifies the simulation distribution. The procedure is run and the output shows a summary of the entries as well as the sample size estimate(s). A summary statement is given, as well as references to the articles from which the formulas for the result were obtained. For many of the parameters (e.g., power, alpha, and sample size), multiple values may be entered in a single run. When this is done, estimates are made for every combination of entered values. A numeric summary of these results is produced along with easy-to-read sample size or power curve graphs.

Technical Details
This page provides only a brief description of the tools that are available in PASS for power and sample size analysis for normality tests. If you would like to examine the formulas and technical details, we recommend you
download and install the free trial of the software, open the Normality Tests procedure, and click on the help button in the top right corner to view the complete documentation. There you will find summaries, formulas, references, discussions, technical details, examples, and validation against published articles.
An Example Setup and Output
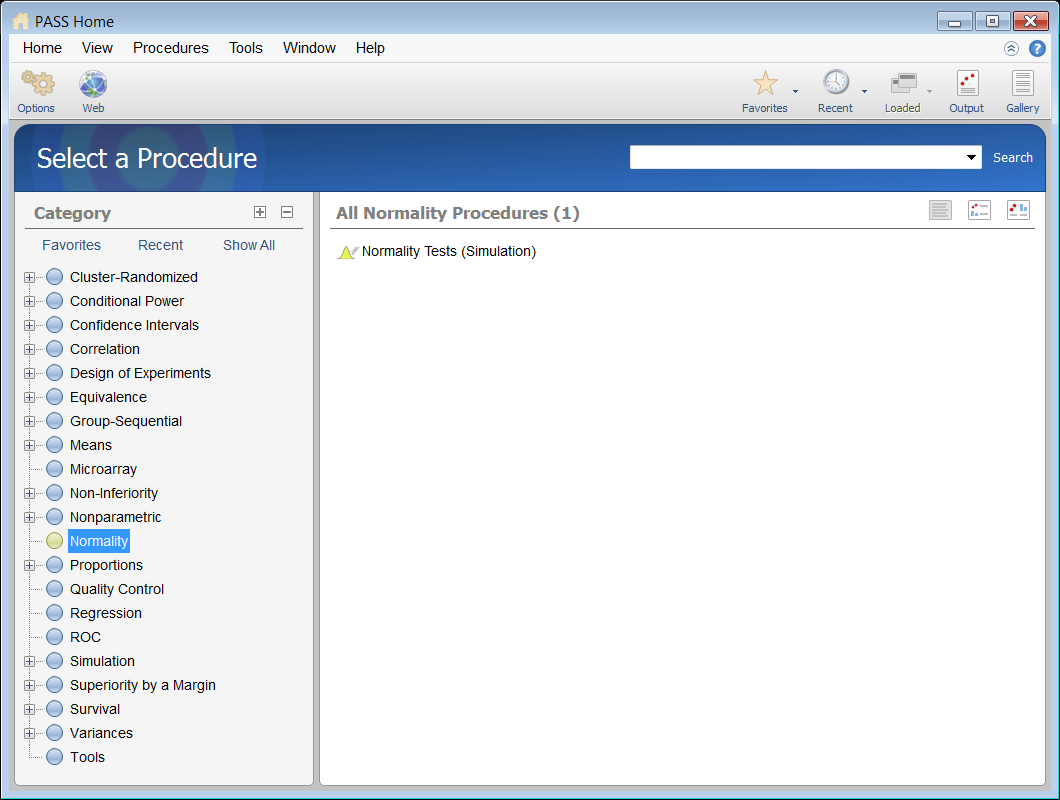
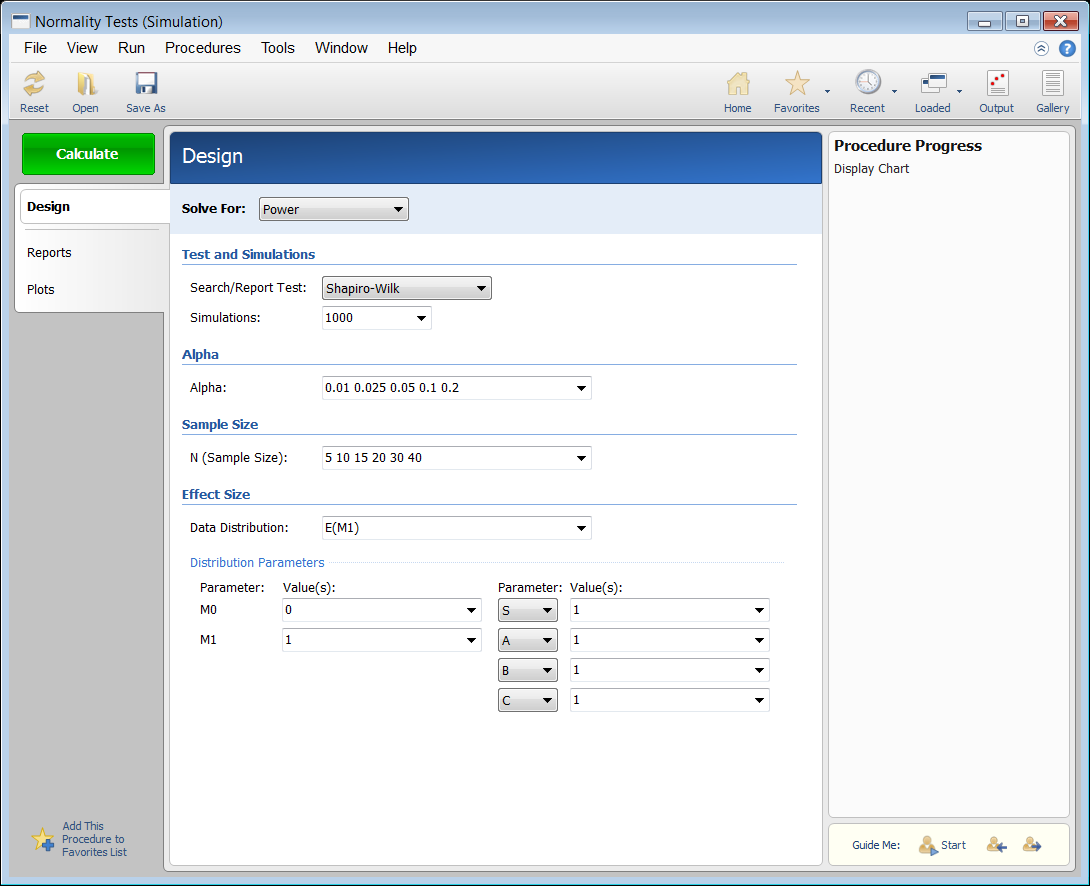
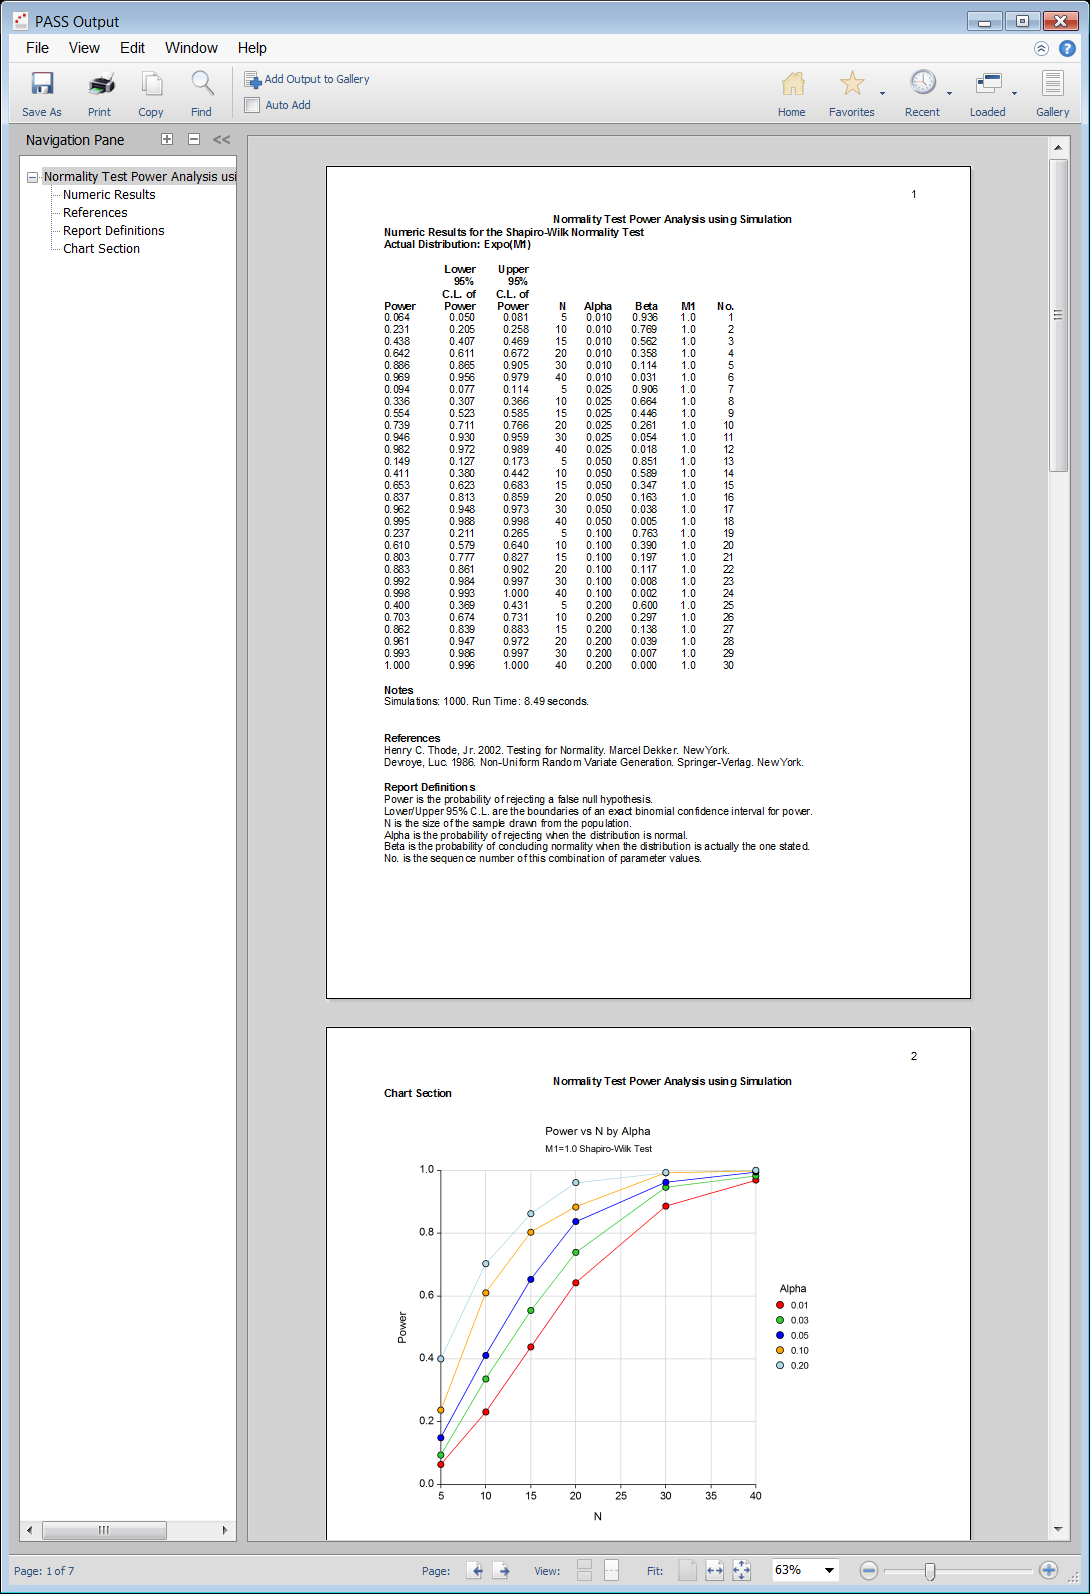
When the PASS software is first opened, the user is presented with the PASS Home window. From this window the desired procedure is selected from the menus, the category tree on the left, or with a procedure search. The procedure opens and the desired entries are made. When you click the Calculate button on the normality calculator the results are produced. You can easily navigate to any part of the output with the navigation pane on the left.
PASS Home Window

Procedure Window for Testing Normality

PASS Output Window


