Crosstabs and Analysis of Proportions in NCSS
NCSS contains many tools for analyzing and comparing proportions and analysis of contingency tables. Each procedure is easy-to-use and carefully validated for accuracy. Use the links below to jump to the proportions topic you would like to examine. To see how these tools can benefit you, we recommend you download and install the free trial of NCSS. Jump to:- Introduction
- Technical Details
- Two Independent Proportions and 2-by-2 Tables
- Contingency Tables (Crosstabs / Chi-Square Test)
- One Proportion
- Two Correlated Proportions (McNemar Test)
- Loglinear Models
- Mantel-Haenszel Test
Introduction
Proportions methods and contingency tables are used in statistical analysis when the response is binary (one of two possible values) or is a category. Many of the procedures give both exact and asymptotic results. Although not discussed here, logistic regression (and multinomial logistic regression) may also be used to analyze categorical response data.Technical Details
This page is designed to give a general overview of the capabilities of NCSS for analyzing contingency tables and analysis of proportions. If you would like to examine the formulas and technical details relating to a specific NCSS procedure, click on the corresponding '[Documentation PDF]' link under each heading to load the complete procedure documentation. There you will find formulas, references, discussions, and examples or tutorials describing the procedure in detail.Two Independent Proportions and 2-by-2 Tables
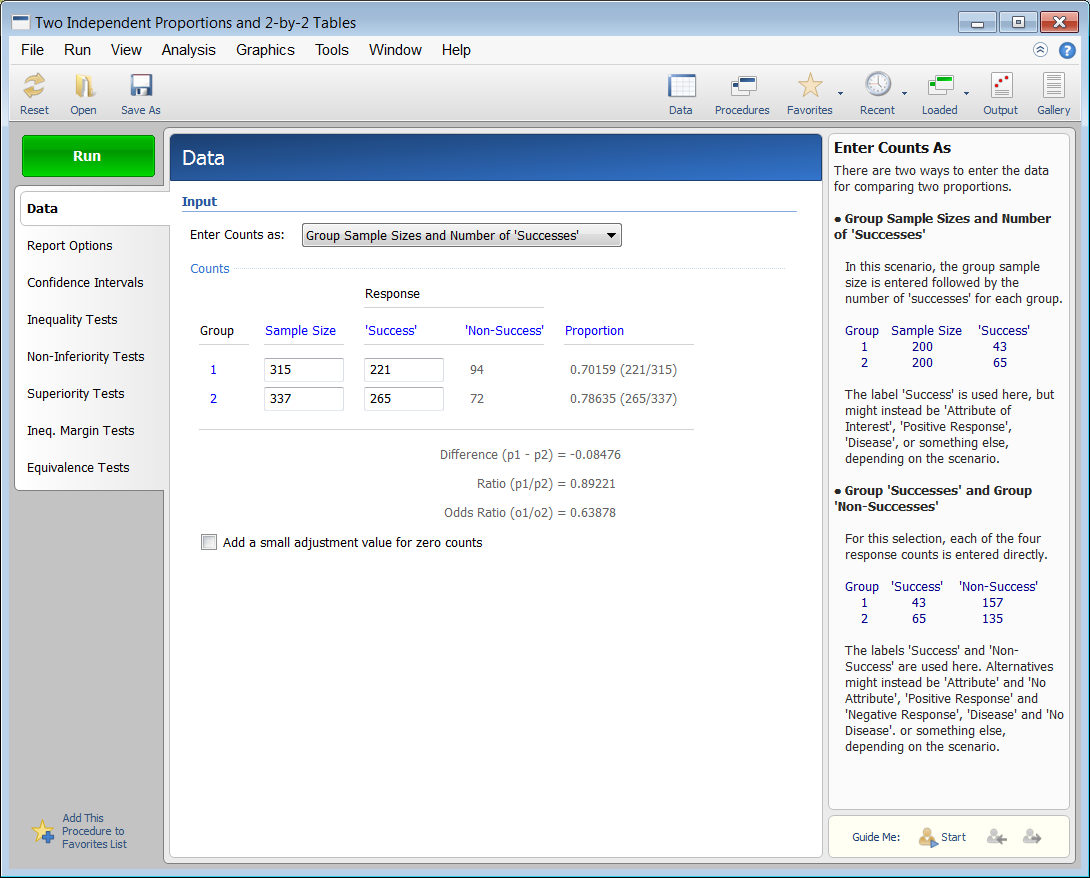
[Documentation PDF]The comparison of two proportions is a very common task among statistical analyses. This procedure computes both asymptotic and exact confidence intervals and hypothesis tests for the difference, ratio, and odds ratio of two proportions. This procedure can also be used for non-inferiority tests, superiority (by a margin) tests and equivalence tests. This procedure can be used to compute 29 types of confidence intervals, over 16 tests for the difference, ratio, or odds ratio of two proportions (including Likelihood Ratio tests, Fisher's Exact test, Z-tests, Mantel-Haenszel test, Conditional Exact tests, and so on), 16 noninferiority tests, 16 superiority tests, and 16 equivalence tests. The data input is very straightforward:
Two Proportions Data Input
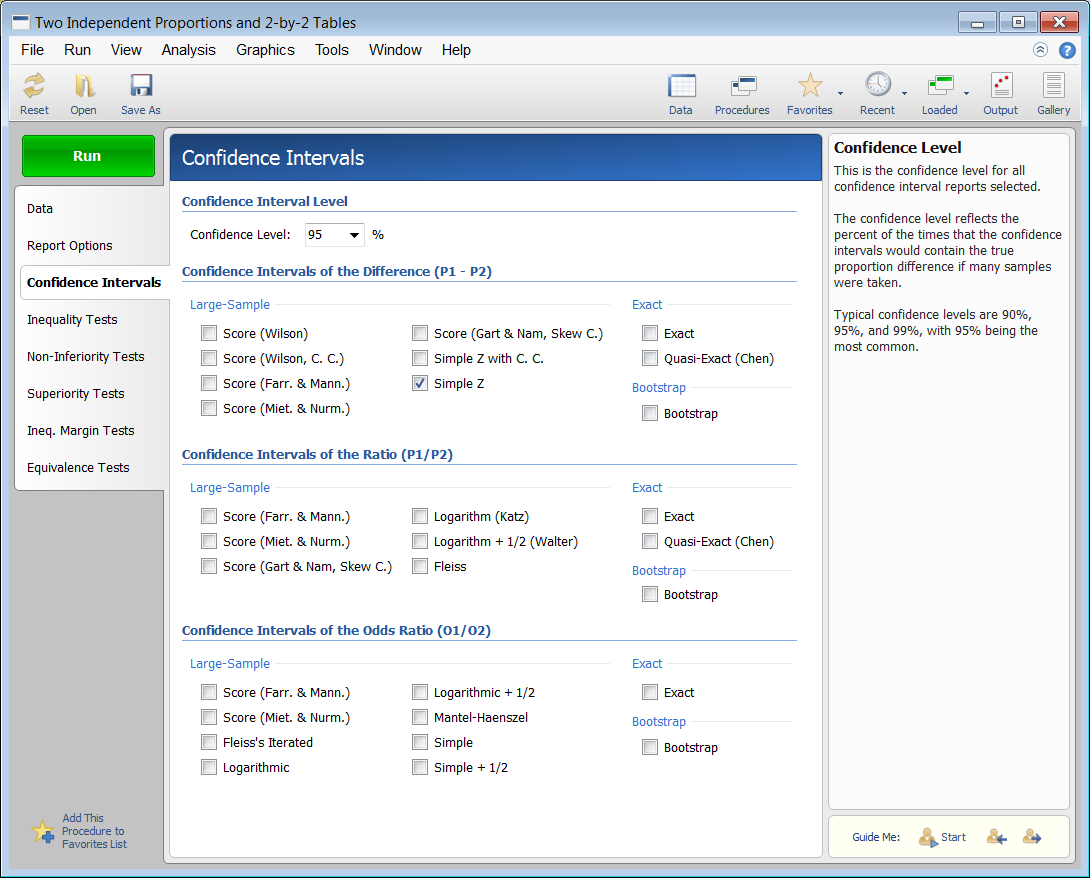
 The selection of desired confidence intervals and hypothesis tests is as simple as checking a box.
Two Proportions Confidence Intervals Tab
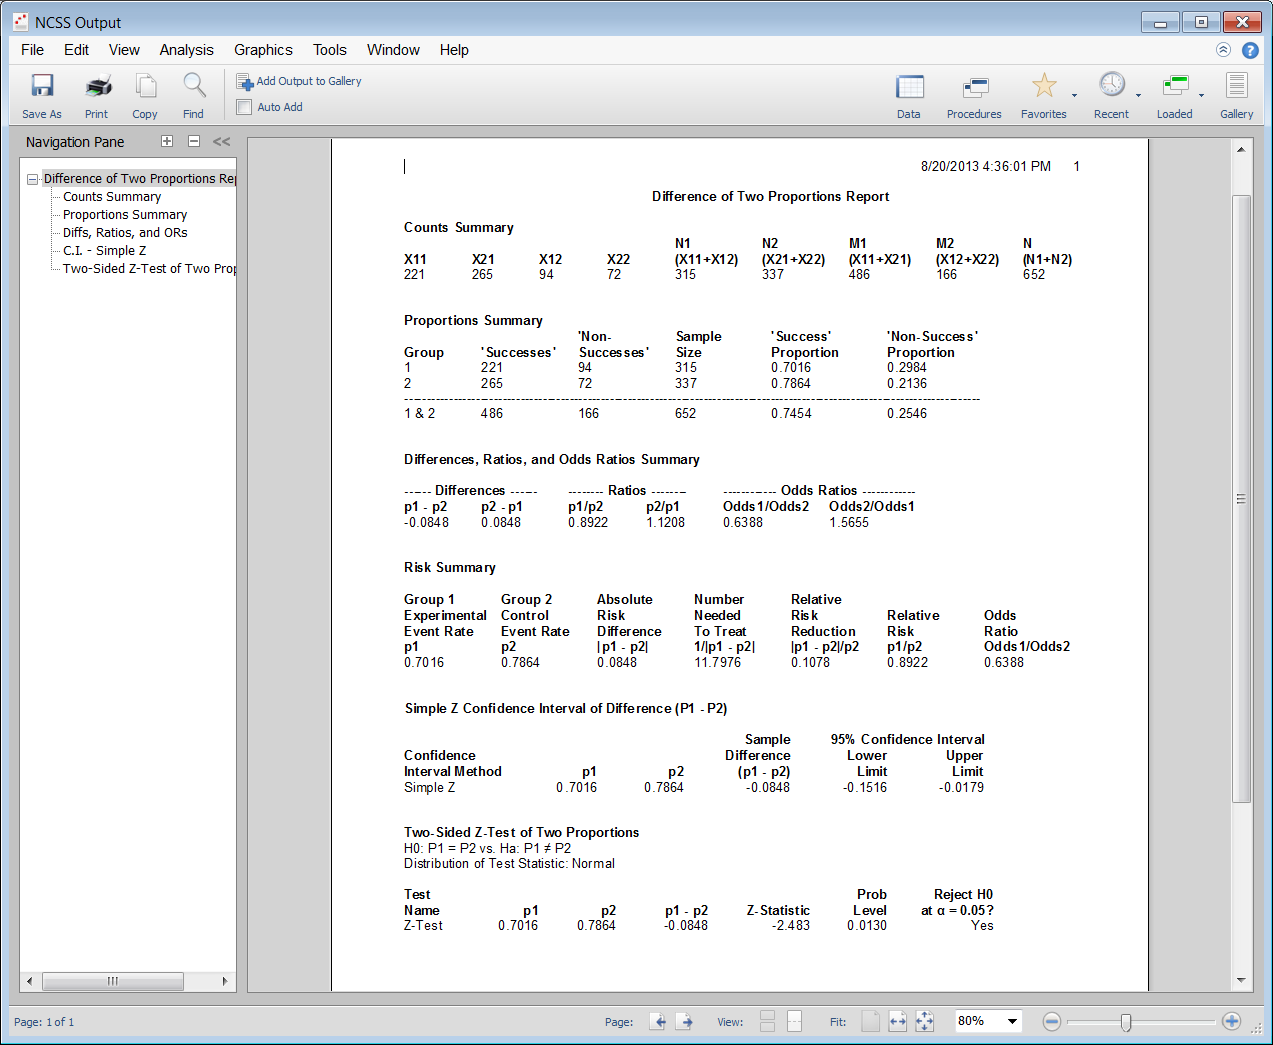
 Once all the desired confidence intervals and tests are selected, pressing Run gives the straightforward, easy-to-read output.
Two Proportions Analysis Output

Contingency Tables (Crosstabs / Chi-Square Test)
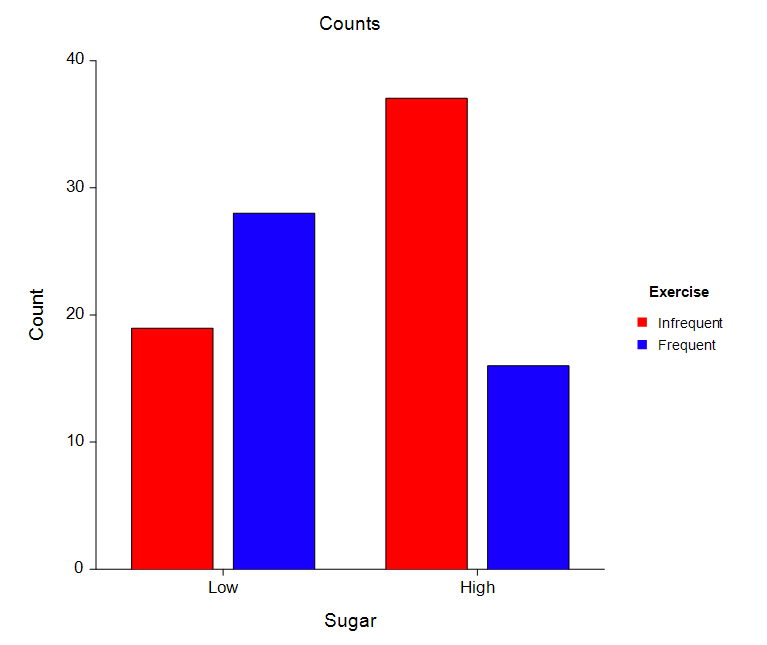
[Documentation PDF]This procedure produces tables of counts and percentages for the joint distribution of two categorical variables. Such tables are known as contingency, cross-tabulation, or crosstab tables. When a breakdown of more than two variables is desired, you can specify up to eight grouping (break) variables in addition to the two table variables. A separate table is generated for each unique set of values of these grouping variables. This procedure serves as a summary reporting tool and is often used to analyze survey data. It calculates most of the popular contingency-table statistics and tests such as chi-square, Fisher’s exact, and McNemar’s tests, as well as the Armitage test for trend in proportions and the Kappa and weighted Kappa tests for inter-rater agreement. This procedure also produces a broad set of association and correlation statistics for contingency tables: Phi, Cramer’s V, Pearson’s Contingency Coefficient, Tschuprow’s T, Lamba, Kendall’s Tau, and Gamma. Plots based on counts, table percentages, row percentages, column percentages, expected counts, chi-square contributions, deviations from independence, and standardized residuals may also be produced.
A Plot of Counts in a Contingency Table Analysis

One Proportion
[Documentation PDF]This procedure computes confidence limits and hypothesis tests for a single proportion. Exact results, based on the binomial distribution, are calculated. Approximate results, based on the normal approximation to the binomial distribution are also given. In the case of a single proportion, the exact results are preferable to the approximate results and should always be used. The approximate results are available in the software because they are commonly presented in elementary statistical texts.
Two Correlated Proportions (McNemar Test)
[Documentation PDF]This procedure computes confidence intervals and hypothesis tests for the comparison of the marginal frequencies of two factors (each with two levels) based on a 2-by-2 table of n pairs. Confidence limits can be obtained for the marginal probability difference, ratio, or odds ratio. Inequality, non-inferiority, superiority (by a margin) tests, and equivalence tests are available for the marginal probability difference and ratio.
Loglinear Models
[Documentation PDF]Loglinear models (LLM) are used to study the relationships among two or more discrete variables. Often referred to as multiway frequency analysis, it is an extension of the familiar chi-square test for independence in two-way contingency tables. LLM may be used to analyze surveys and questionnaires which have complex interrelationships among the questions. Although questionnaires are often analyzed by considering only two questions at a time, this ignores important three-way (and multi-way) relationships among the questions. The use of LLM on this type of data is analogous to the use of multiple regression rather that simple correlations on continuous data. Reports in this procedure include multi-term reports, single-term reports, chi-square reports, model reports, parameter estimation reports, and table reports.
Mantel-Haenszel Test
[Documentation PDF]The Mantel-Haenszel test compares the odds ratios of several 2-by-2 tables. The Mantel-Haenszel analysis provides two closely related pieces of information. First, it provides statistical tests of whether the odds ratios are equal (homogeneous) or unequal (heterogeneous) across strata. Second, it provides an estimate of the odds ratio of the exposure variable, adjusted for the strata variable.
