Distribution Fitting in NCSS
There are a number of tools available in NCSS for distribution fitting. NCSS includes both graphical tools, such as probability plots and survival plots, and numeric analysis tools like beta, gamma, and Weibull distribution fitting, normality tests, and Grubbs’ Outlier Test. All of the procedures in NCSS are validated for accuracy and are easy to learn and use. Use the links below to jump to the distribution fitting topic you would like to examine. To see how these tools can benefit you, we recommend you download and install the free trial of NCSS. Jump to:- Introduction
- Technical Details
- Distribution (Weibull) Fitting
- Beta Distribution Fitting
- Gamma Distribution Fitting
- Grubbs' Outlier Test
- Normality Tests
- Probability Plots
Introduction
Distribution fitting is often used in survival and reliability applications for modeling lifetime or failure rates. By fitting the data to a distribution, one is able to make predictions about future events and draw conclusions from the data based on the fitted distribution. The beta, gamma, and Weibull distributions are often used to fit survival or reliability data. Another application of distribution fitting is in checking assumptions in data modeling and analysis. A common assumption in many analyses is that the data or the residuals are normally distributed. Normality tests and probability plots are useful for checking these important distributional assumptions.Technical Details
This page is designed to give a general overview of the capabilities of NCSS for distribution fitting. If you would like to examine the formulas and technical details relating to a specific NCSS procedure, click on the corresponding '[Documentation PDF]' link under each heading to load the complete procedure documentation. There you will find formulas, references, discussions, and examples or tutorials describing the procedure in detail.Distribution (Weibull) Fitting
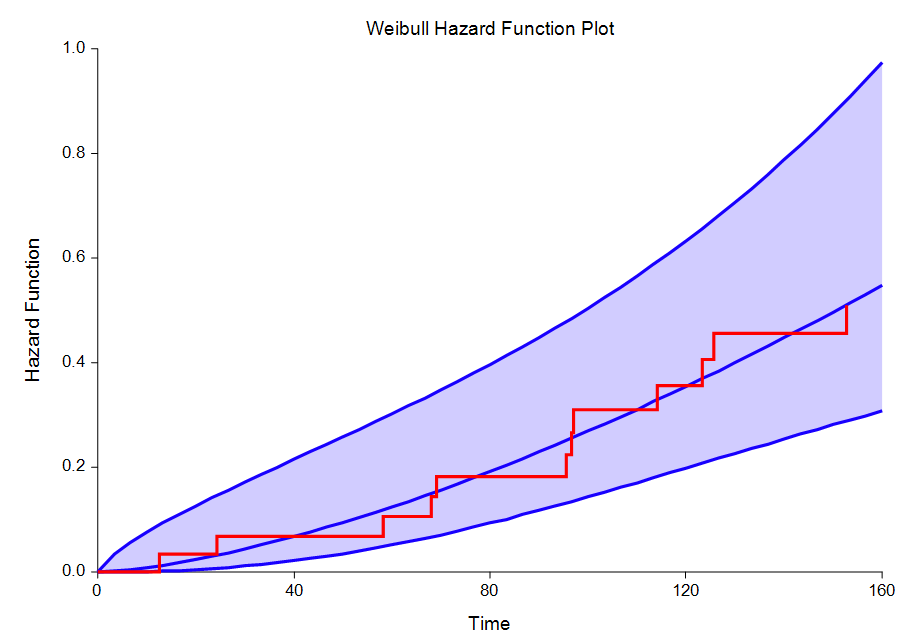
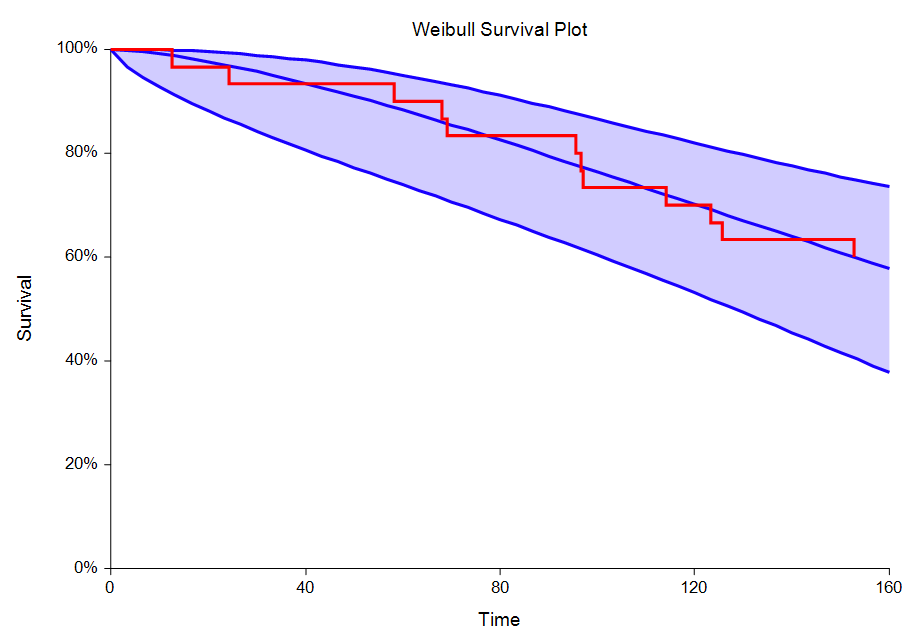
[Documentation PDF]The Distribution (Weibull) Fitting procedure in NCSS estimates the parameters of the exponential, extreme value, logistic, log-logistic, lognormal, normal, and Weibull probability distributions by maximum likelihood. It can fit complete, right censored, left censored, interval censored (readout), and grouped data values. It also computes the nonparametric Kaplan-Meier and Nelson-Aalen estimates of survival and associated hazard rates. It outputs various statistics and graphs that are useful in reliability and survival analysis. When the choice of the probability distribution is in doubt, the procedure helps select an appropriate probability distribution from those available. Features of this procedure include:
- 1. Probability plotting, hazard plotting, and reliability plotting for the common life distributions. The data may be any combination of complete, right censored, left censored, and interval censored data.
- 2. Maximum likelihood and probability plot estimates of distribution parameters, percentiles, reliability (survival) functions, hazard rates, and hazard functions.
- 3. Confidence intervals for distribution parameters and percentiles.
- 4. Nonparametric estimates of survival using the Kaplan-Meier procedure.
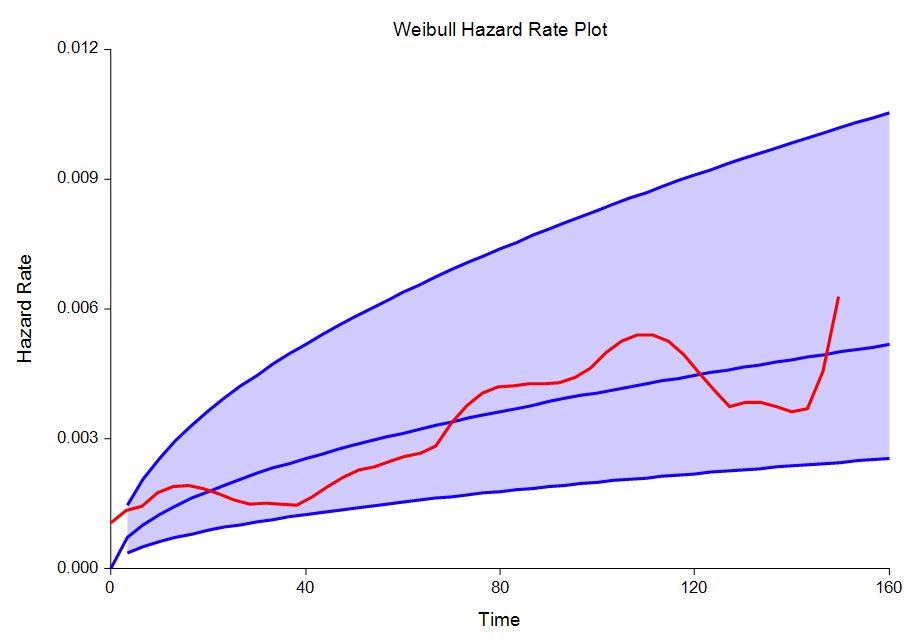
Sample Distribution Fitting Plots Made with NCSS
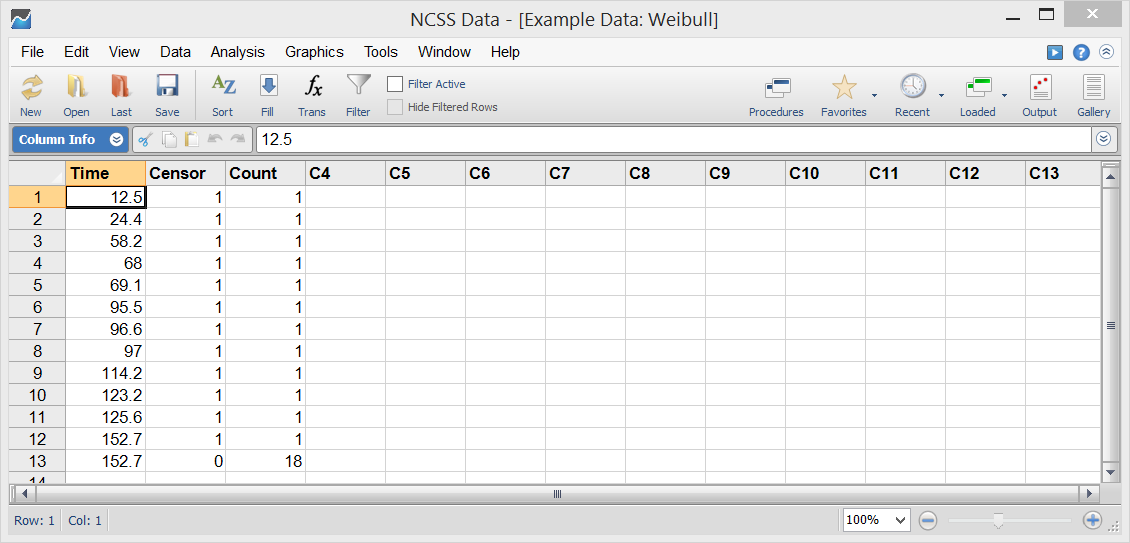
Sample Data
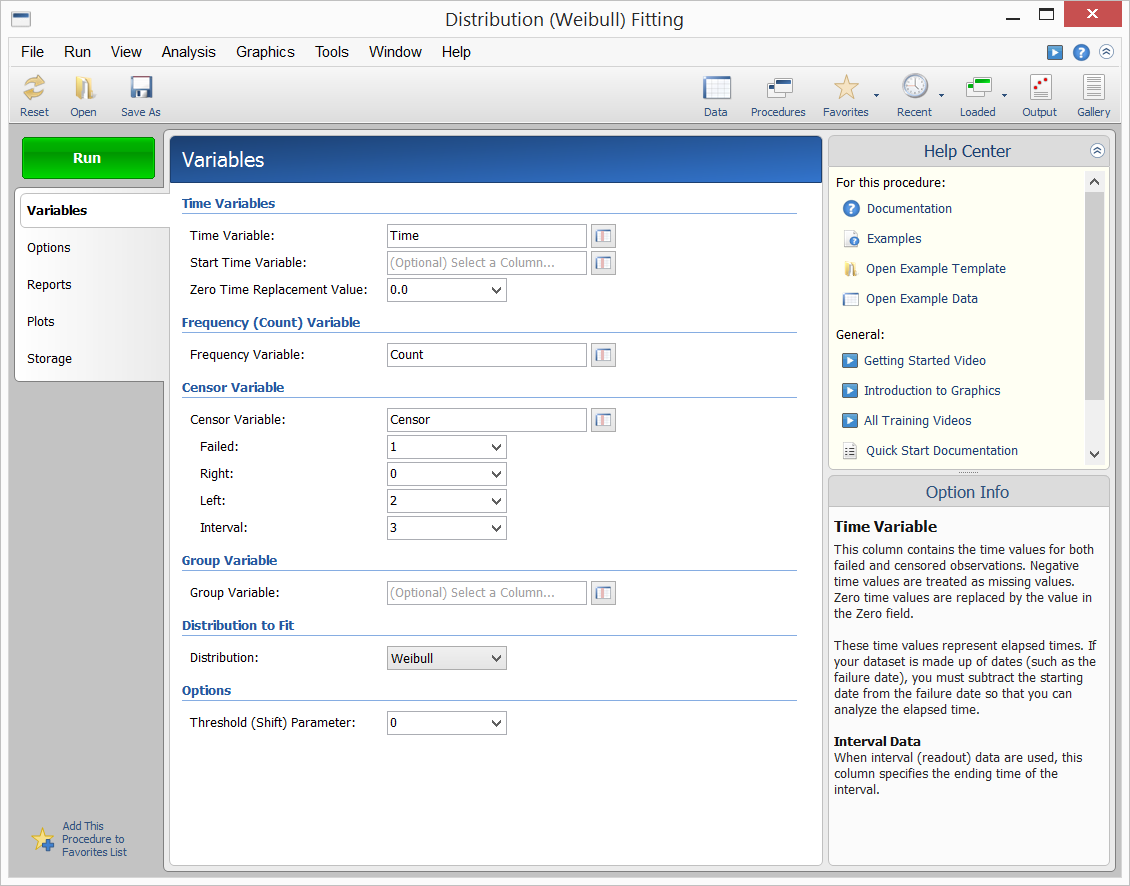
Procedure Input
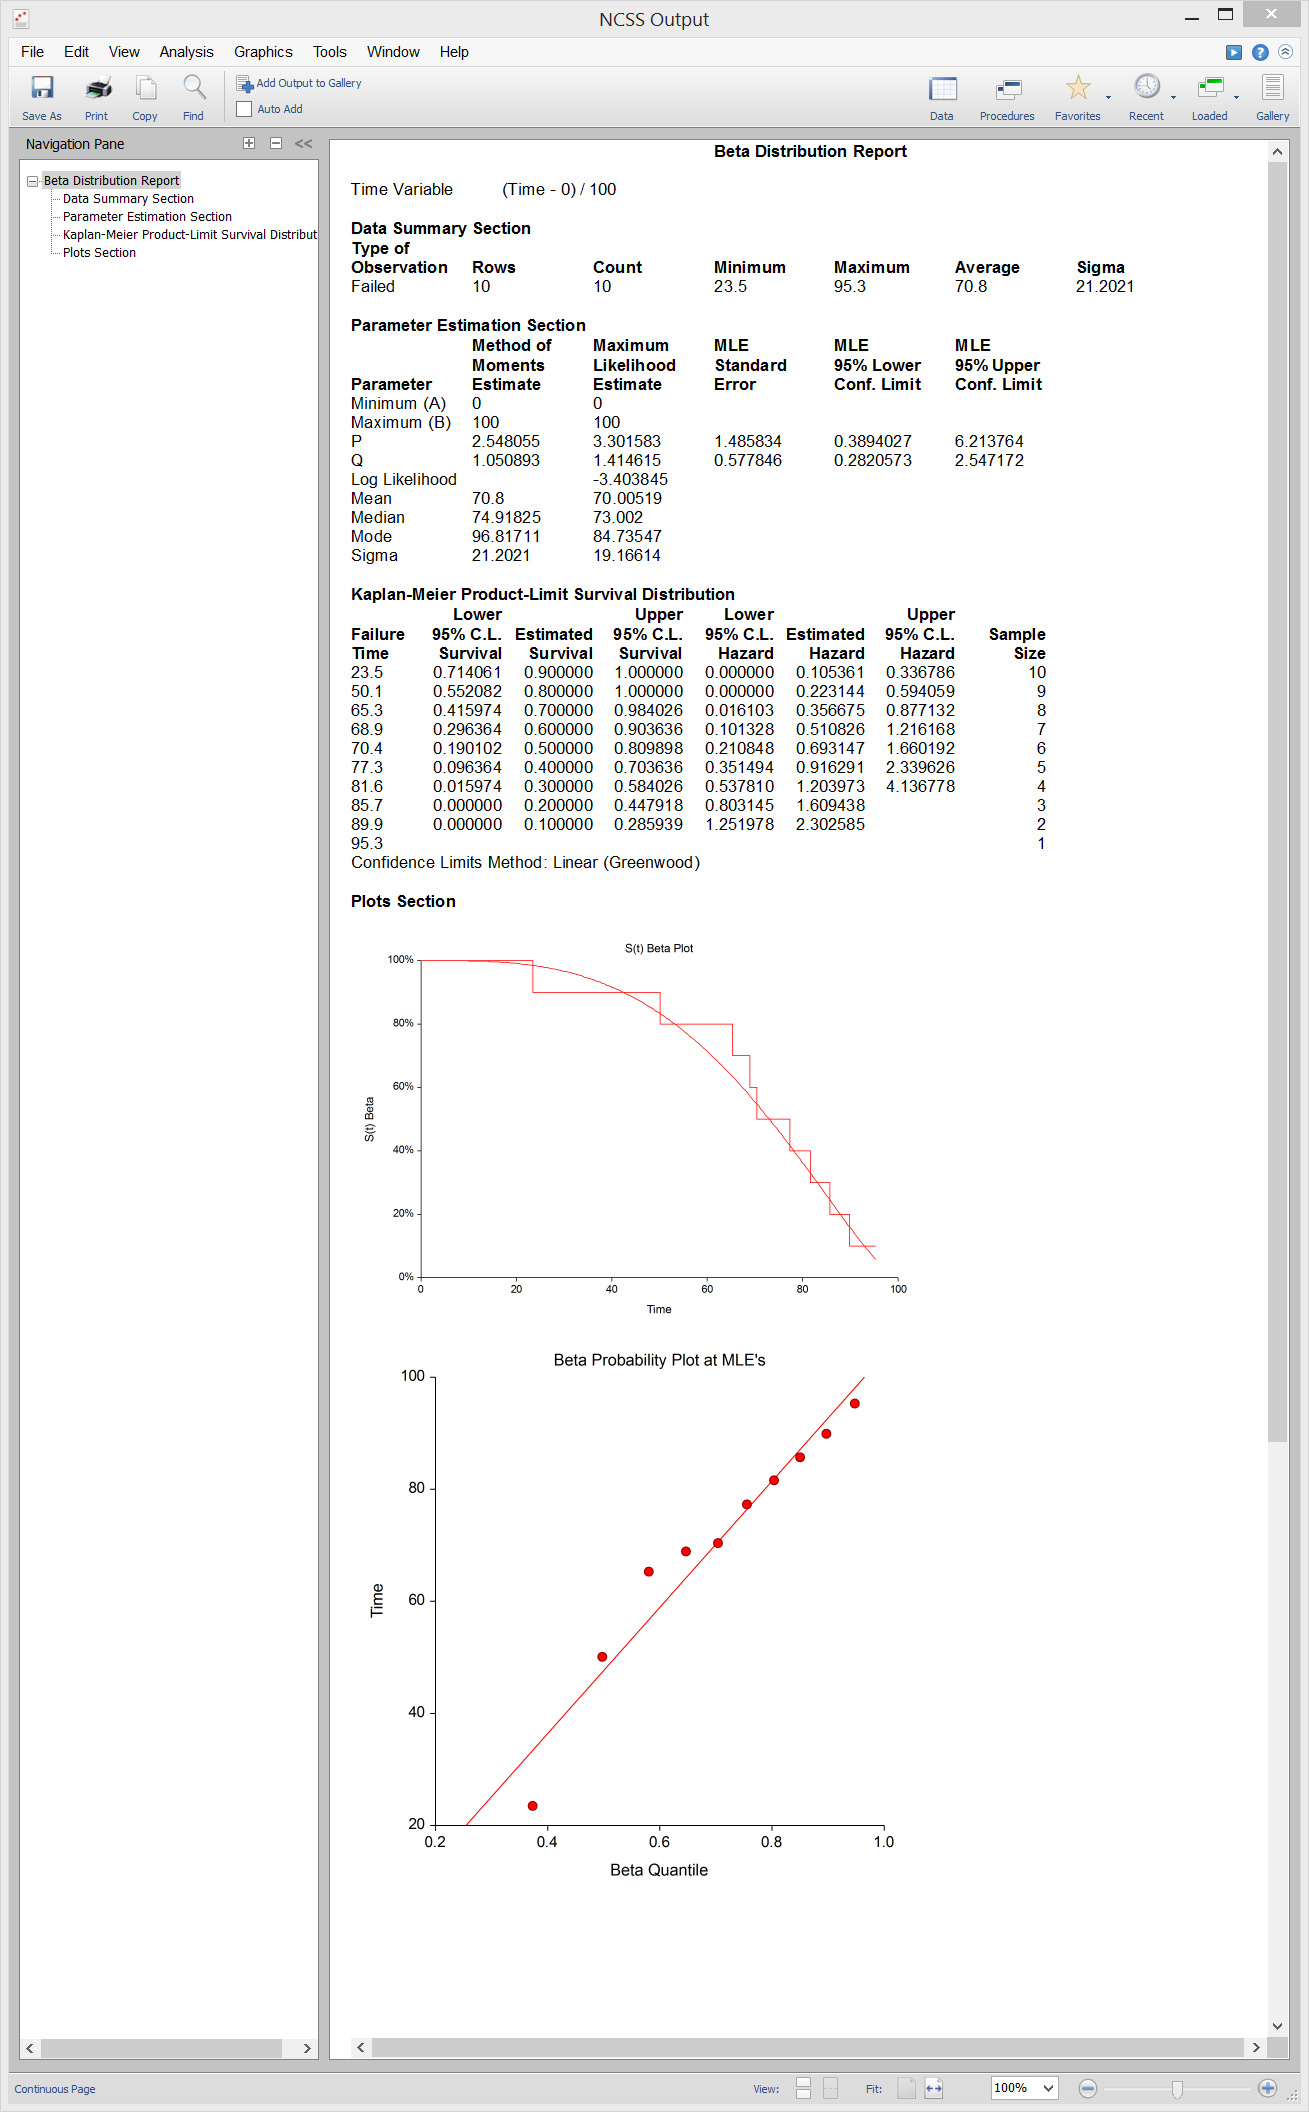
Sample Output

Beta Distribution Fitting
[Documentation PDF]The Beta Distribution Fitting procedure fits the beta probability distributions to a complete set of individual or grouped data values. It outputs various statistics and graphs that are useful in reliability and survival analysis. The beta distribution is useful for fitting data which have an absolute maximum (and minimum). It finds some application as a lifetime distribution.
Sample Output
Gamma Distribution Fitting
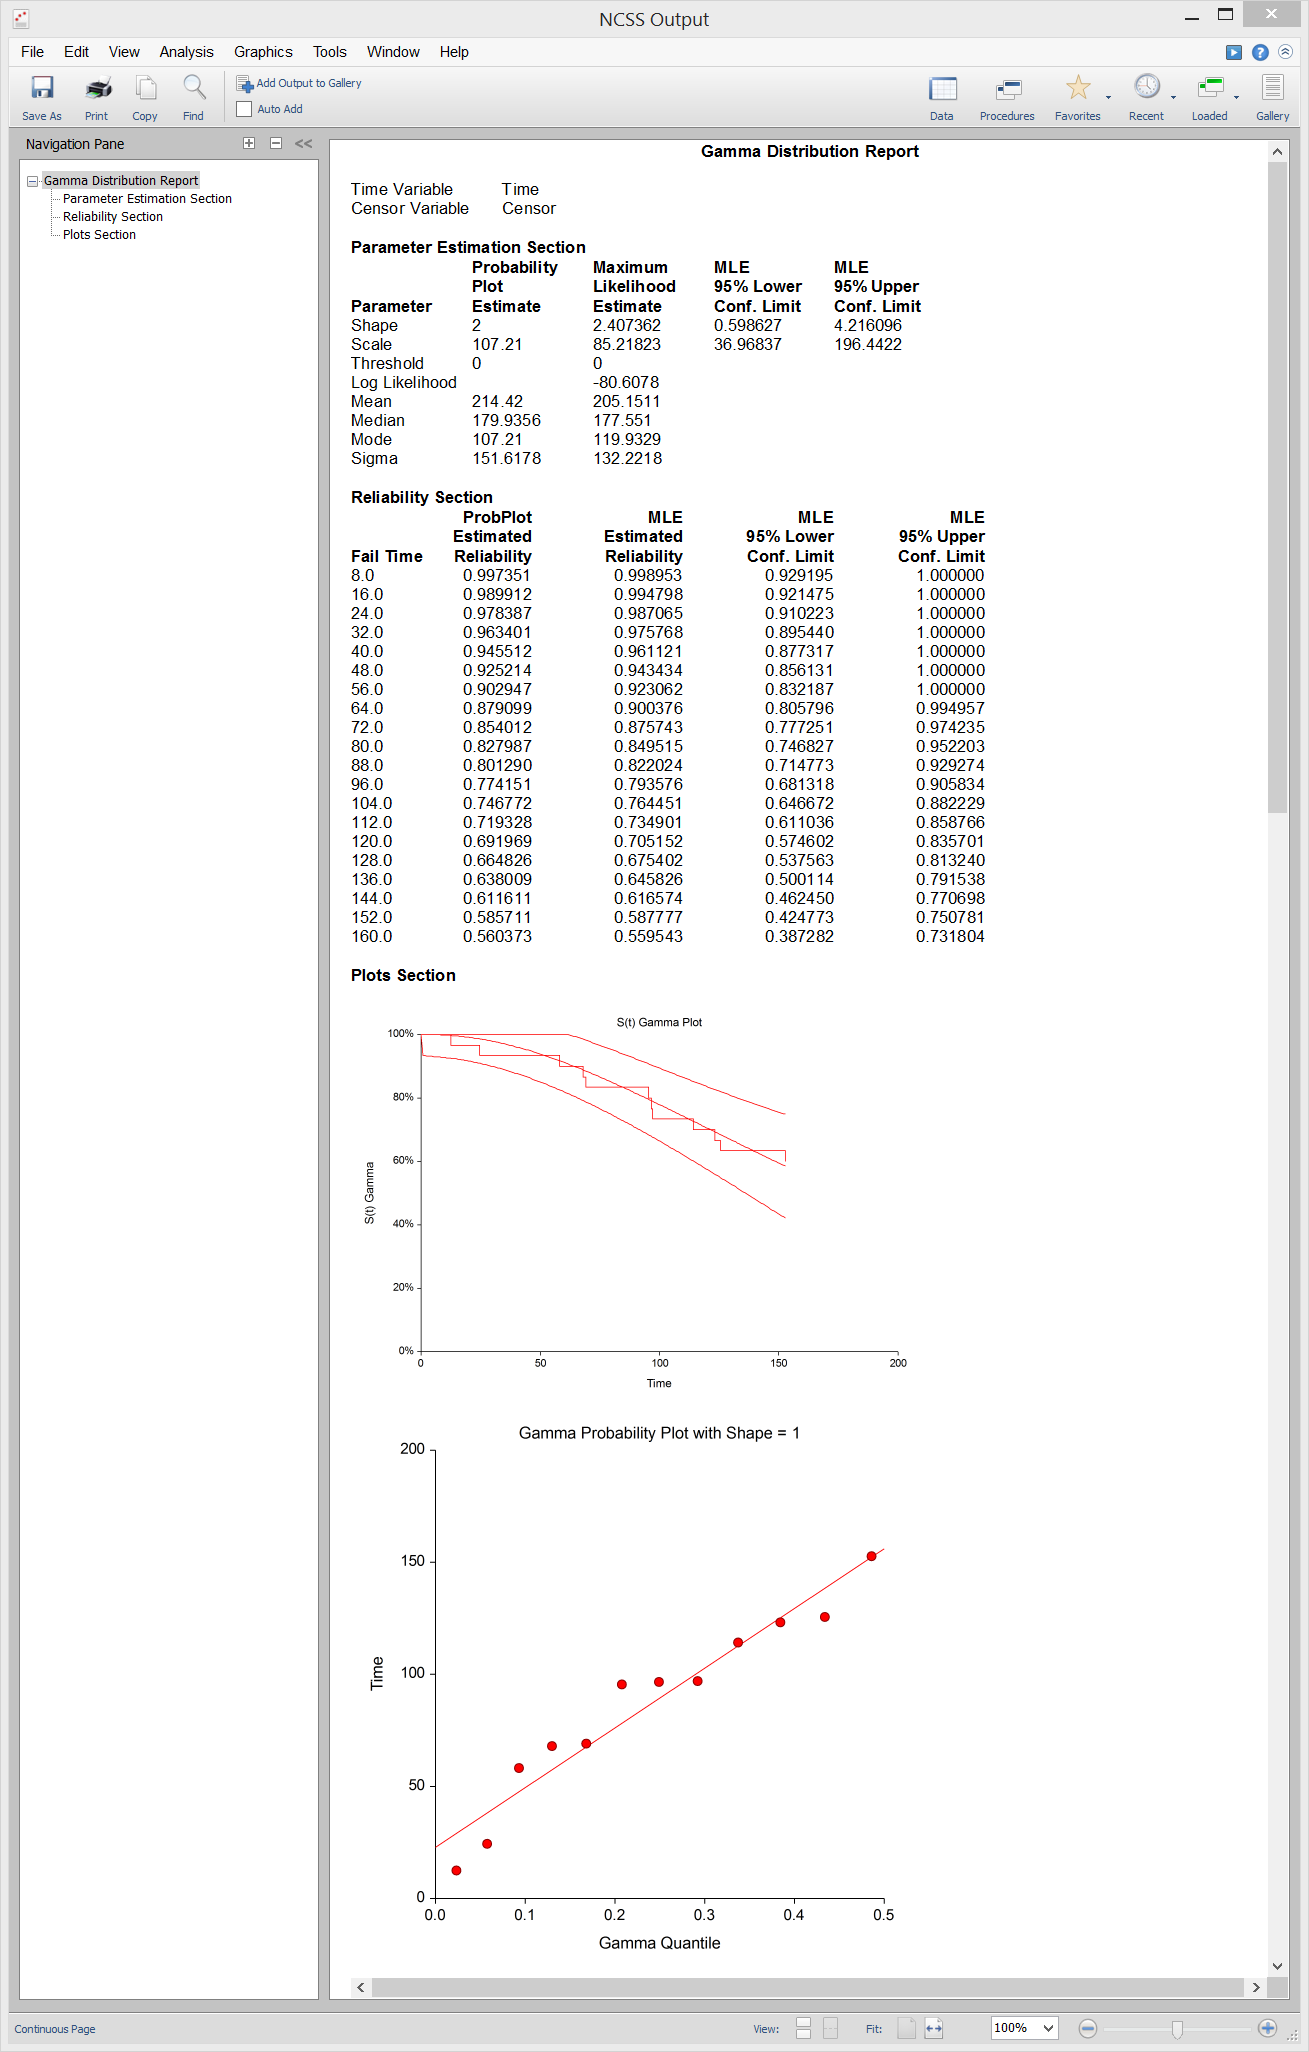
[Documentation PDF]The Gamma Distribution Fitting procedure fits the gamma probability distributions to a complete or censored set of individual or grouped data values. It outputs various statistics and graphs that are useful in reliability and survival analysis. The gamma distribution competes with the Weibull distribution as a model for lifetime. Since it is more complicated to deal with mathematically, it has been used less. While the Weibull is a purely heuristic model (approximating the data well), the gamma distribution does arise as a physical model since the sum of exponential random variables results in a gamma random variable. At times, you may find that the distribution of log lifetime follows the gamma distribution.
Sample Output
Grubbs' Outlier Test
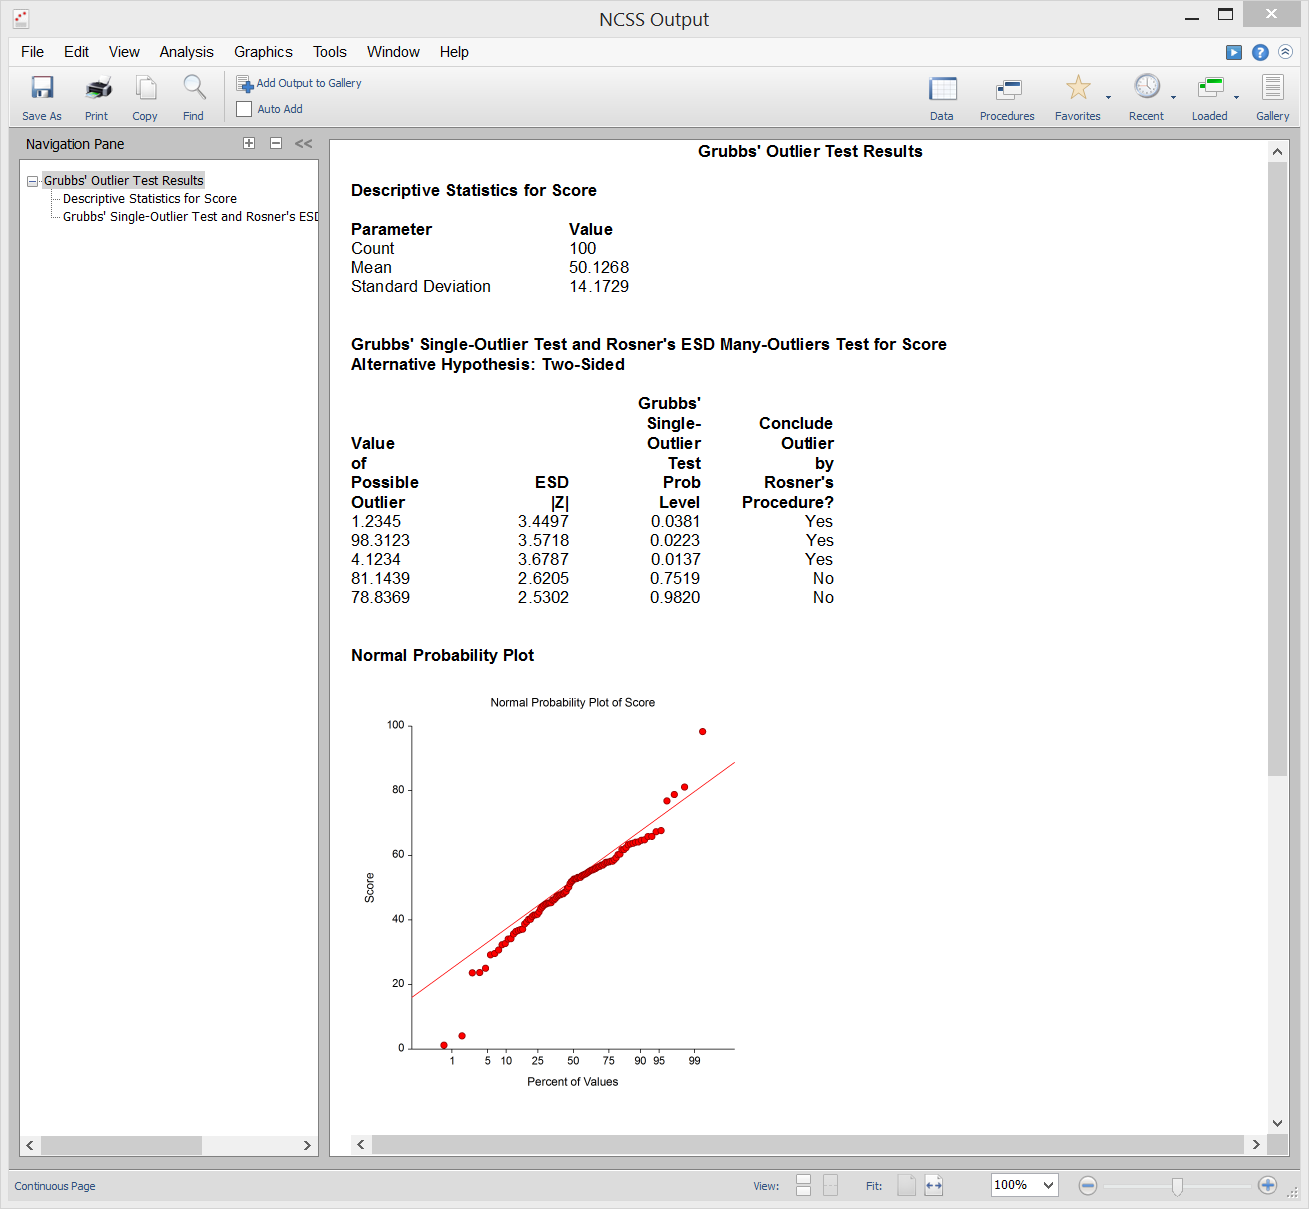
[Documentation PDF]The Grubbs' Outlier Test procedure in NCSS computes Grubbs’ test (1950) for detecting outliers in normal populations. It is well known that outliers (or extreme points) often distort the results of an analysis. Because of this, every analysis should begin with either a graphical or statistical check about the possibility of outliers. This procedure also computes Rosner’s (2011) test for many outliers. We also recommend Barnett and Lewis (1994) for many more outlier tests.
Sample Output
Normality Tests
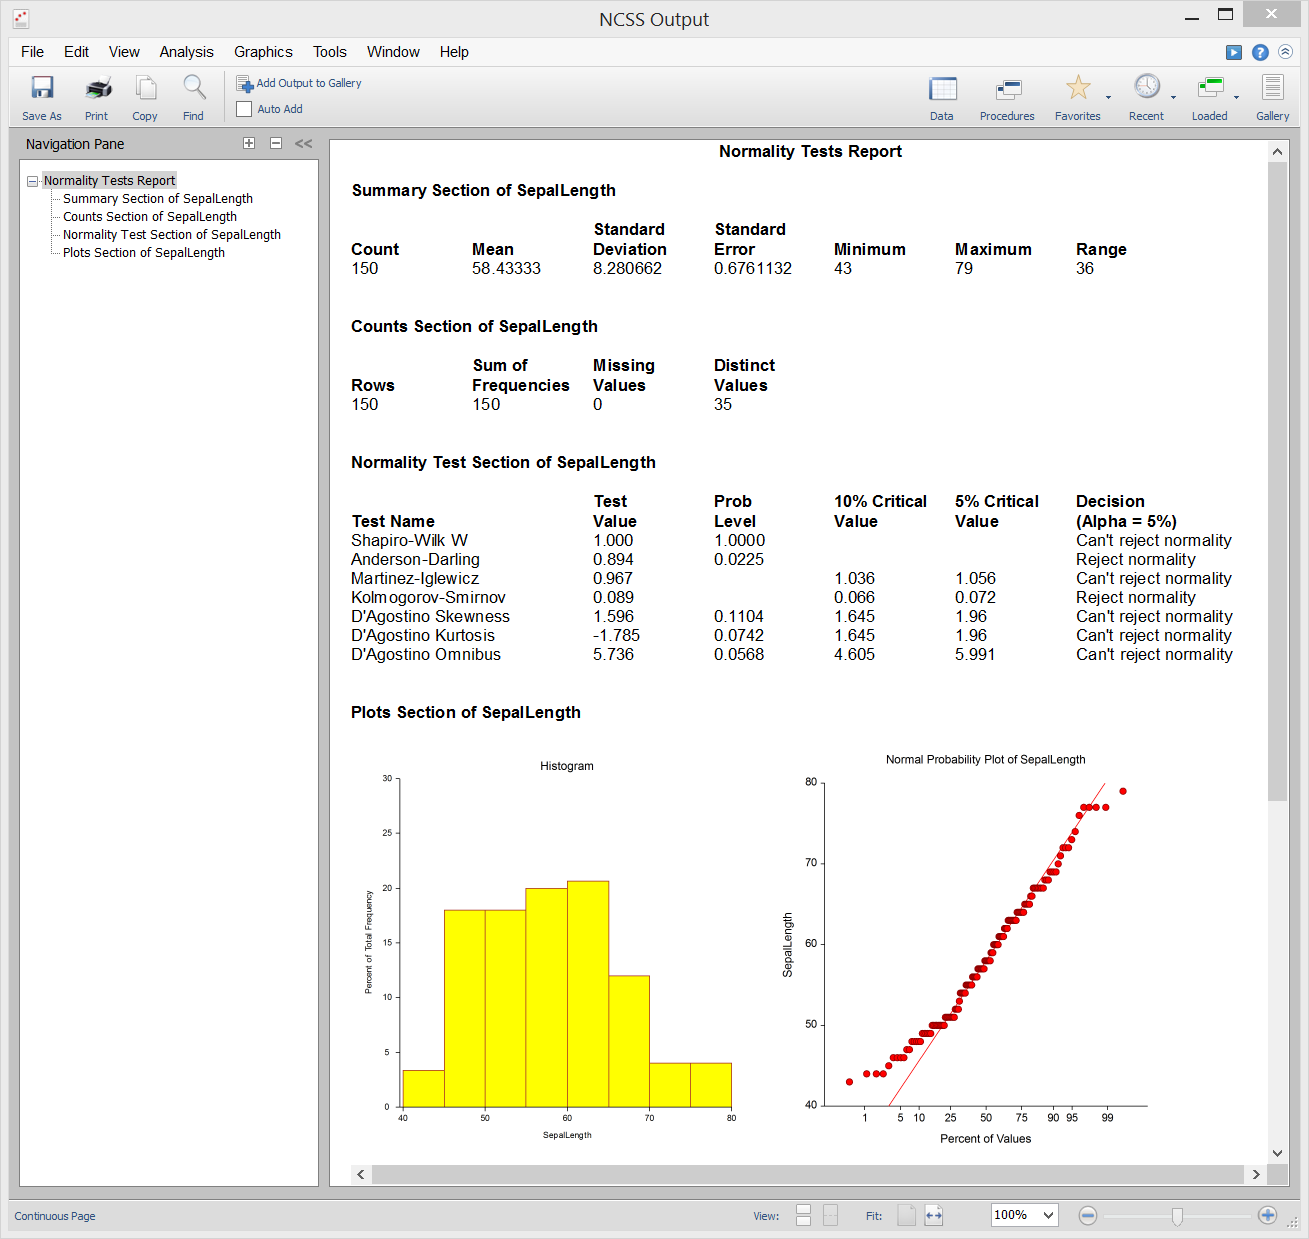
[Documentation PDF]The Normality Tests procedure in NCSS provides seven different tests of data normality:
- 1. Shapiro-Wilk W Test
- 2. Anderson-Darling Test
- 3. Martinez-Iglewicz Test
- 4. Kolmogorov-Smirnov Test
- 5. D’Agostino Skewness Test
- 6. D’Agostino Kurtosis Test
- 7. D’Agostino Omnibus Test
Sample Output
Probability Plots
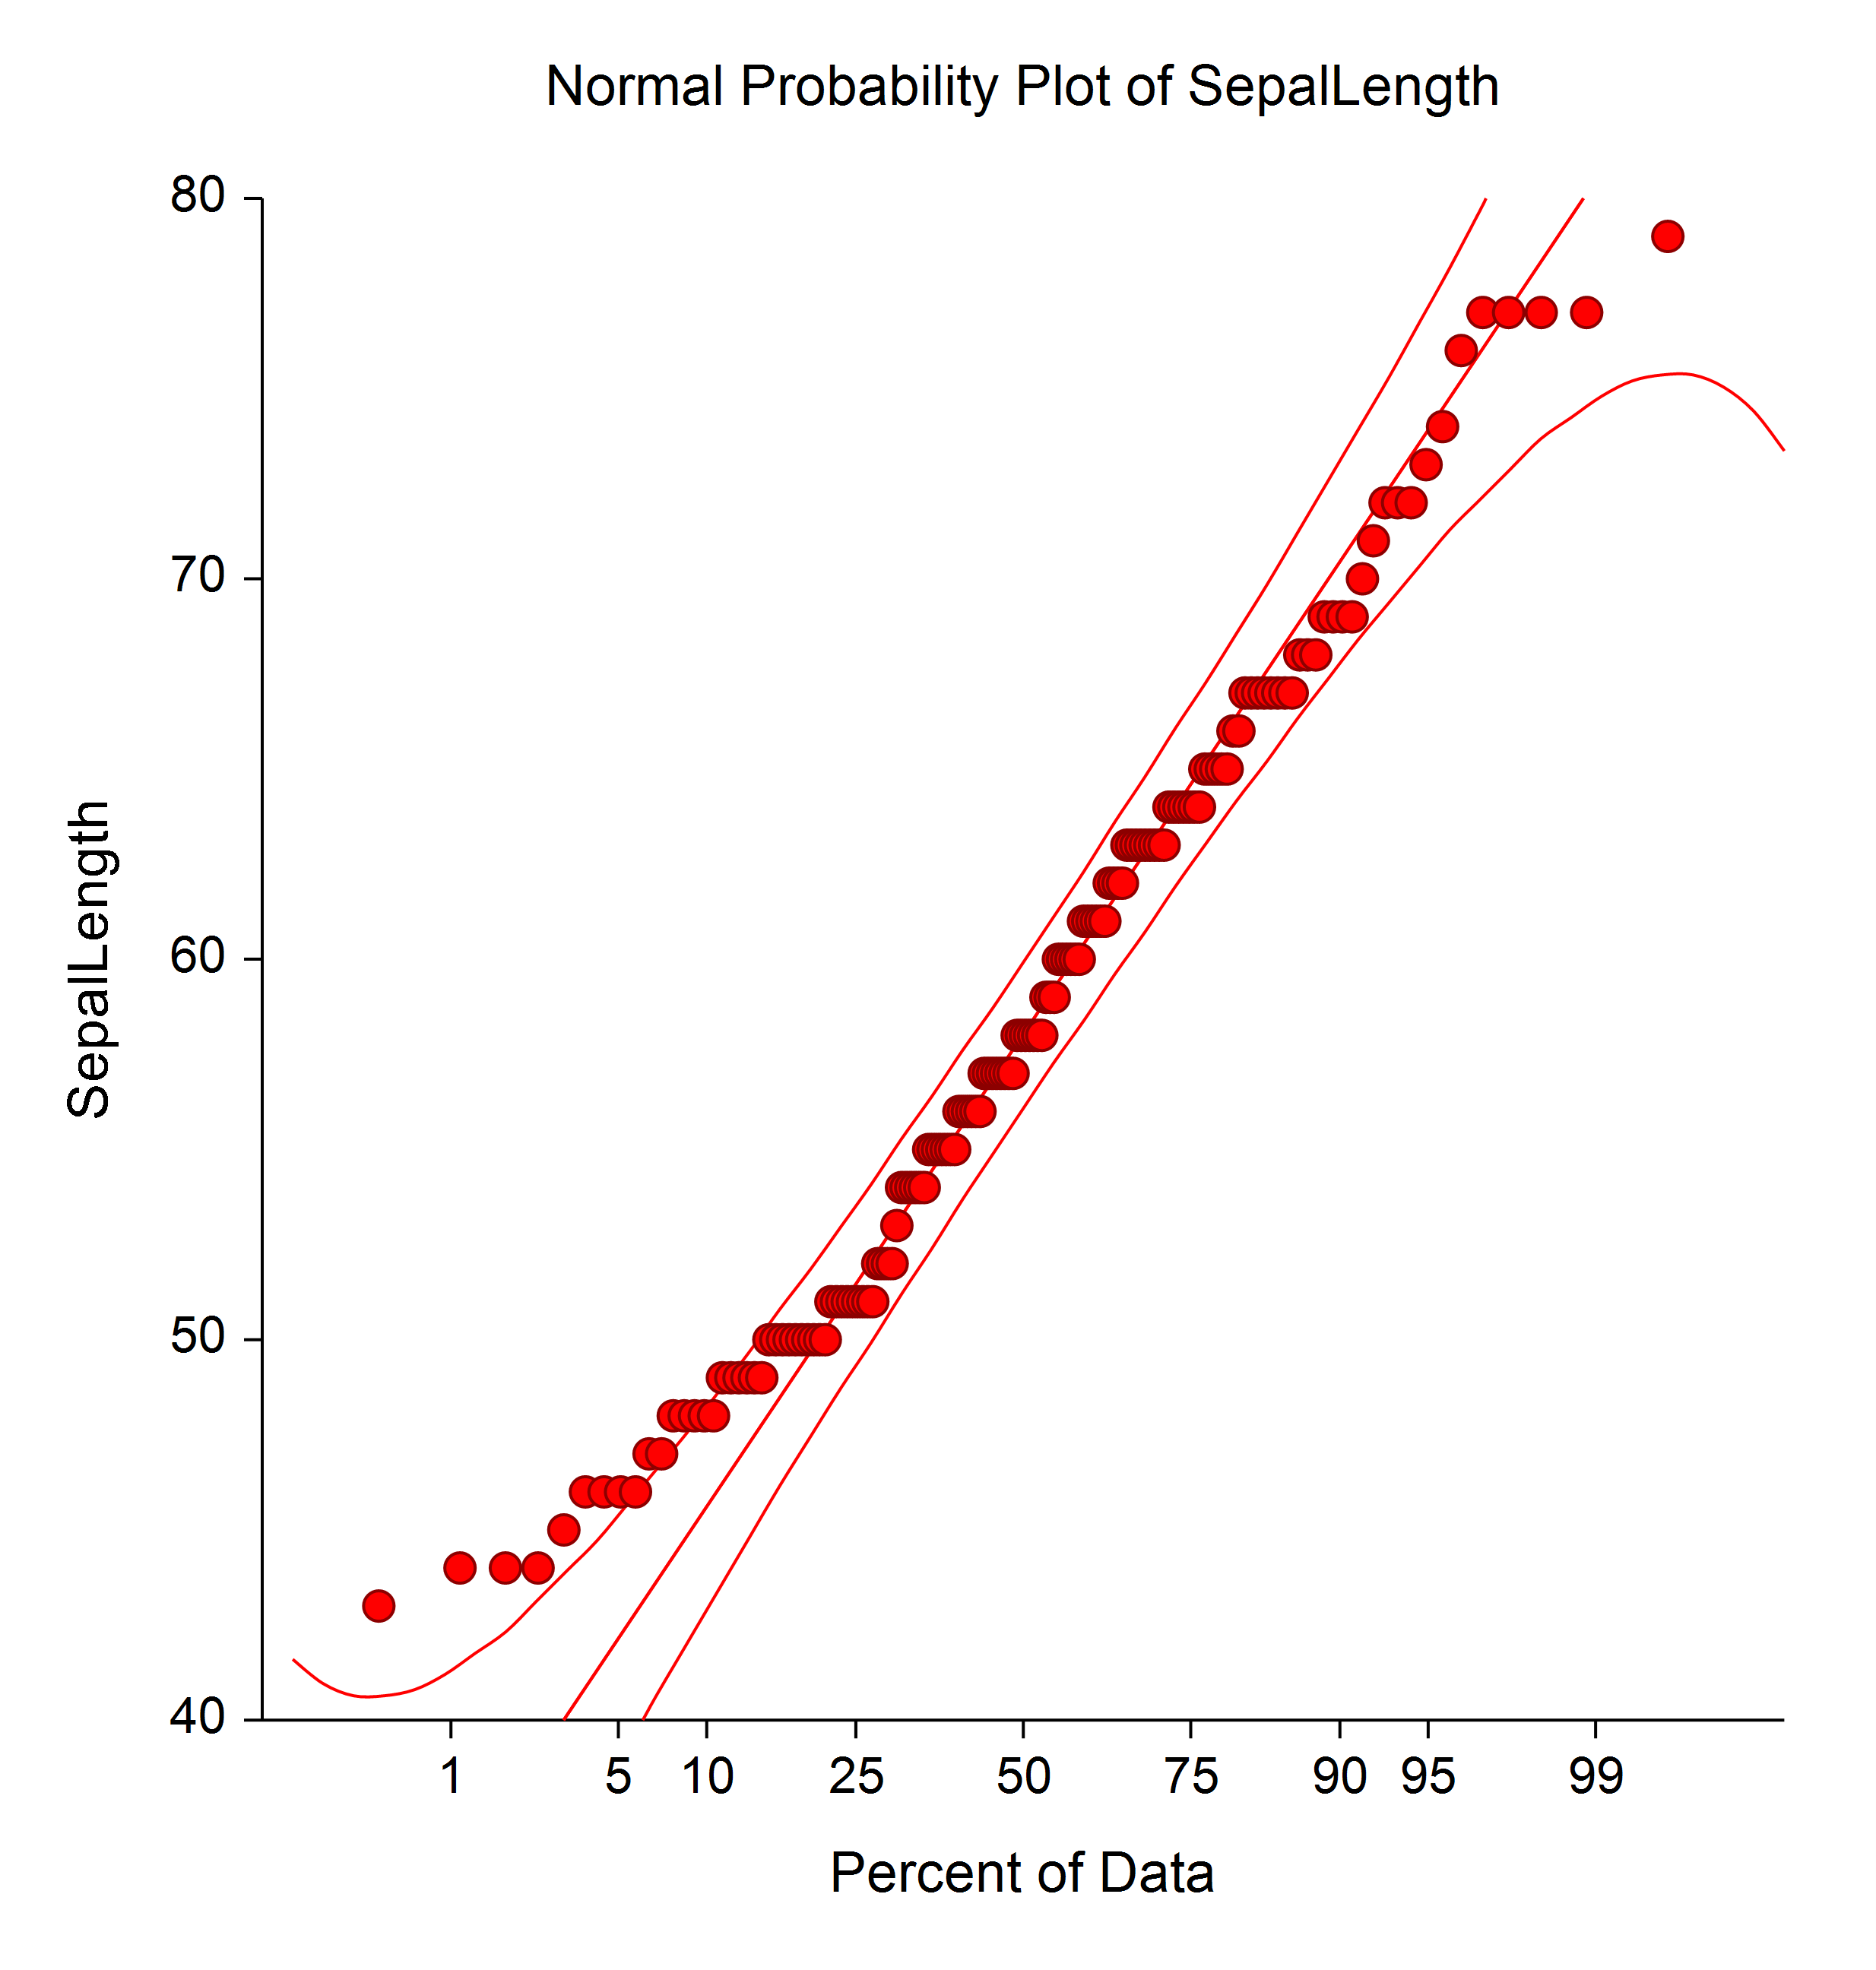
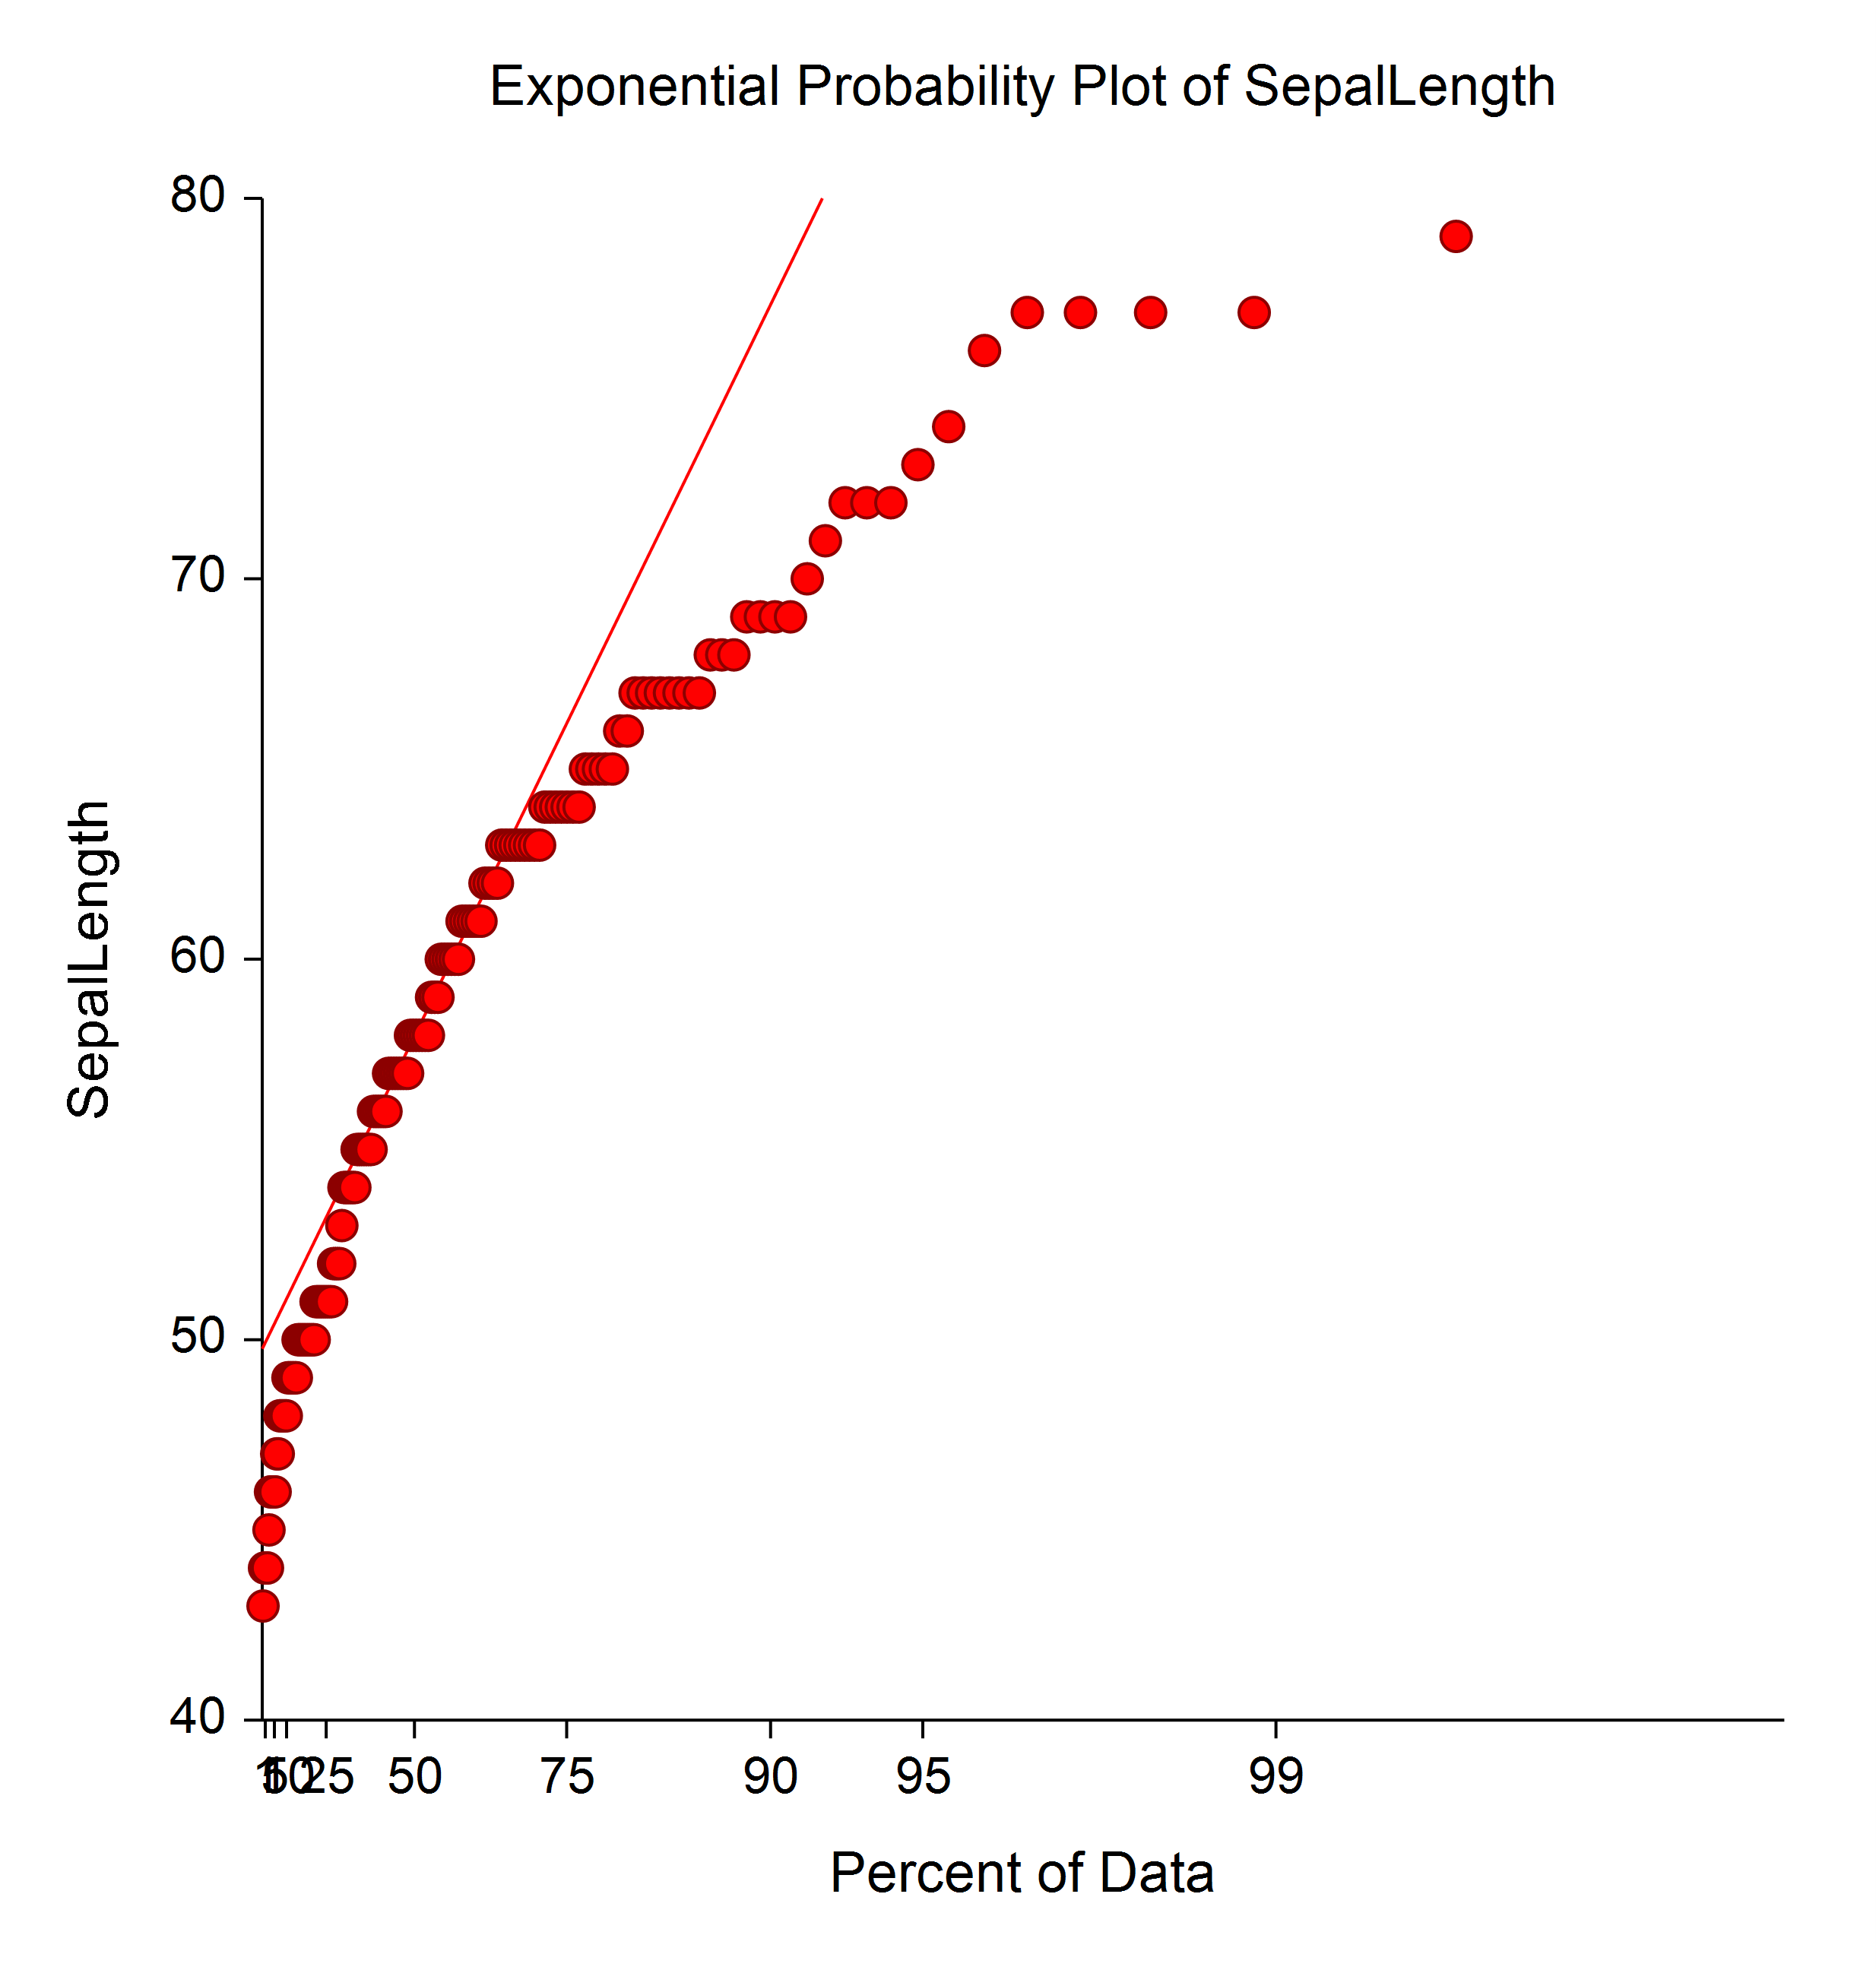
[Documentation PDF]Probability plots are used to determine visually how closely the data follow the probability distribution of interest. If the points in the probability plot all fall along a relatively straight line, you can assume that the data follow that probability distribution, or, at least, that the actual distribution is well approximated by the distribution in the plot. NCSS constructs probability plots for 8 different probability distributions:
- 1. Normal
- 2. Weibull
- 3. Chi-Square
- 4. Exponential
- 5. Gamma
- 6. Half-Normal
- 7. Log-Normal
- 8. Uniform
Sample Probability Plots Made with NCSS
