Meta-Analysis in NCSS
NCSS includes tools for performing meta-analysis of means, proportions, correlated proportions, and hazard ratios. The meta-analysis procedures in NCSS are easy-to-use and validated for accuracy. Use the links below to jump to the meta-analysis topic you would like to examine. To see how these tools can benefit you, we recommend you download and install the free trial of NCSS. Jump to:- Introduction
- Technical Details
- Meta-Analysis of Means
- Meta-Analysis of Proportions
- Meta-Analysis of Correlated Proportions
- Meta-Analysis of Hazard Ratios
Introduction
Meta-Analysis refers to methods for the systematic review of a set of individual studies with the aim to combine their results. A meta-analysis systematically reviews all pertinent evidence, provides quantitative summaries, integrates results across studies, and provides an overall interpretation of these studies. Meta-analysis has become popular for a number of reasons:- 1. The adoption of evidence-based medicine which requires that all reliable information is considered.
- 2. The desire to avoid narrative reviews which are often misleading.
- 3. The desire to interpret the large number of studies that may have been conducted about a specific treatment.
- 4. The desire to increase the statistical power of the results be combining many small-size studies.
- 1. Forest Plot
- 2. Radial Plot
- 3. L’Abbe Plot
Forest Plot
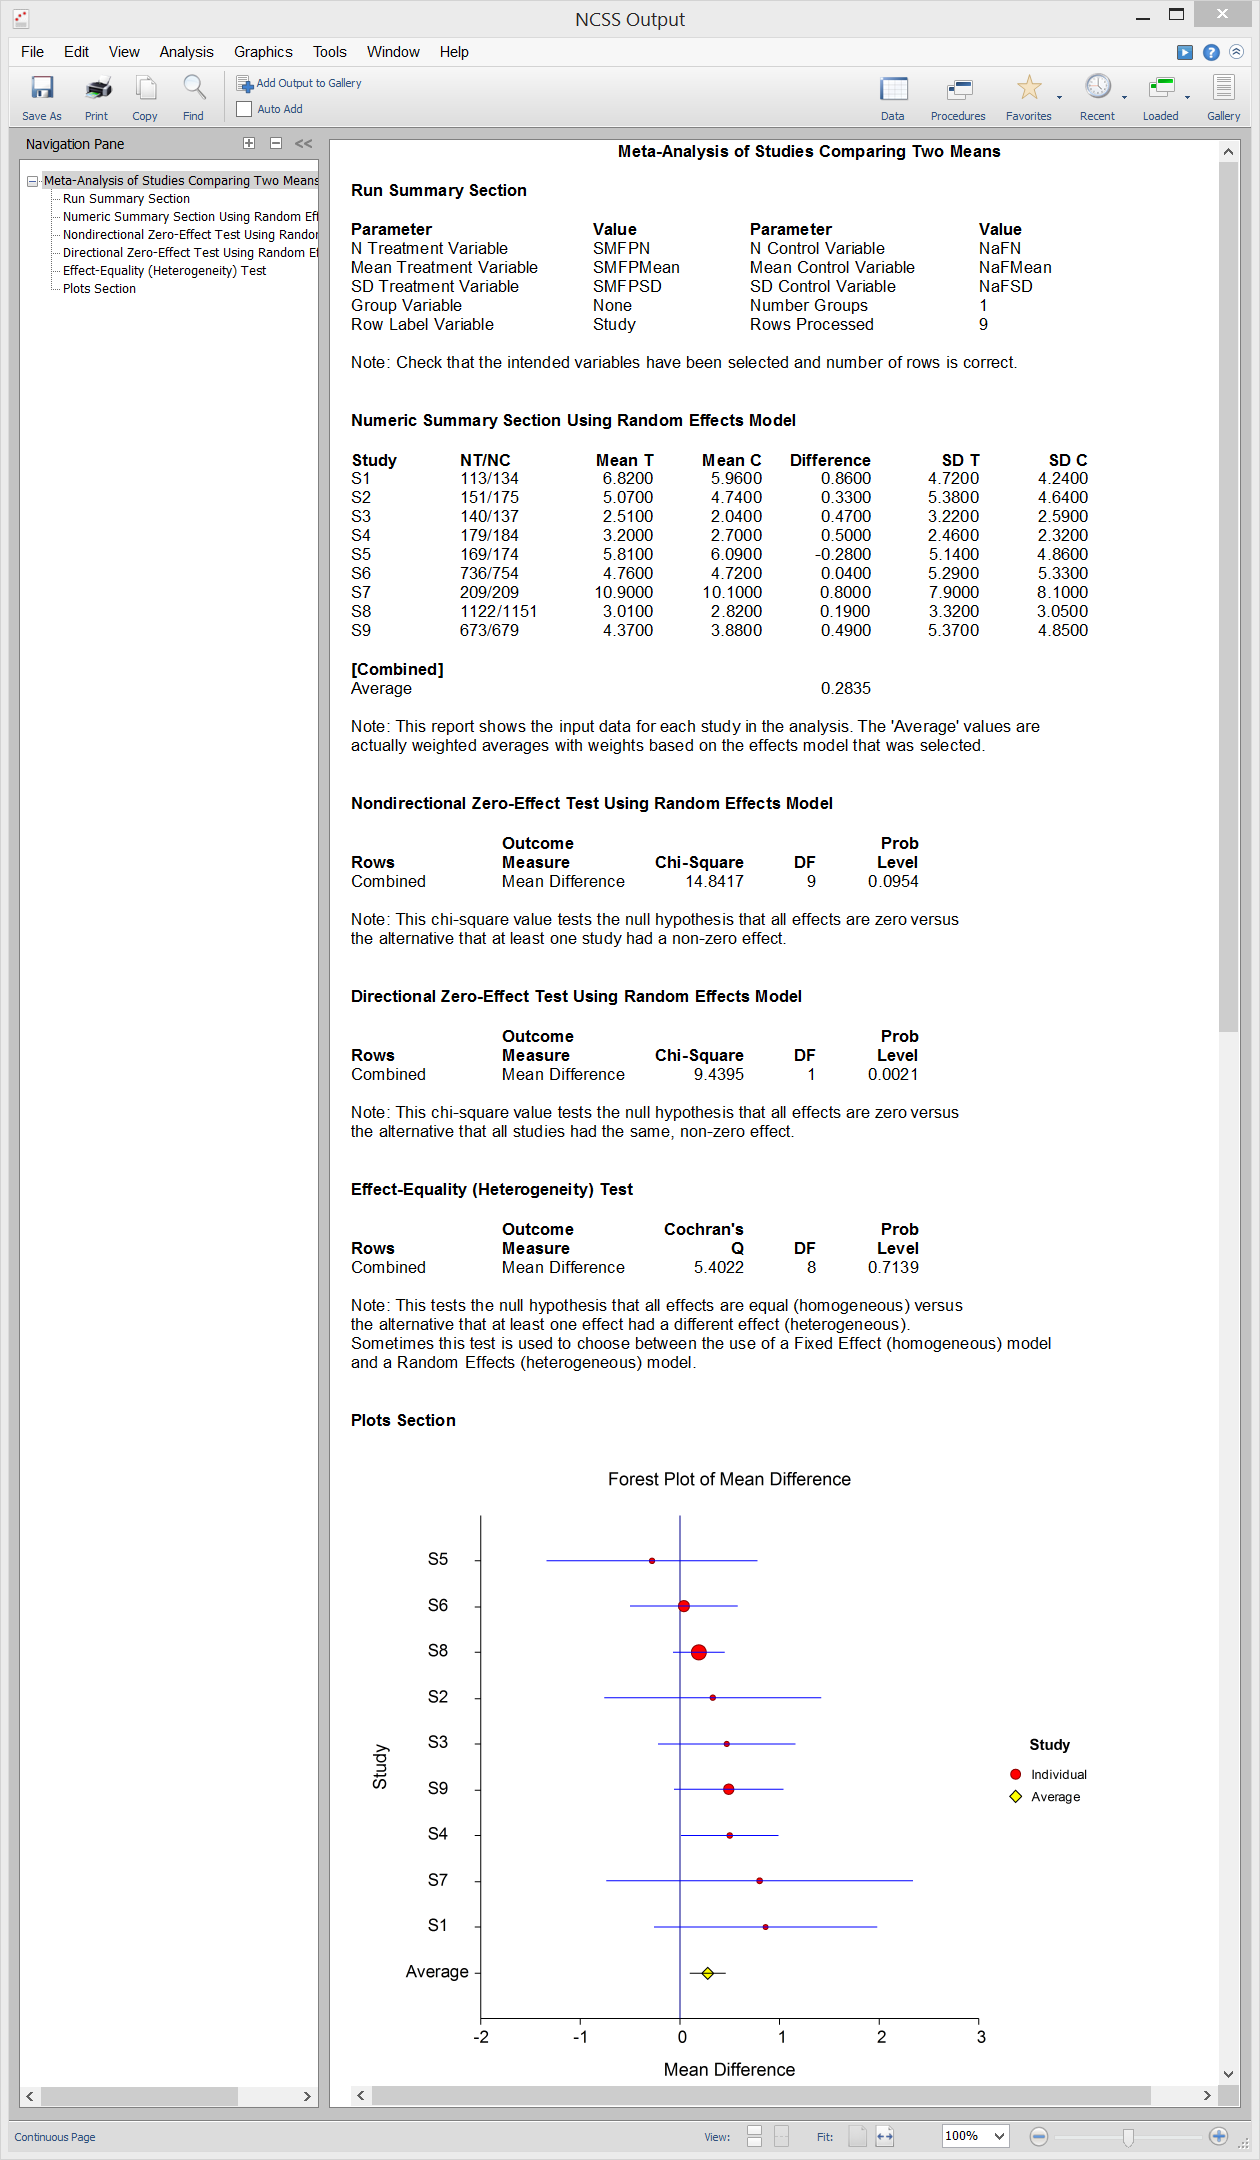
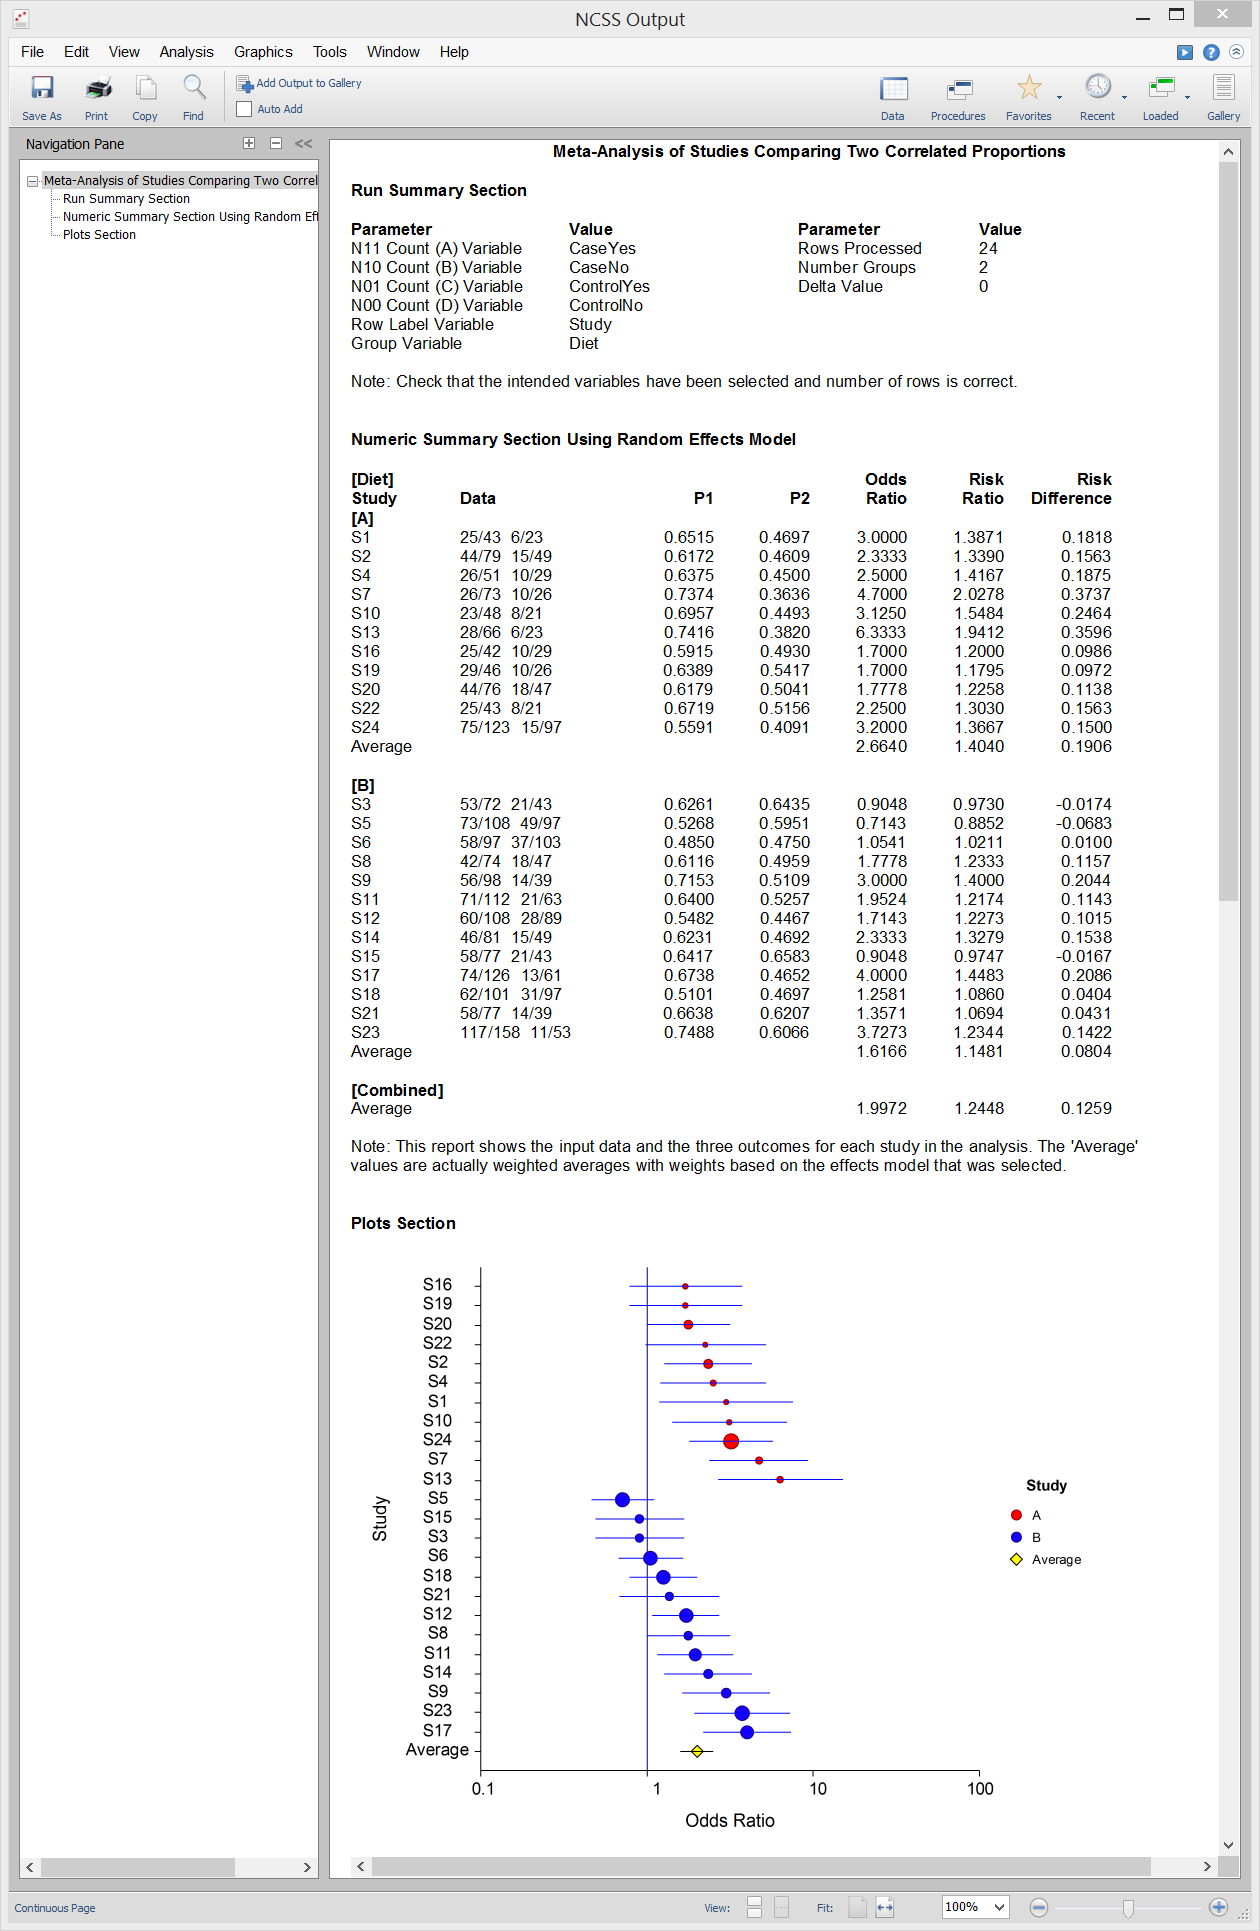
The Forest Plot presents the results for all of the studies on a single plot. The size of the plot symbol is proportional to the sample size of the study. The points on the plot are sorted by the mean difference. A point representing the average of all the studies is also presented. The lines represent the confidence intervals about the mean differences. Note that the narrower the confidence limits, the better. By studying this plot, you can determine the main conclusions that can be drawn from the set of studies. For example, you can determine how many studies were significant (i.e. when the confidence limits do not intersect the vertical line at 0).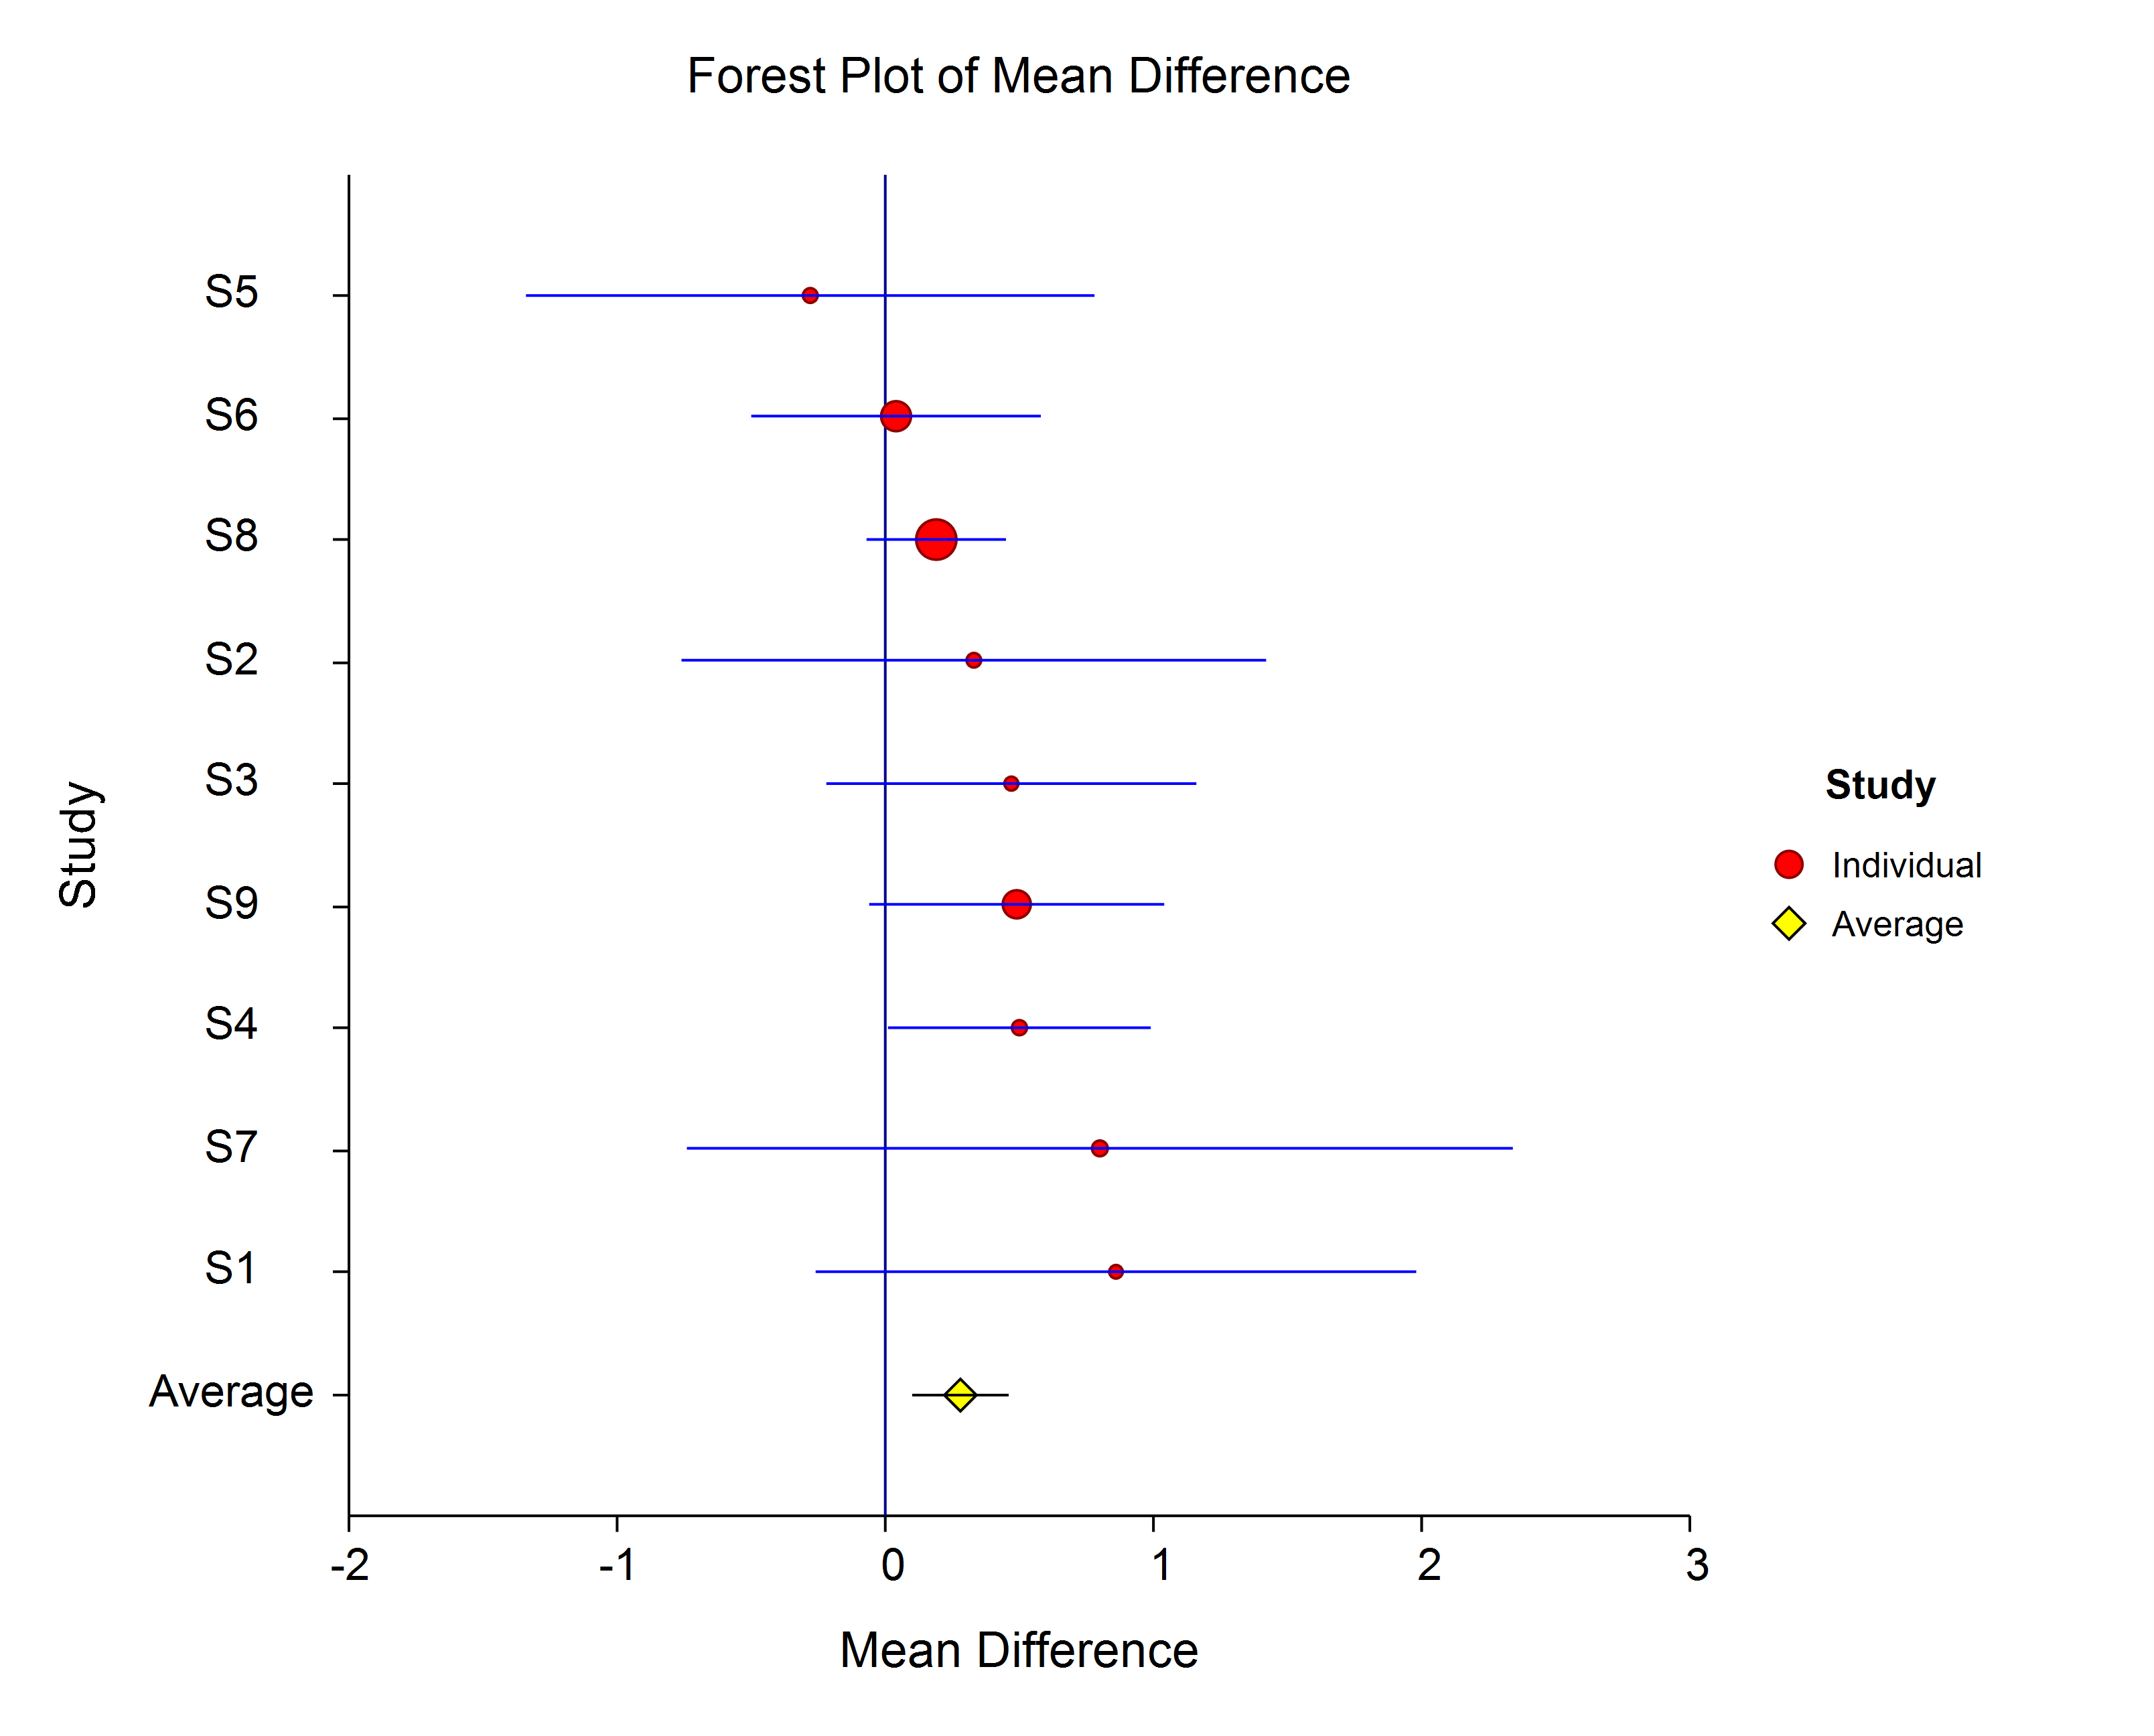
Radial Plot
The Radial (or Galbraith) Plot shows the z-statistic (outcome divided by standard error) on the vertical axis and a measure of weight on the horizontal axis. Studies that have the largest weight are closest to the Y axis. Studies within the limits are interpreted as homogeneous. Studies outside the limits may be outliers.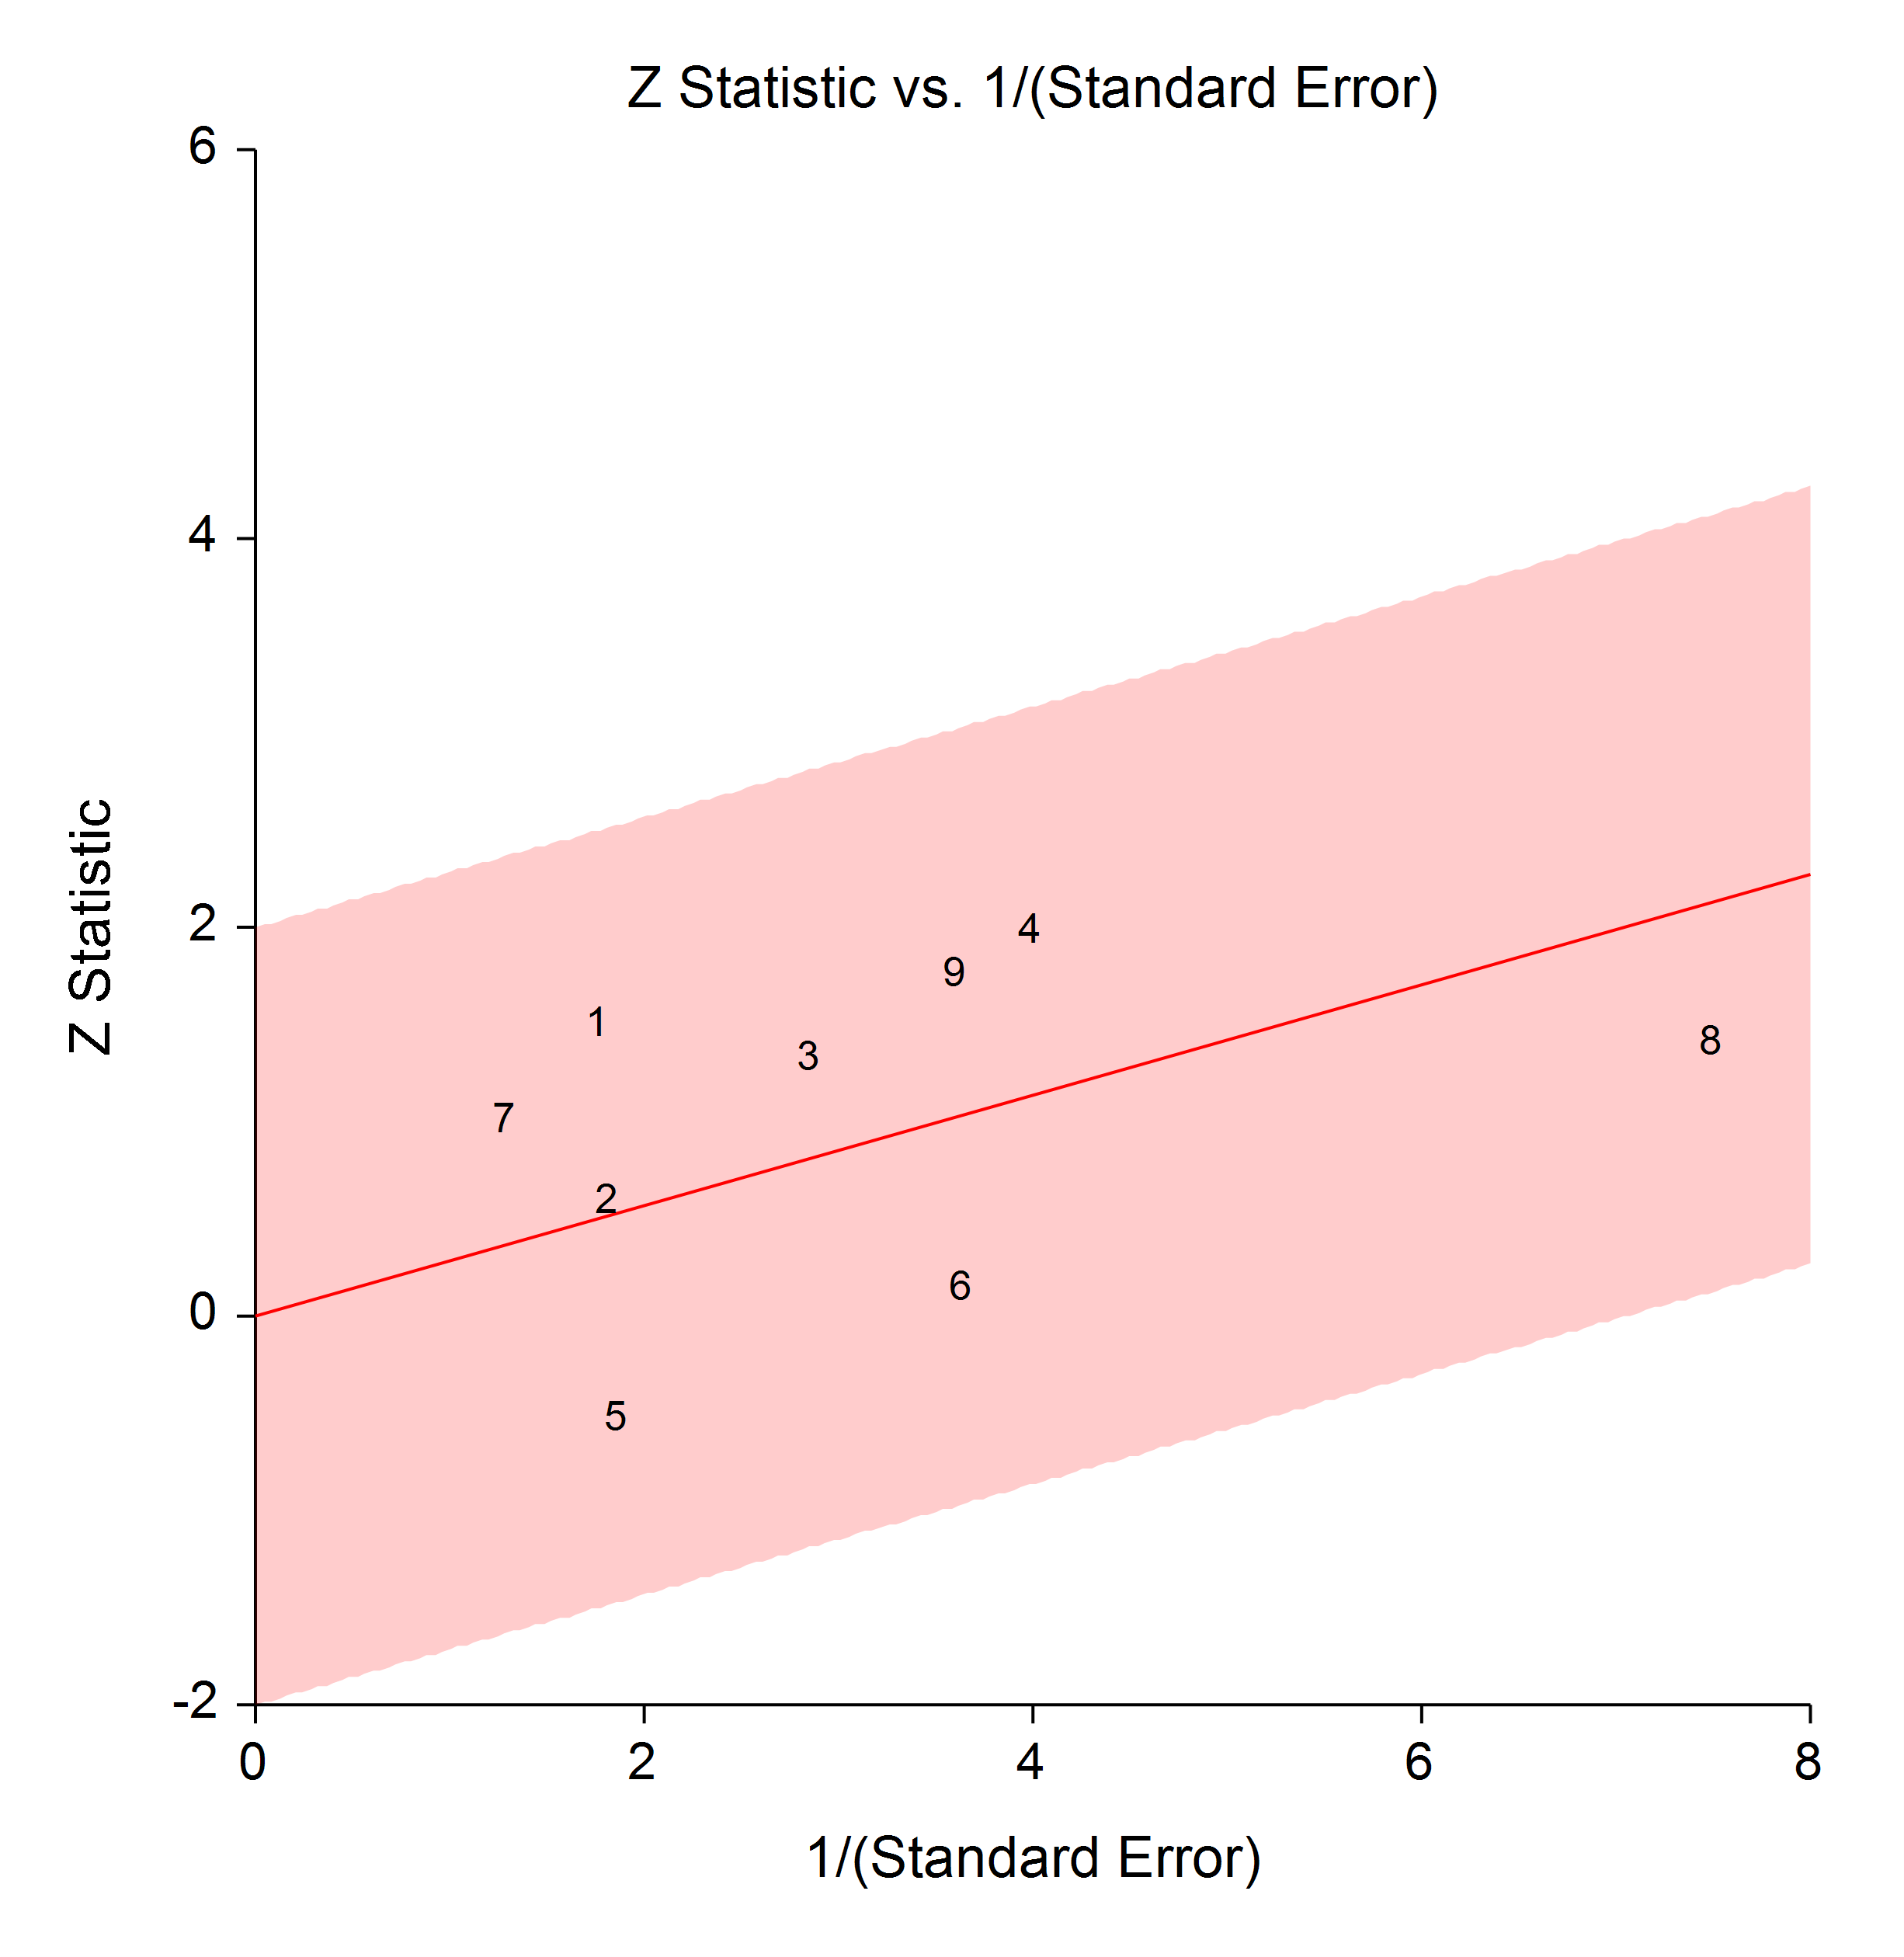
L’Abbe Plot
The L’Abbe Plot displays the treatment mean on vertical axis versus the control mean on the horizontal axis. Homogenous studies will be arranged along the diagonal line. This plot is especially useful in determining if the relationship between the treatment group and the control group is the same for all values of the control group risk.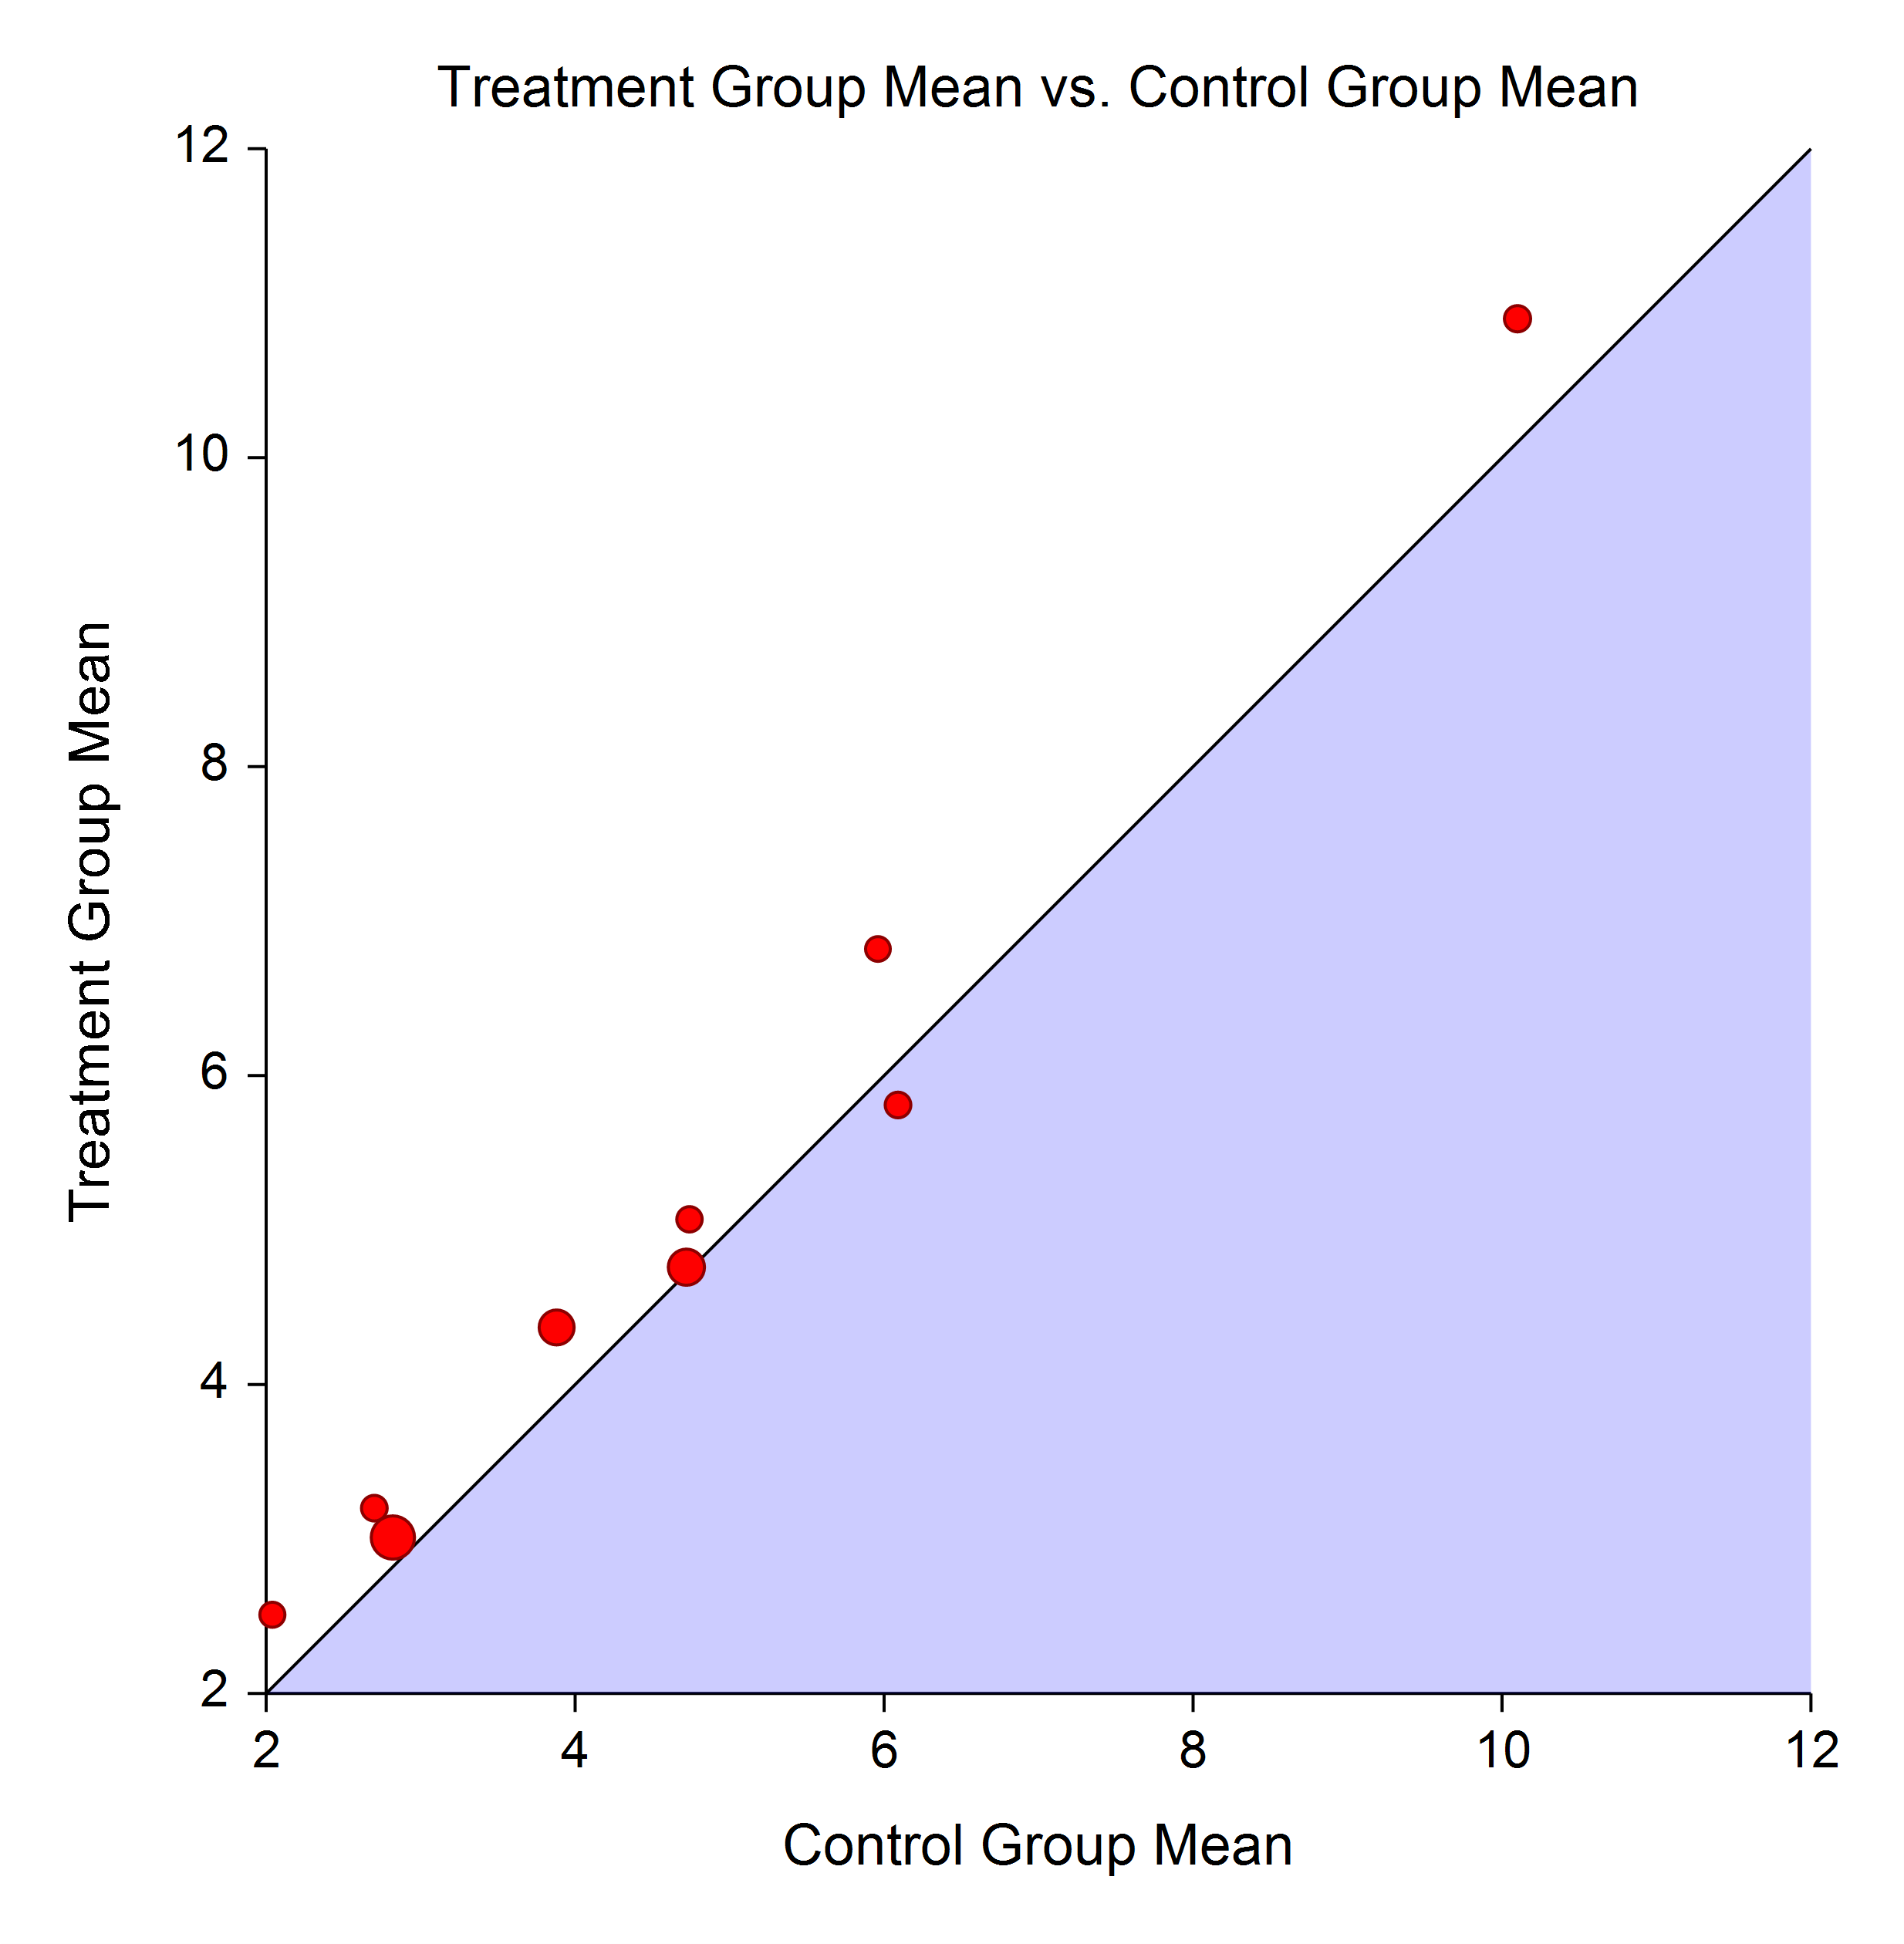
Technical Details
This page is designed to give a general overview of the capabilities of NCSS for meta-analysis. If you would like to examine the formulas and technical details relating to a specific NCSS procedure, click on the corresponding '[Documentation PDF]' link under each heading to load the complete procedure documentation. There you will find formulas, references, discussions, and examples or tutorials describing the procedure in detail.Meta-Analysis of Means
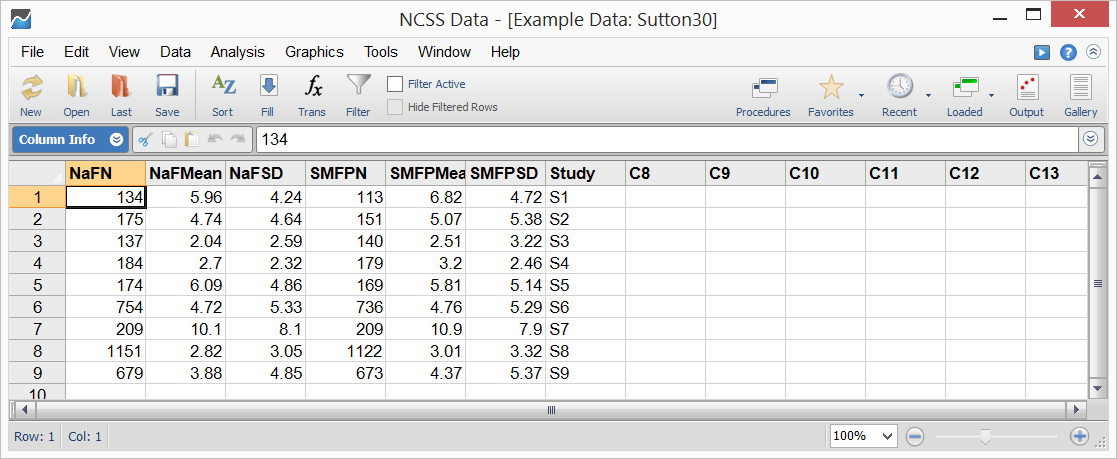
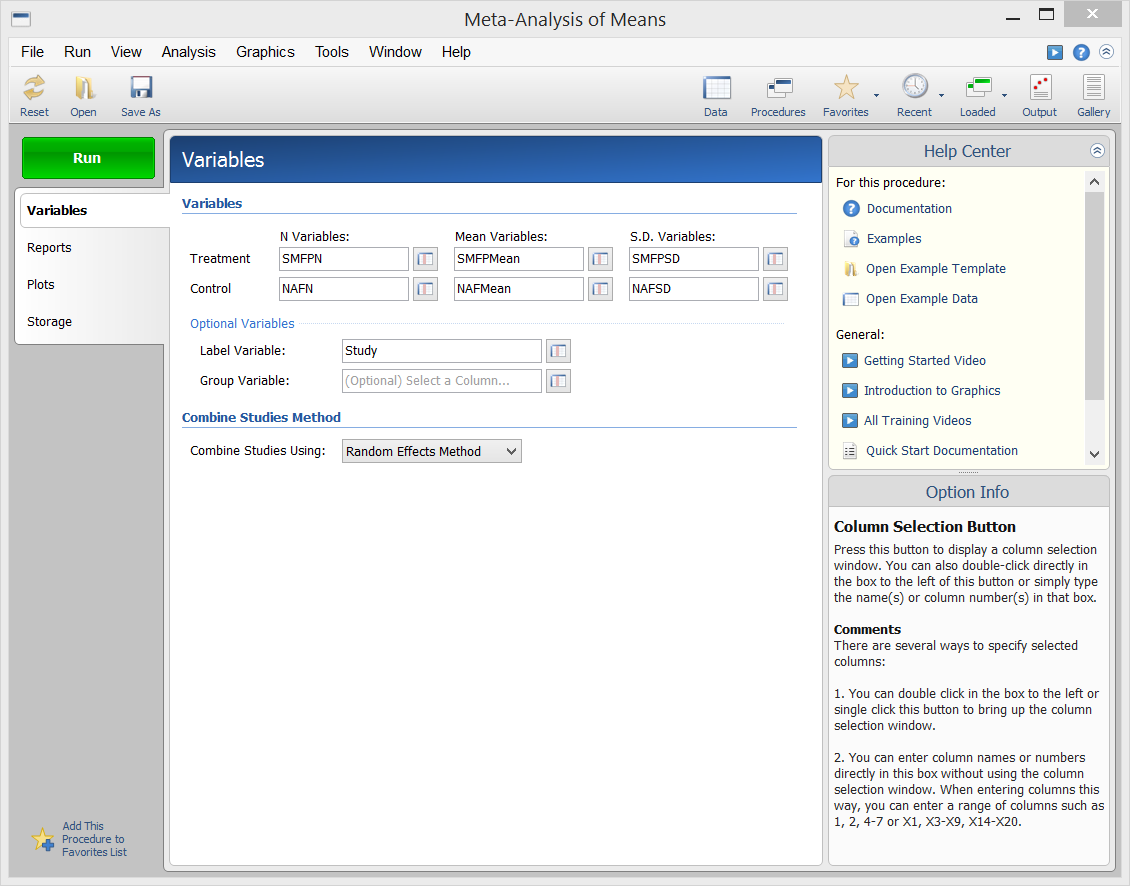
[Documentation PDF]The Meta-Analysis of Means procedure in NCSS performs a meta-analysis on a set of two-group, continuous-scale studies. These studies are assumed to have a treatment group and a control group. Each study’s result may be summarized by the sample size, mean, and standard deviation for each of the two groups. The program provides a complete set of numeric reports and plots to allow the investigation and presentation of the studies. The procedure computes both directional and non-directional tests for the overall null hypothesis that all treatment effects are zero and computes the Effect-Equality (Heterogeneity) Test using Cochran’s Q Test. Both fixed-effects and random-effects models are available for analysis.
Sample Data
Procedure Input
Sample Output
Meta-Analysis of Proportions
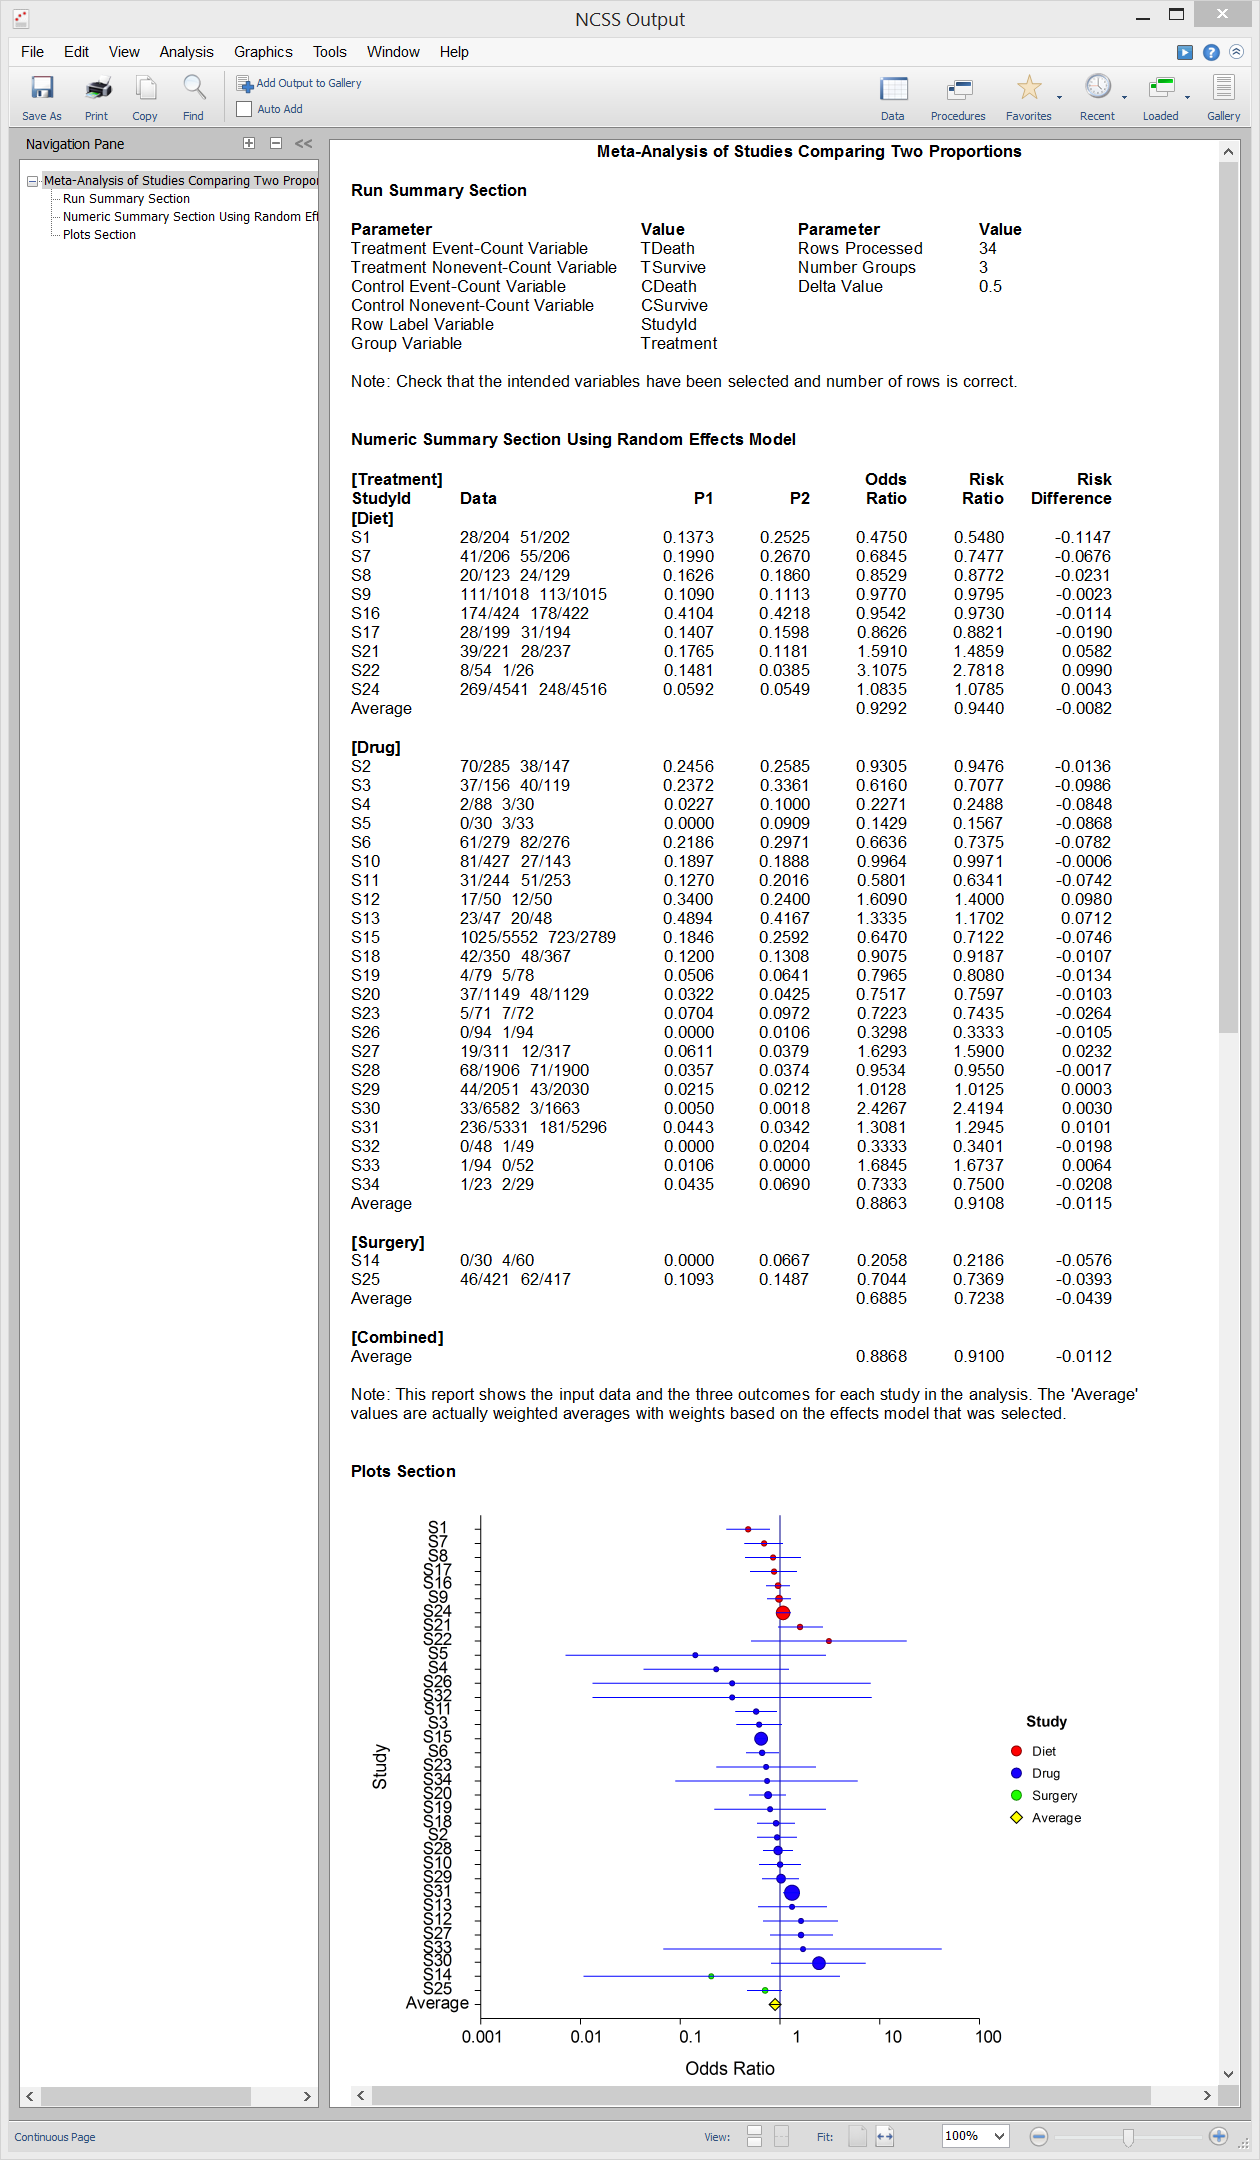
[Documentation PDF]The Meta-Analysis of Proportions procedure in NCSS performs a meta-analysis on a set of two-group, binary-event studies. These studies are assumed to have a treatment group and a control group. The results of each study may be summarized as counts in a 2-by-2 table. The program provides a complete set of numeric reports and plots to allow the investigation and presentation of the studies. The procedure computes both directional and non-directional tests for the overall null hypothesis that all treatment effects are zero and computes the Effect-Equality (Heterogeneity) Test using Cochran’s Q Test. Both fixed-effects and random-effects models are available for analysis.
Sample Output
Meta-Analysis of Correlated Proportions
[Documentation PDF]The Meta-Analysis of Correlated Proportions procedure in NCSS performs a meta-analysis on a set of correlated, binary-event studies. These studies usually come from a design in which two dichotomous responses are made on each subject (or subject pair). The results of each study may be summarized as counts in a 2-by-2 table. For example, suppose the binary response is recorded after treatment A and again after treatment B. The response is “1” if the event of interest occurs or “0” otherwise. This analysis also applies to matched-pairs data in which each case subject is matched with a similar subject from a control group. The procedure provides a complete set of numeric reports and plots to allow the investigation and presentation of the studies. The procedure computes both directional and non-directional tests for the overall null hypothesis that all treatment effects are zero and computes the Effect-Equality (Heterogeneity) Test using Cochran’s Q Test. Both fixed-effects and random-effects models are available for analysis.
Sample Output
Meta-Analysis of Hazard Ratios
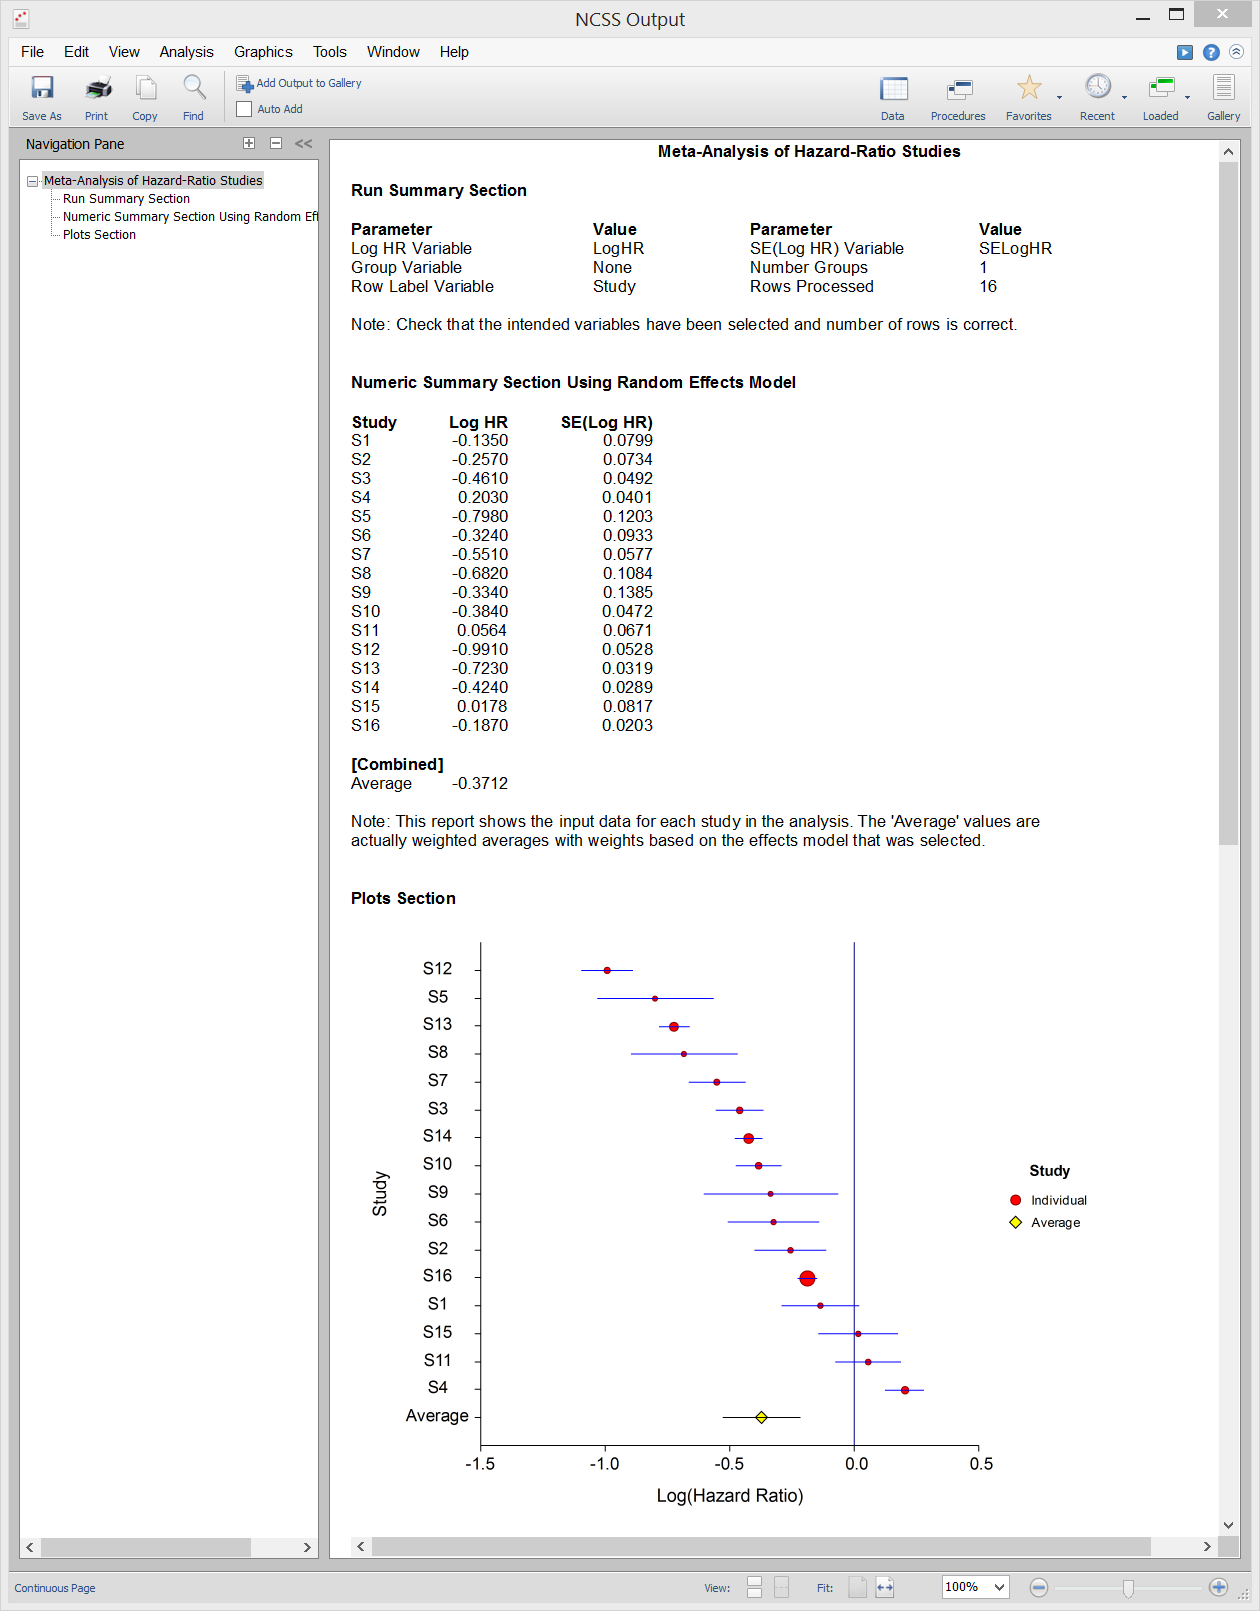
[Documentation PDF]The Meta-Analysis of Hazard Ratios procedure in NCSS performs a meta-analysis on a set of two-group, time to event (survival), studies in which some data may be censored. These studies are assumed to have a treatment group and a control group. The results of each study may be summarized by the log hazard ratio and its standard error. The program provides a complete set of numeric reports and plots to allow the investigation and presentation of the studies. The procedure computes both directional and non-directional tests for the overall null hypothesis that all treatment effects are zero and computes the Effect-Equality (Heterogeneity) Test using Cochran’s Q Test. Both fixed-effects and random-effects models are available for analysis.
Sample Output
