Nondetects Data Analysis in NCSS
NCSS includes easy-to-use tools for Nondetects Data Analysis, including procedures for the comparison of two groups and regression with nondetects data. These procedures, like all procedures in NCSS, are validated for accuracy and are based on published results. Use the links below to jump to the nondetects data analysis topic you would like to examine. To see how these tools can benefit you, we recommend you download and install the free trial of NCSS. Jump to:Introduction
Nondetects data analysis is the analysis of data in which one or more of the values cannot be measured exactly because they fall below one or more detection limits. Detection limits often arise in environmental studies because of the inability of instruments to measure small concentrations. Some examples of sampling scenarios that lead to datasets with nondetects values are finding pesticide concentrations in water, determining chemical composition of soils, or establishing the number of particulates of a compound in the air. A common practice for dealing with values that fall below the detection threshold is substitution. Often, each value that is below the detection limit is substituted with one half the detection limit. Summary statistics and comparisons are then carried out using standard techniques (e.g. means, confidence intervals, t-tests, ANOVA, multiple regression, etc.) with the substituted data. Helsel (2005) warns of the potential analysis biases that result if nondetects values are substituted. He particularly warns about the arbitrariness of substituting one half the detection limit (or zero, or the detection limit). Alternatively, techniques based on survival analysis methods have been developed for appropriate use of the information contained in the nondetected observations. In the case of group comparison, the general approach is to convert the nondetects data (left-censored) to survival data (right-censored), use the survival analysis techniques on the newly created survival data, and then convert the survival summaries back to original scale (In NCSS, these conversions are performed automatically). The resulting summary statistics and hypothesis tests are analogs to the common techniques, but which appropriately account for nondetected observations. For example, medians are used rather than means, EDF plots replace box plots and histograms, and logrank tests are used instead of two-sample t-tests and ANOVA. In the case of regression, if a proper distribution can be assumed for the variable with nondetects values, maximum likelihood distribution regression is a more appropriate analog to multiple regression with substituted values.Technical Details
This page is designed to give a general overview of the capabilities of NCSS for nondetects data analysis. If you would like to examine the formulas and technical details relating to a specific NCSS procedure, click on the corresponding '[Documentation PDF]' link under each heading to load the complete procedure documentation. There you will find formulas, references, discussions, and examples or tutorials describing the procedure in detail.Nondetects-Data Group Comparison
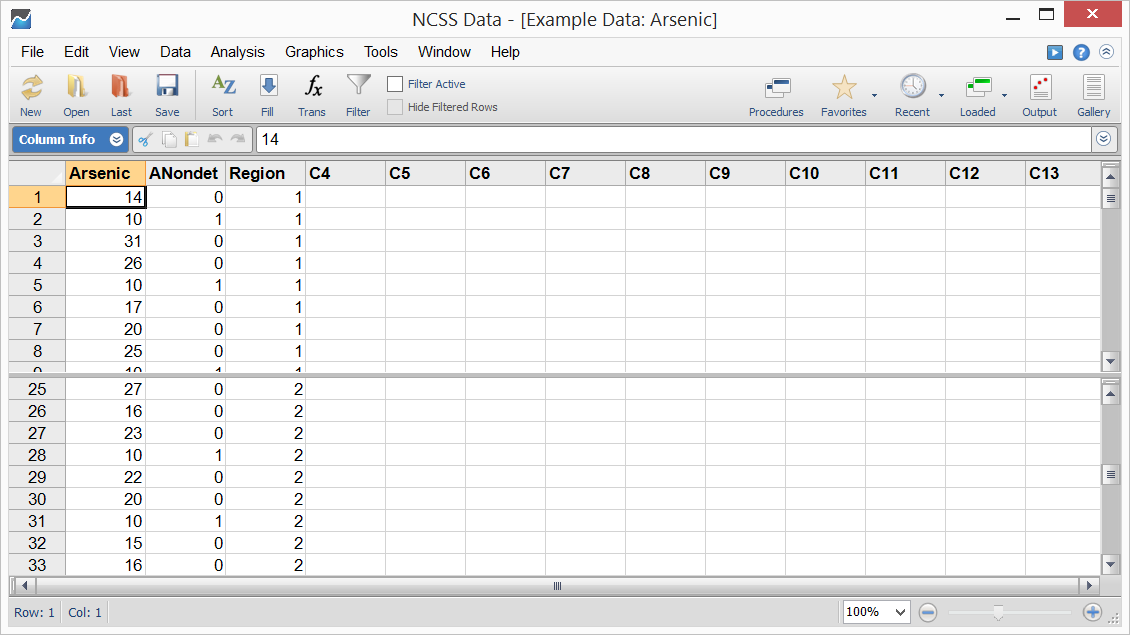
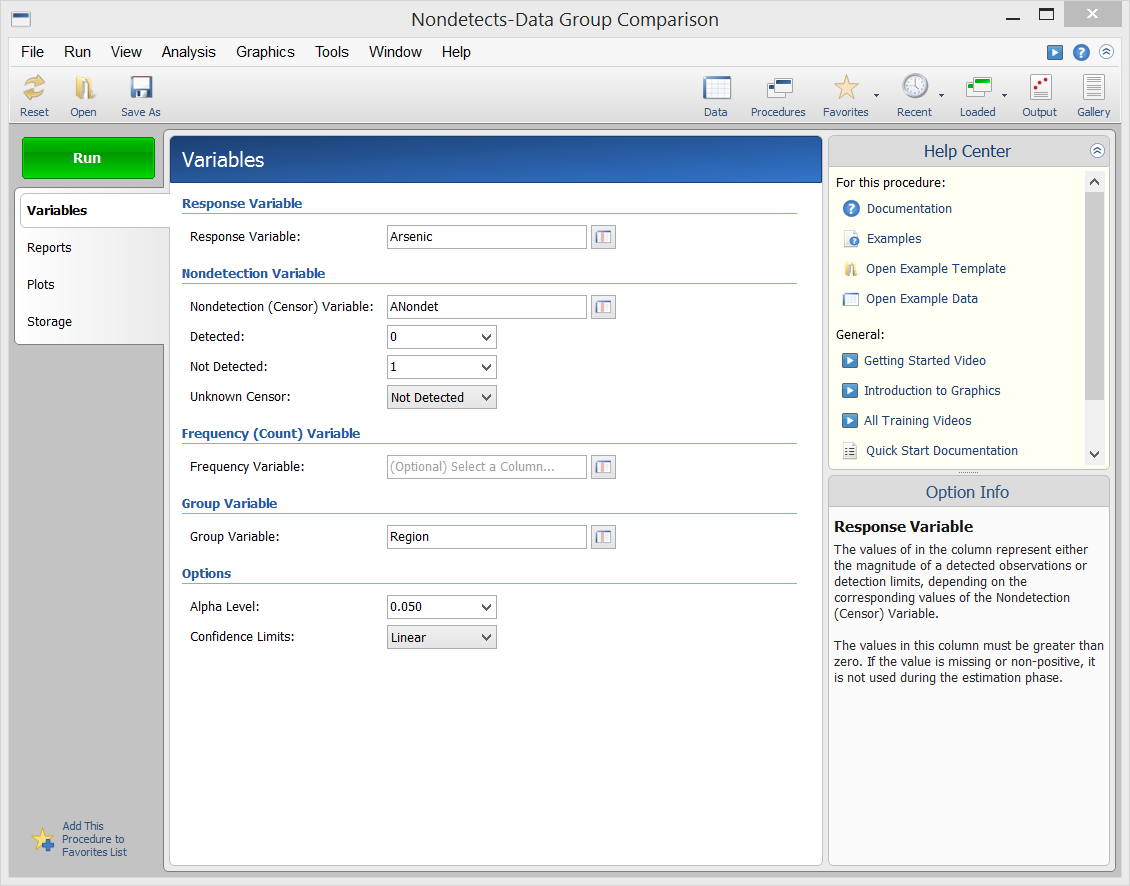
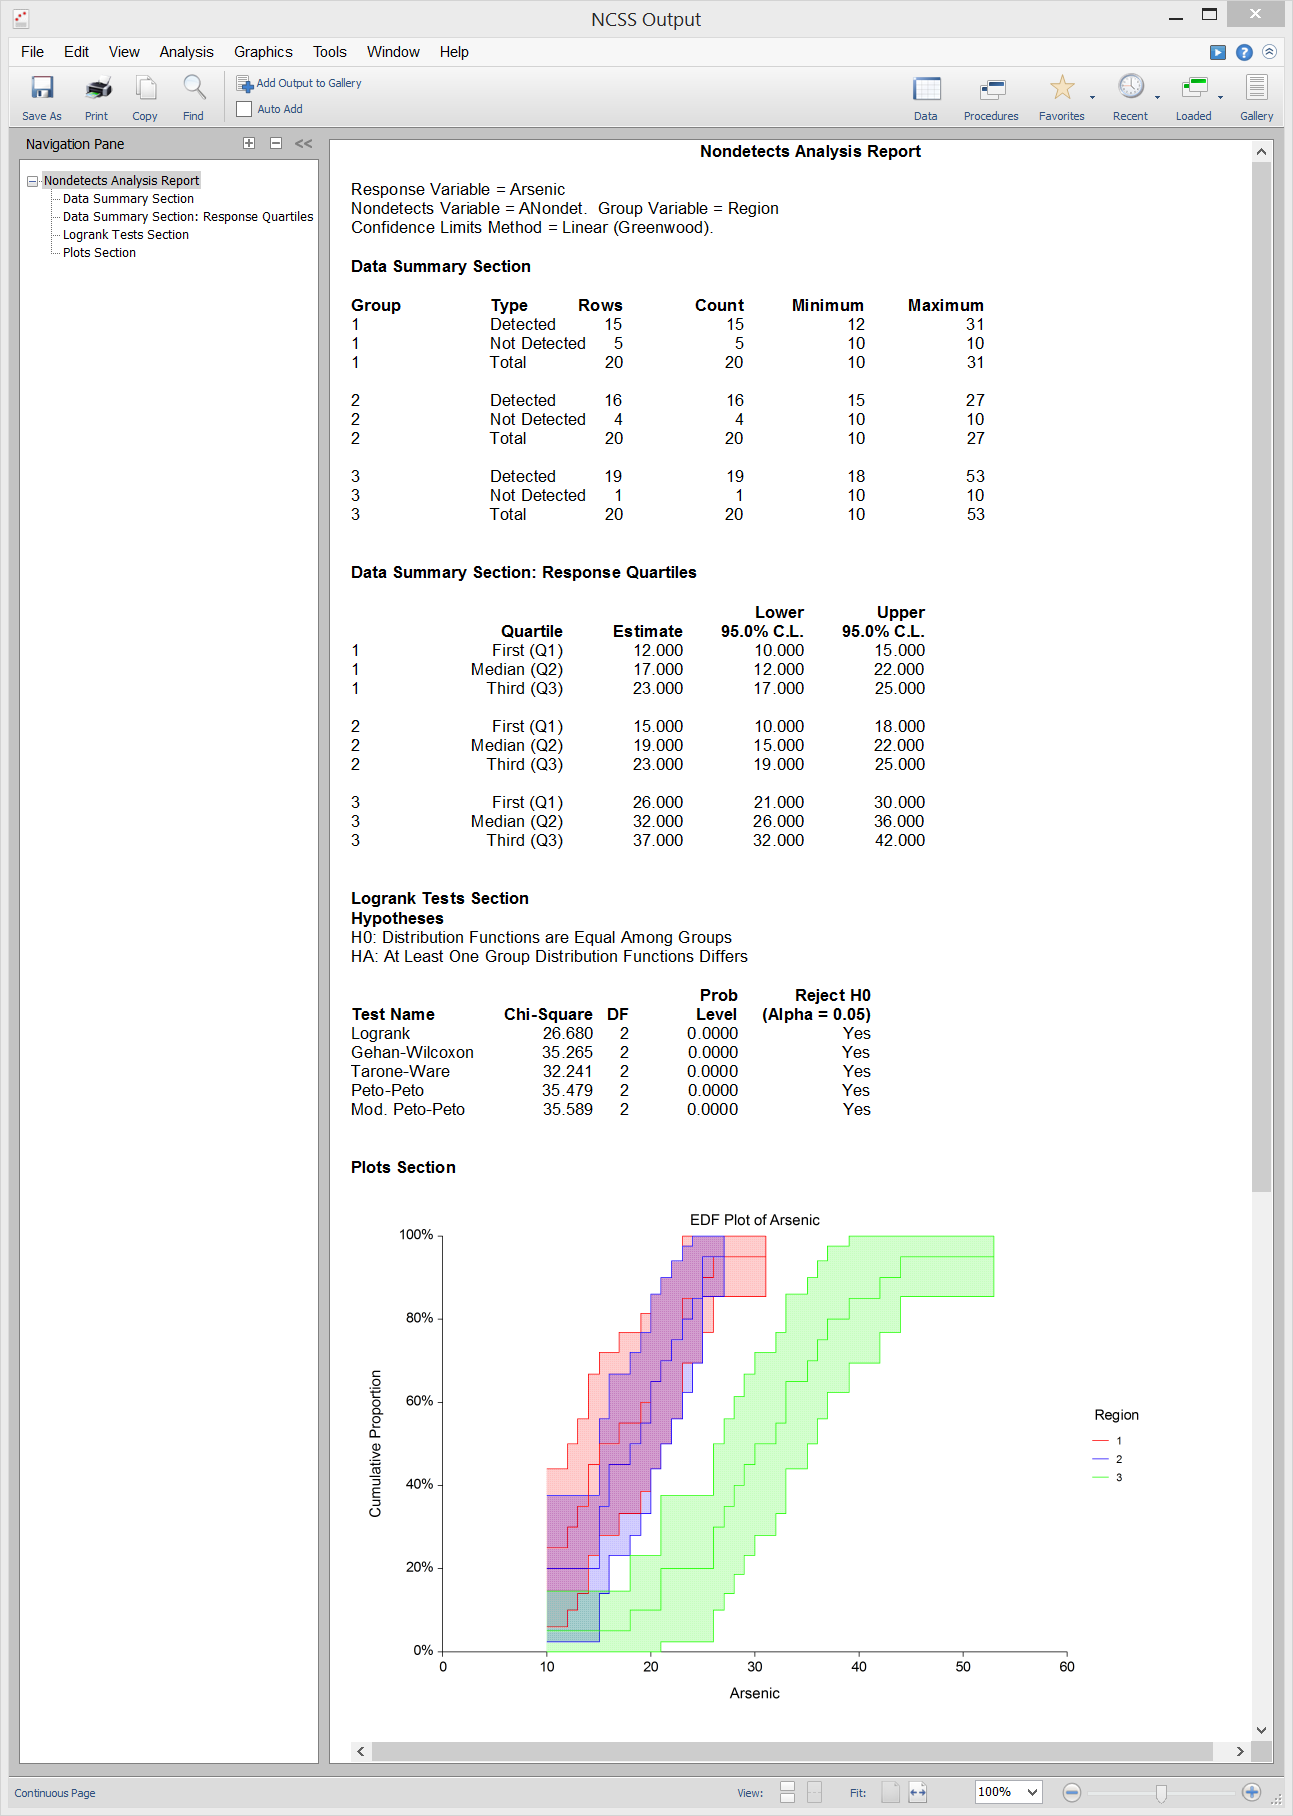
[Documentation PDF]This procedure computes summary statistics, generates EDF plots, and computes hypothesis tests appropriate for two or more groups for data with nondetects (left-censored) values. Following the recommendation of Helsel (2005), pp. 77-78, the methods for this procedure are valid only if fewer than 50% of the values are nondetects. The general approach is to convert the left-censored nondetects data to right-censored survival data, use the survival analysis techniques on the newly created survival data, and then convert the survival summaries back to original scale. The resulting summary statistics and hypothesis tests are analogs to the common techniques, but which appropriately account for nondetected observations (e.g. medians are used rather than means, EDF plots replace box plots and histograms, and logrank tests are used instead of two-sample t-tests and ANOVA).
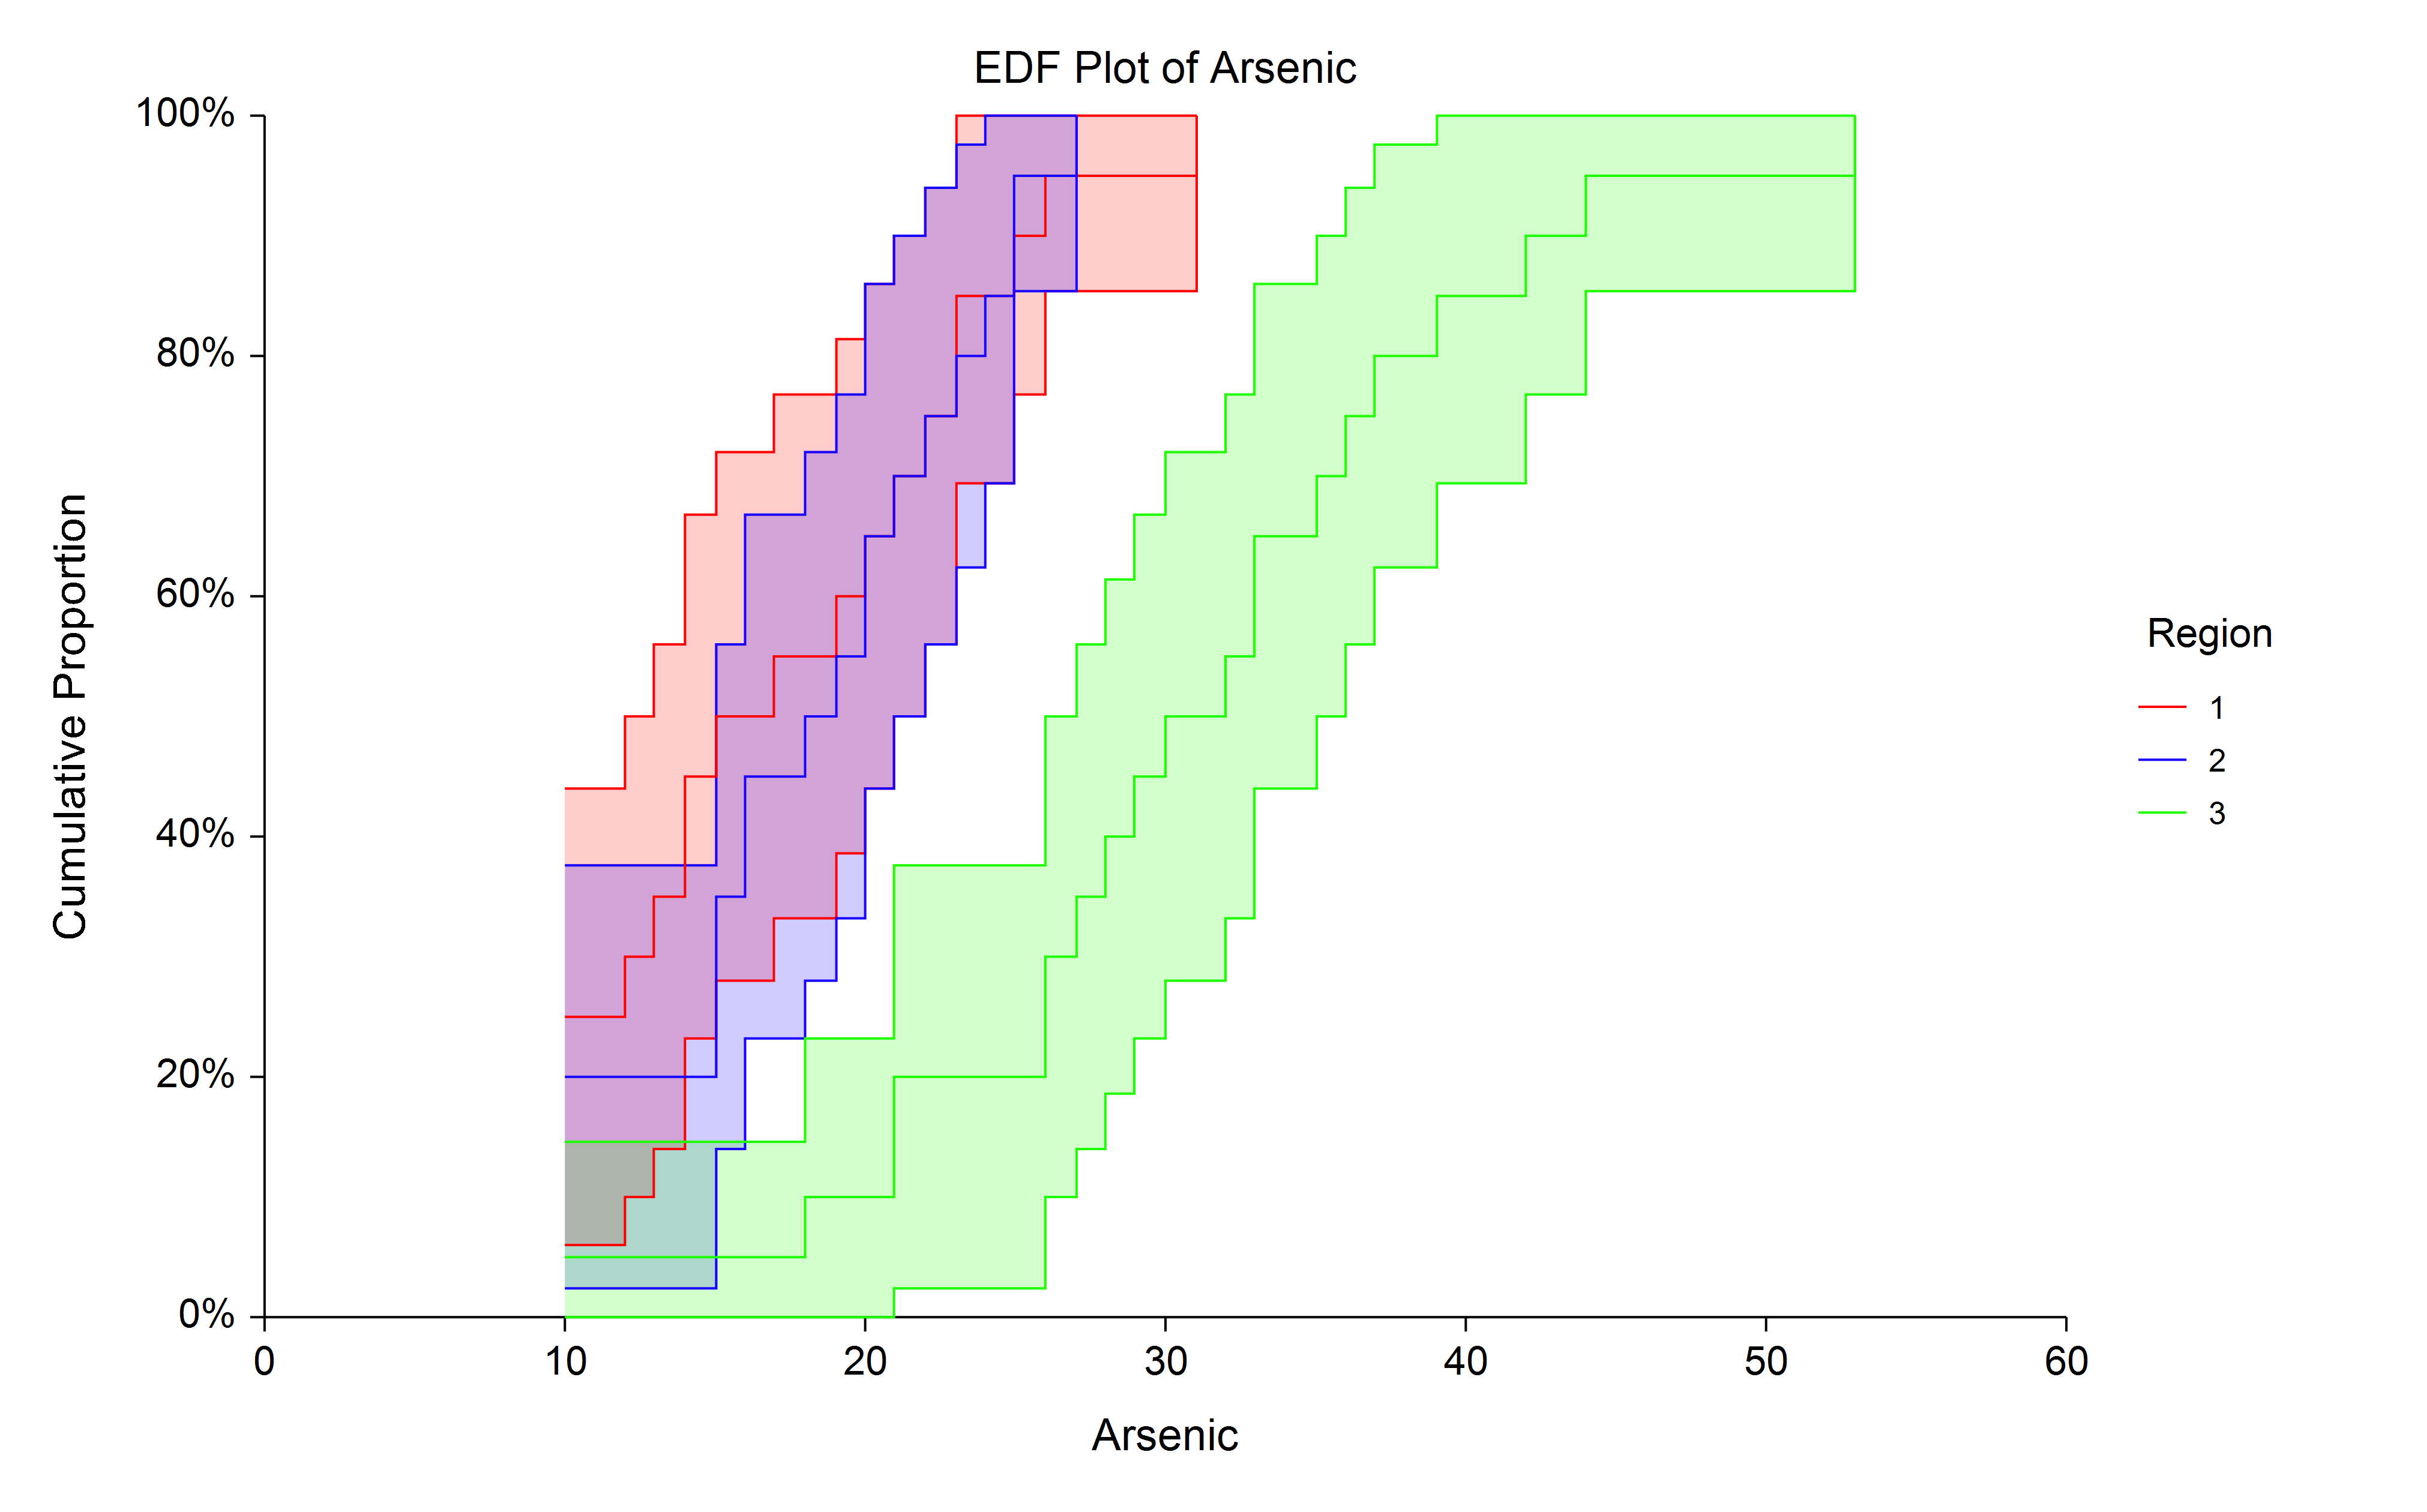
The Empirical Distribution Function (EDF)
The empirical distribution function (EDF) provides an approximation of the true cumulative distribution function of the measured response. It is useful for viewing or obtaining sample percentiles (quantiles) for each of the observed responses. The EDF is produced using the Kaplan-Meier product-limit estimator (estimated survival distribution) of the converted data. The resulting survival distribution is then converted to the EDF by converting the data back to the original scale.Sample EDF Plot
Sample Data
Procedure Input
Sample Output
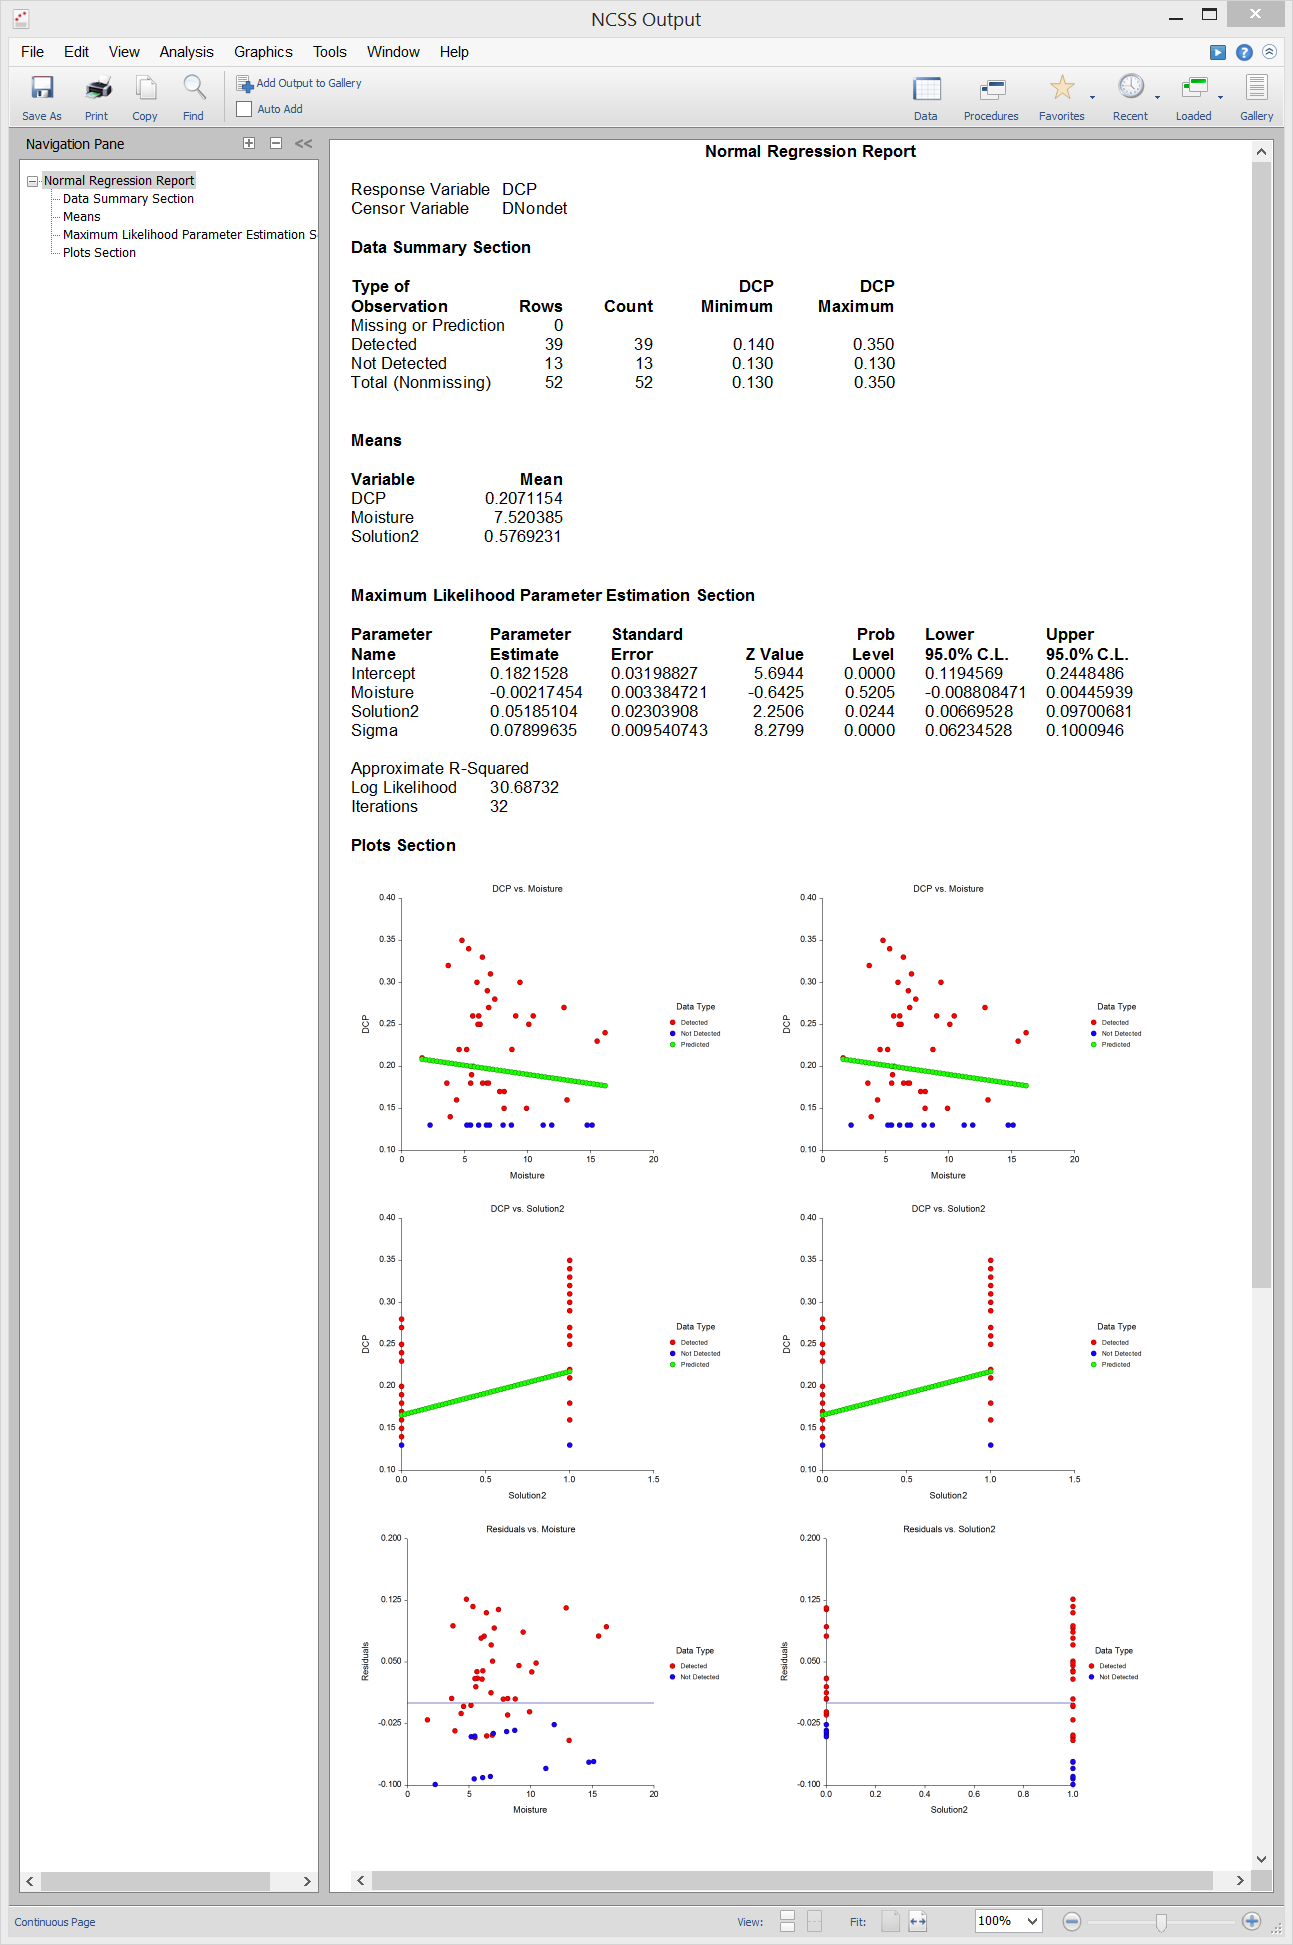
Nondetects-Data Regression
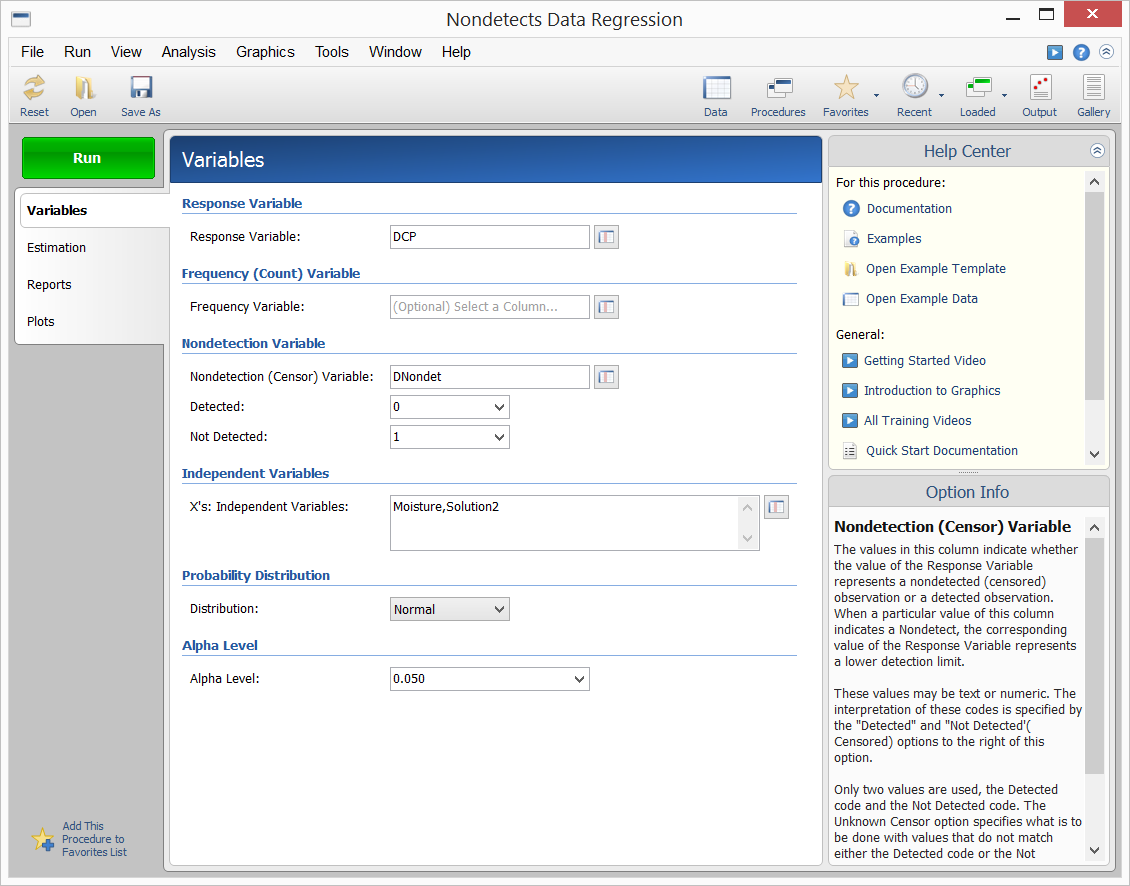
[Documentation PDF]The Nondetects-Data Regression procedure in NCSS software fits the regression relationship between a positive-valued dependent variable (with, possibly, some nondetected responses) and one or more independent variables. The distribution of the residuals (errors) is assumed to follow the exponential, extreme value, logistic, log-logistic, lognormal, lognormal10, normal, or Weibull distribution. Nondetected responses occur when one or more of the values cannot be measured exactly because they fall below one or more detection limits.
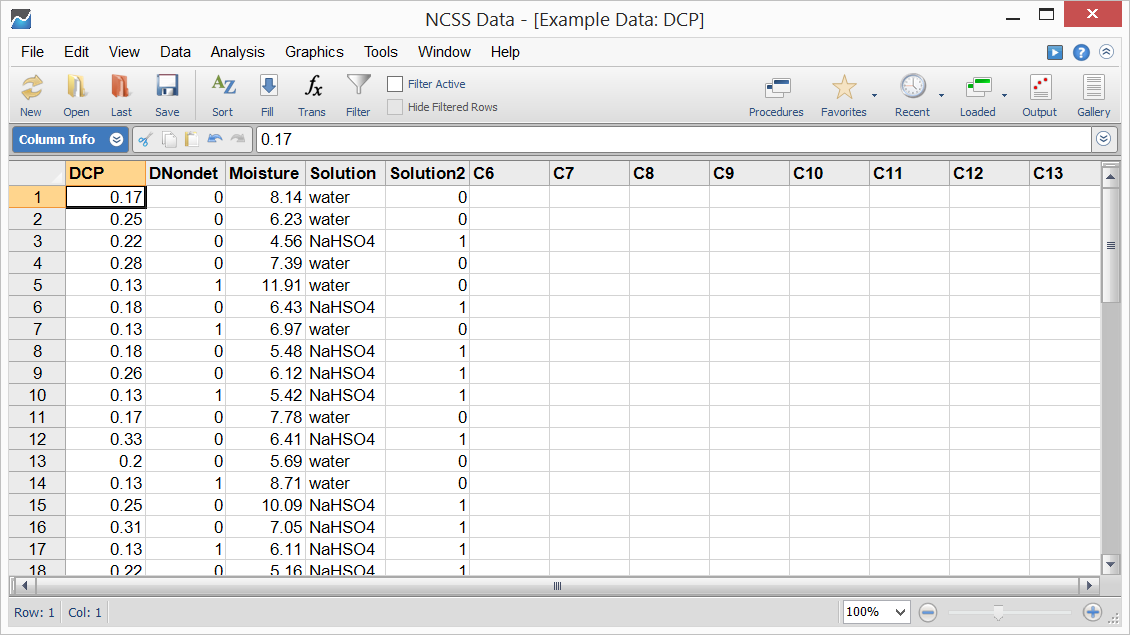
Sample Data
Procedure Input
Sample Output
