Sample Size for Correlation in PASS
PASS contains several procedures for sample size calculation and power analysis for correlation, including tests for one and two correlations, confidence intervals for one correlation, and tests for intraclass correlation. PASS also has procedures that compute sample size and power for testing one and two coefficient alphas, testing kappa for the agreement between two raters, and Lin's concordance correlation coefficient. Each procedure is easy-to-use and validated for accuracy. Use the links below to jump to a correlation topic. Only a brief summary is given for each procedure. For more details about a topic, we recommend you download and install the free trial of the PASS software and utilize its correlation software. Jump to:- Introduction
- Technical Details
- An Example Setup and Output
- Tests for One Correlation
- Tests for Two Correlations
- Confidence Intervals for One Correlation
- Tests for Intraclass Correlation
- Tests for One Coefficient (Cronbach’s) Alpha
- Tests for Two Coefficient (Cronbach’s) Alphas
- Kappa Test for Agreement Between Two Raters
- Lin's Concordance Correlation Coefficient
- Point Biserial Correlation Tests
- Spearman’s Rank Correlation Tests with Simulation
Introduction
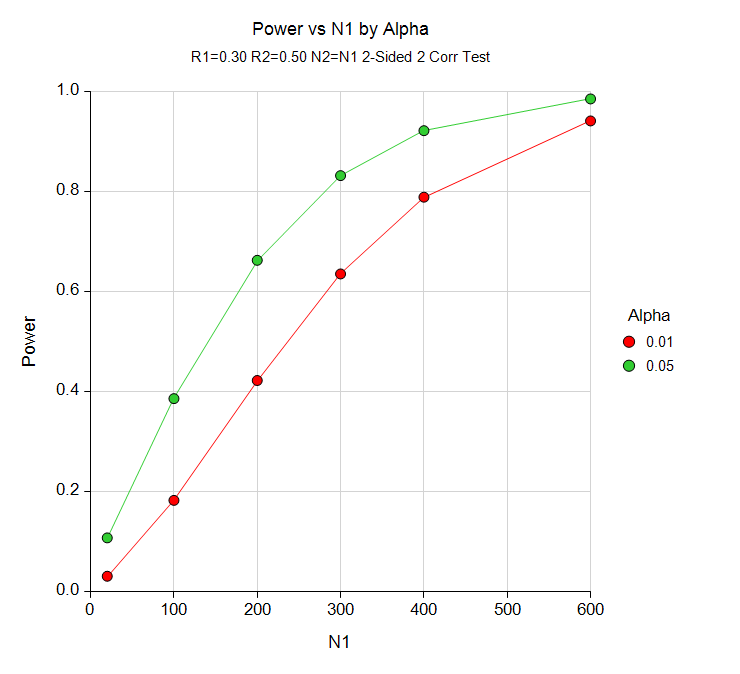
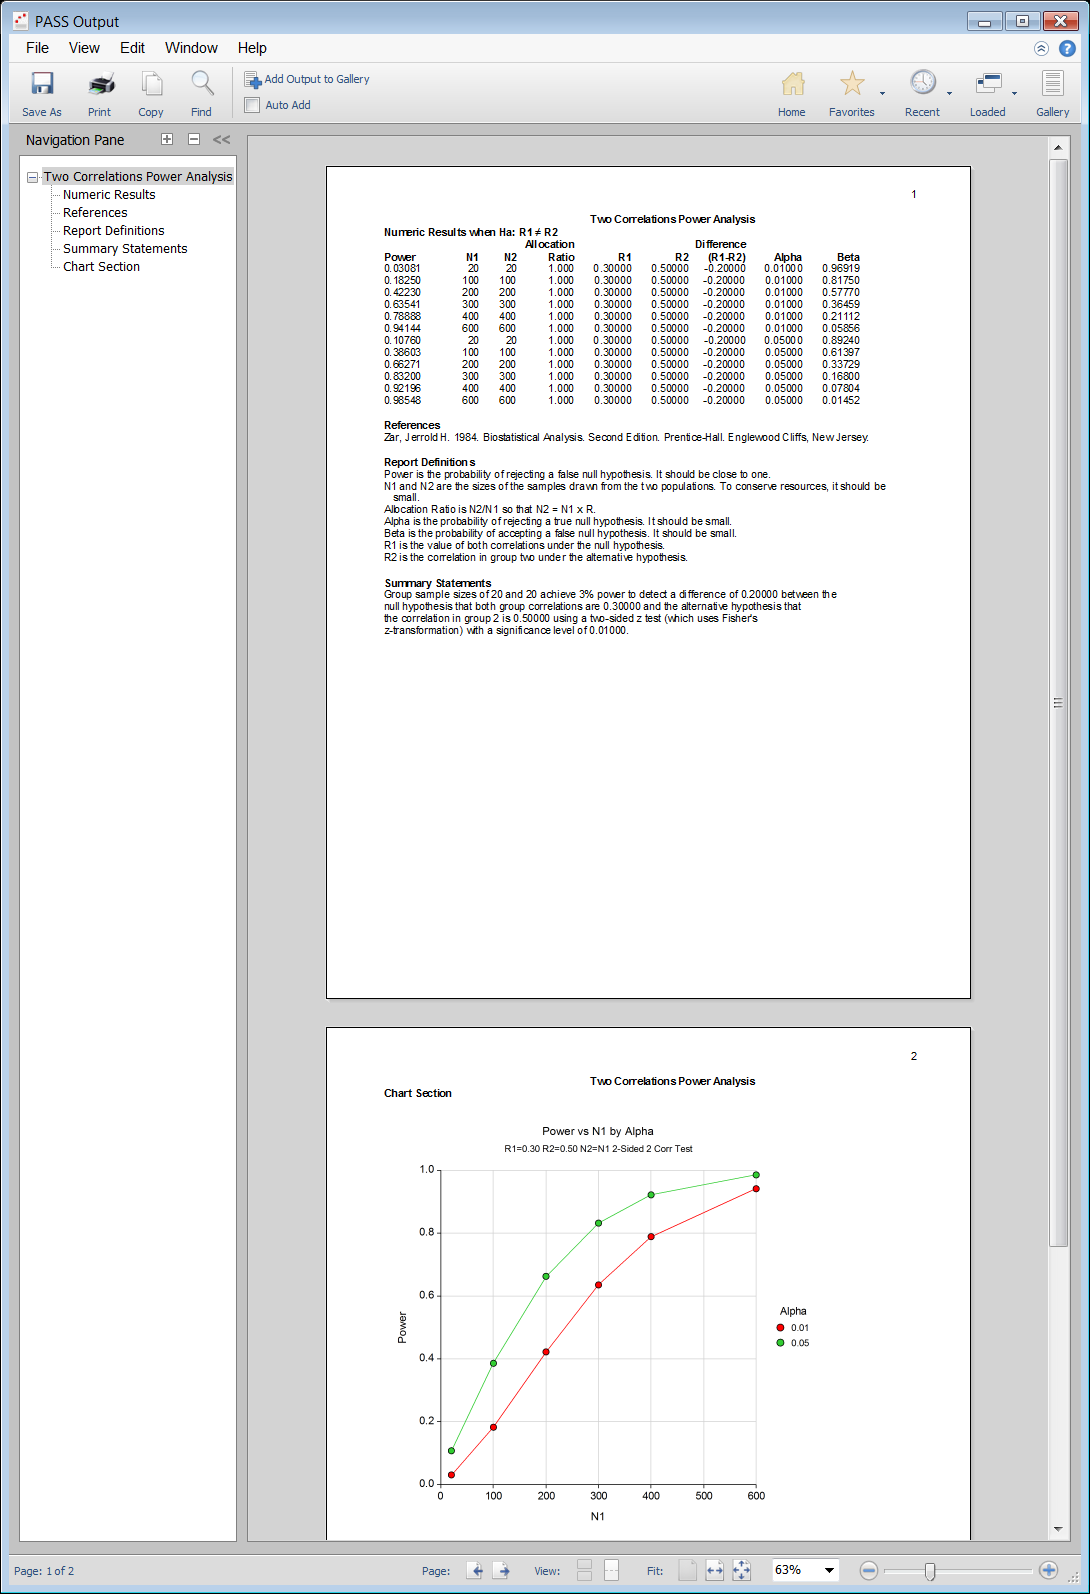
For most of the correlation procedures in PASS software, the user may choose to solve for sample size, power, or the correlation value. In the case of confidence intervals, one could solve for sample size or the distance to the confidence limit. In a typical correlation procedure where the goal is to estimate the sample size, the user enters power, alpha, and values related to correlation. The procedure is run and the output shows a summary of the entries as well as the sample size estimate(s). A summary statement is given, as well as references to the articles from which the formulas for the result were obtained. For many of the parameters (e.g., power, alpha, sample size, correlation, etc.), multiple values may be entered in a single run. When this is done, estimates are made for every combination of entered values. A numeric summary of these results is produced along with easy-to-read sample size or power curve graphs.
Technical Details
This page provides a brief description of the tools that are available in PASS software for sample size correlation and power analysis. If you would like to examine the formulas and technical details relating to a specific PASS procedure, we recommend you download and install the free trial of the software, open the desired correlation procedure, and click on the help button in the top right corner to view the complete documentation of the procedure. There you will find summaries, formulas, references, discussions, technical details, examples, and validation against published articles for the procedure.An Example Setup and Output
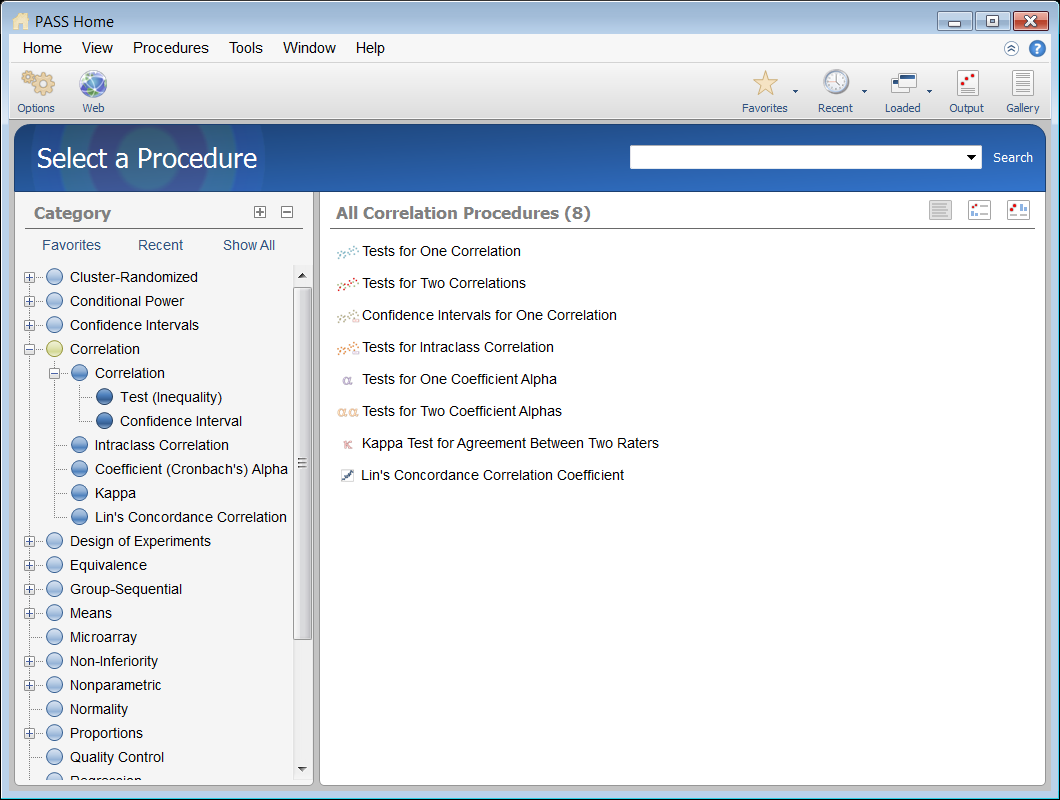
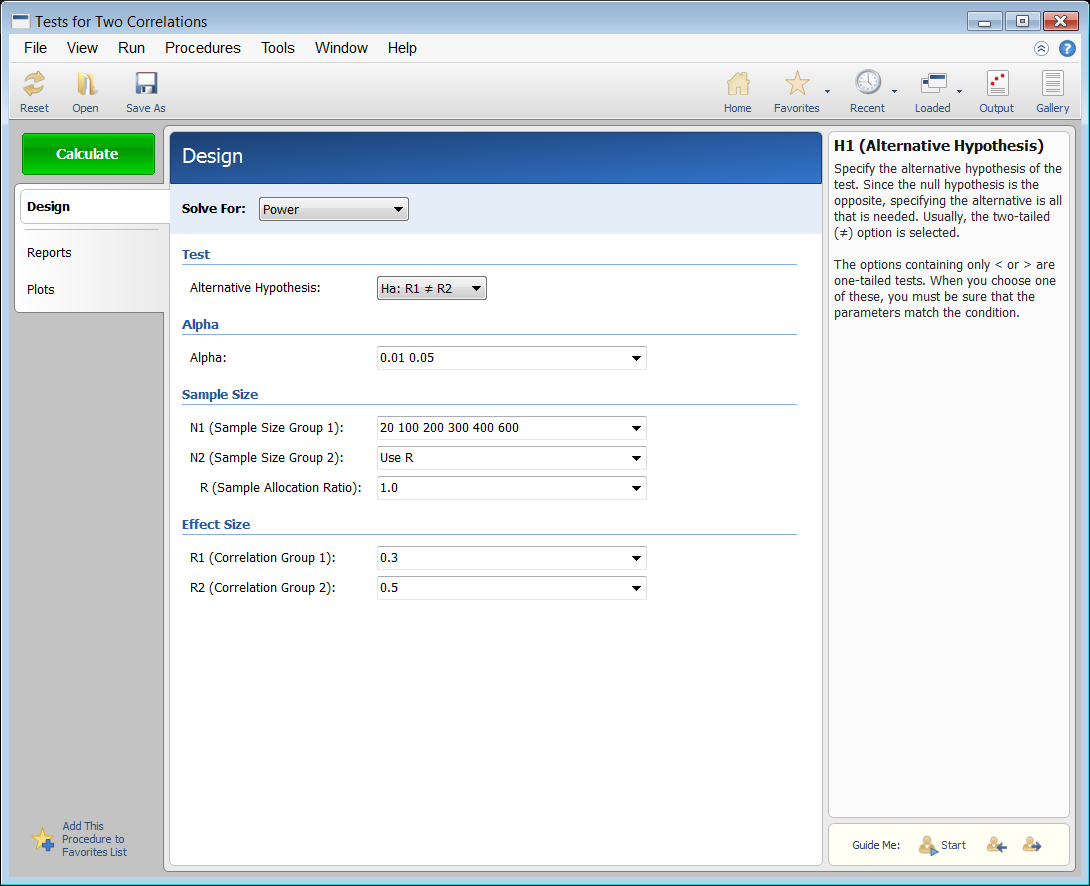
When the PASS software is first opened, the user is presented with the PASS Home window. From this window the desired procedure is selected from the menus, the category tree on the left, or with a procedure search. The procedure opens and the desired entries are made. When you click the Calculate button the results are produced. You can easily navigate to any part of the output with the navigation pane on the left.PASS Home Window

Procedure Window for Testing Two Correlations

PASS Output Window

Sample Size for Tests for One Correlation
The correlation coefficient, ρ (rho), is a popular statistic for describing the strength of the relationship between two variables. The correlation coefficient is the slope of the regression line between two variables when both variables have been standardized by subtracting their means and dividing by their standard deviations. The correlation ranges between negative one and one. When ρ is used as a descriptive statistic, no special distributional assumptions need to be made about the variables (Y and X) from which it is calculated. When hypothesis tests are made, you assume that the observations are independent and that the variables are distributed according to the bivariate-normal density function. However, as with the t-test, tests based on the correlation coefficient are robust to moderate departures from this normality assumption. The population correlation ρ is estimated by the sample correlation coefficient r. Note we use the symbol R on the screens and printouts to represent the population correlation. The Tests for One Correlation procedure in PASS provides sample size and power calculations for testing the null hypothesis that an alternative correlation, ρ1, is equal to the baseline correlation, ρ0. Usually ρ0 = 0.Sample Size for Tests for Two Correlations
The correlation coefficient (or correlation), ρ, is used to describe the strength of association between two variables. The correlation coefficient is the slope of the regression line between two variables when both variables have been standardized. It ranges between negative one and one. The Tests for Two Correlations procedure in PASS computes power and sample size for the case where you want to test the difference between two correlations, each coming from a separate sample. The null hypothesis is H0: ρ1 = ρ2. Since the correlation is the standardized slope between two variables, you could also apply this procedure to the case where you want to test whether the slopes in two groups are equal.Sample Size for Confidence Intervals for One Correlation
The Confidence Intervals for One Correlation procedure in PASS calculates the sample size necessary to achieve a specified interval width or distance from the sample correlation to the interval limit at a stated confidence level for a confidence interval for one correlation. This procedure assumes that the correlation of the future sample will be the same as the correlation that is specified. If the sample correlation is different from the one specified when running this procedure, the interval width may be narrower or wider than specified.Sample Size for Tests for Intraclass Correlation
The intraclass correlation coefficient is often used as an index of reliability in a measurement study. In these studies, there are N observations made on each of K individuals. These individuals represent a factor observed at random. This design arises when K subjects are each rated by N raters. The intraclass correlation coefficient may be thought of as the correlation between any two observations made on the same subject. When this correlation is high, the observations on a subject tend to match, and the measurement reliability is "high." The Tests for Intraclass Correlation procedure in PASS calculated the power and sample size for testing the null hypothesis H0: ρ = ρ0 versus the alternative H1: ρ > ρ0, where the intraclass correlation, ρ, is defined asρ = σa2 / σa2 + σe2
where σa2 is the variance of the random subject effects and σe2 is the variance of the measurement errors.
