Sample Size for Chi-Square and Other Proportions Tests in PASS
PASS contains several tools for sample size estimation and power analysis of multiple proportions, including crosstabs (chi-square), Cochran-Armitage, two ordered categorical variables, and sensitivity and specificity, among others. Each procedure is easy-to-use and is carefully validated for accuracy. Use the links below to jump to a proportions topic. For each procedure, only a brief summary of the procedure is given. For more details about a particular procedure, we recommend you
download and install the free trial of the software.
Jump to:
Introduction
For most of the sample size procedures in PASS for proportions, the user may choose to solve for sample size, power, or the population effect size in some manner. In a typical proportion test procedure where the goal is to estimate the sample size, the user enters power, alpha, and the desired population proportions. The procedure is run and the output shows a summary of the entries as well as the sample size estimate. A summary statement is given, as well as references to the articles from which the formulas for the result were obtained.
For many of the parameters (e.g., power, alpha, sample size, proportions, etc.), multiple values may be entered in a single run. When this is done, estimates are made for every combination of entered values. A numeric summary of these is results is produced as well as easy-to-read sample size or power curve graphs.
Technical Details
This page provides a brief description of the tools that are available in PASS for power and sample size analysis of multiple proportions. If you would like to examine the formulas and technical details relating to a specific PASS procedure, we recommend you
download and install the free trial of the software, open the desired proportions procedure, and click on the help button in the top right corner to view the complete documentation of the procedure. There you will find summaries, formulas, references, discussions, technical details, examples, and validation against published articles for the procedure.
An Example Setup and Output
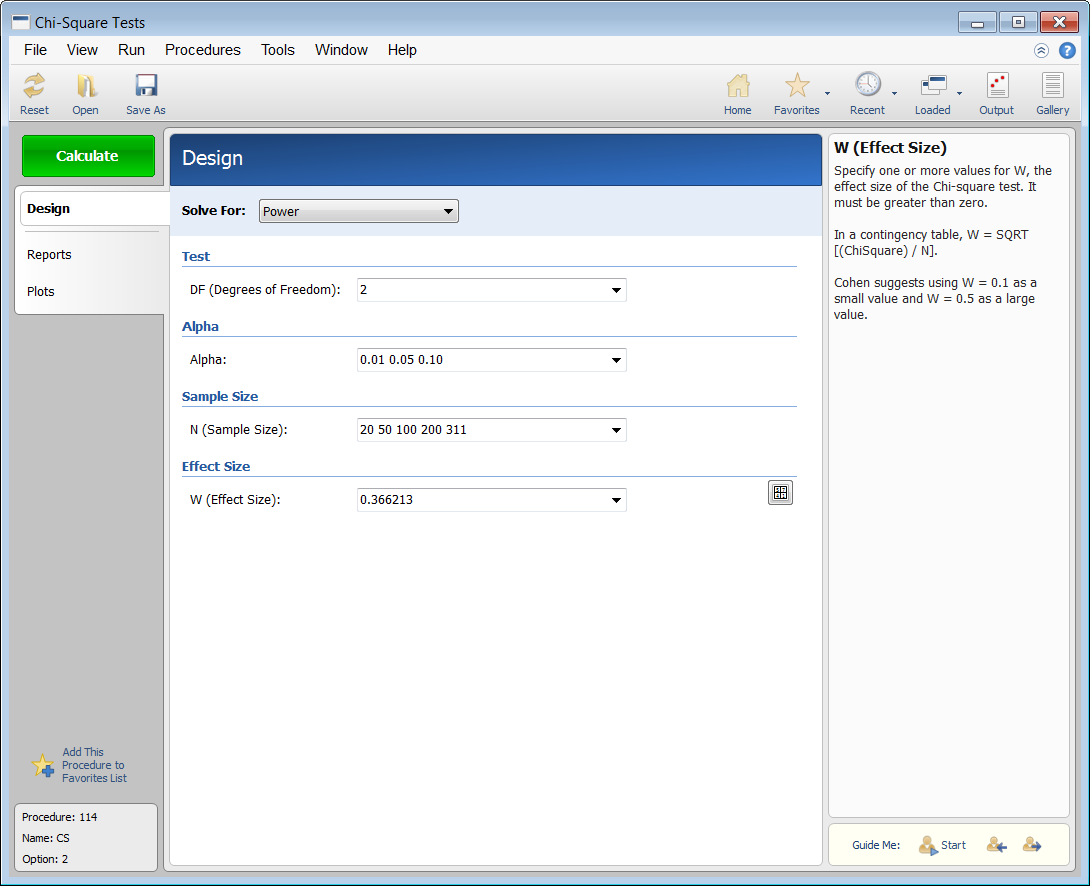
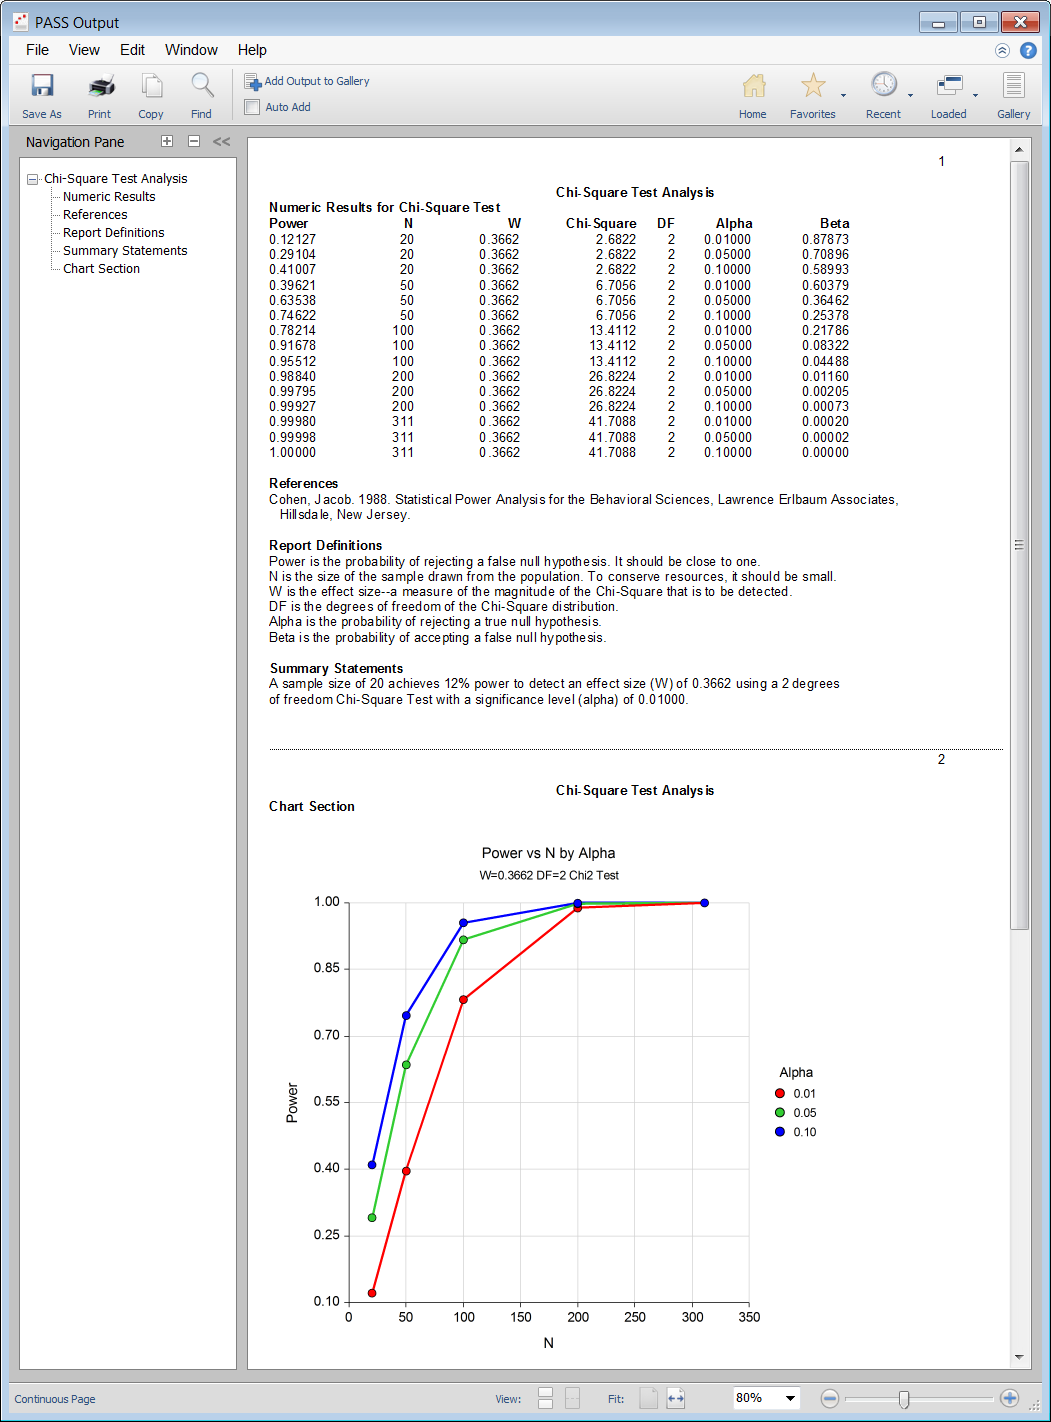
When the PASS software is first opened, the user is presented with the PASS Home window. From this window the desired procedure is selected from the menus, the category tree on the left, or with a procedure search. The procedure opens and the desired entries are made. When you click the Calculate button the results are produced. You can easily navigate to any part of the output with the navigation pane on the left.
PASS Home Window

Chi-Square Tests Procedure Window

PASS Output Window

Sample Size for Chi-Square (Contingency Table / Crosstabs) Tests
This procedure computes power and sample size for hypothesis tests of the chi-square test of independence or the chi-square goodness-of-fit (multinomial) test, based on the effect size. PASS provides a special module to aid in finding an appropriate value for the effect size called the Chi-Square Effect Size Estimator. In this estimator, you can enter values of a contingency table, sample size or data values and hypothesized proportions. The corresponding effect size may then be used for power and sample size calculations.
Sample Size for Cochran-Armitage Test for Trend in Proportions
This procedure computes power and sample size for the Cochran-Armitage test for a linear trend in proportions based on the results in Nam (1987). Asymptotic and exact power calculations for the uncorrected and continuity-corrected tests are available. The results assume that the proportions follow a linear trend on the logistic scale, with X being the covariate (or dose) variable, and that random samples are drawn from k separate populations.
Sample Size for Tests for Two Ordered Categorical Variables
This procedure computes power and sample size for tests of ordered categorical data such as Likert scale data. Assuming proportional odds, such data can be analyzed directly with a z-test, or using logistic regression or the Mann-Whitney test. The power and sample size formulae presented here are consistent with any of these analysis methods. The results used here were presented in a paper by Whitehead (1993). They are also mentioned in the book by Julious (2010) and Machin et al (1997).
Ordered categorical data often result from surveys such as a quality of life (QoL) survey in which responses are categories such as very good, good, moderate, poor. When there are only two categories, an analysis using two proportions should be used. When there are more than two responses, and those responses can be ordered, the techniques of this procedure can be used.
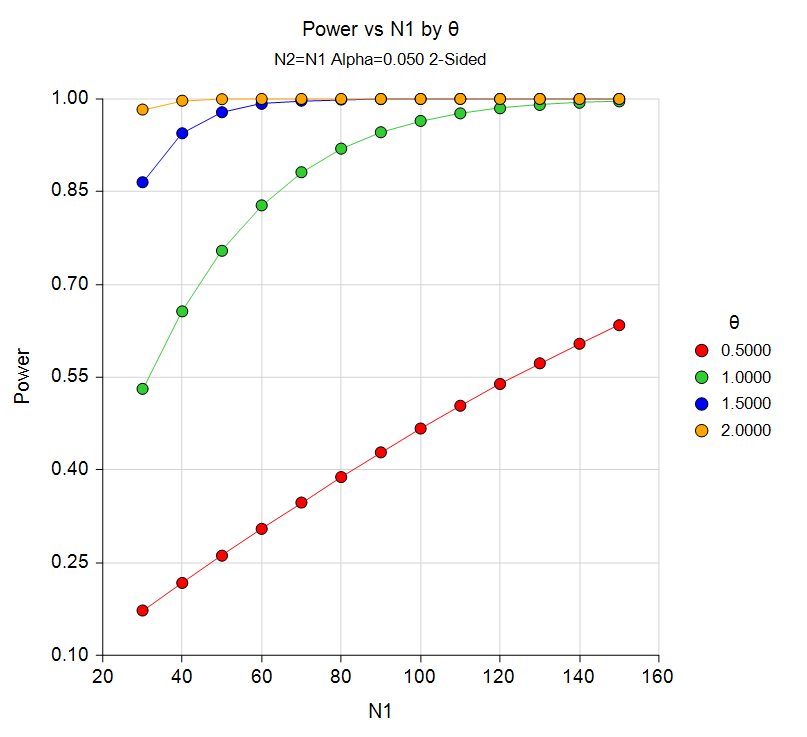
Power Curve from the Tests for Two Ordered Categorical Variables Procedure

Sample Size for Tests for Multiple Proportions in a One-Way Design
This module calculates the power and sample size for binary data from a one-way design for testing for differences among response proportions of those groups. This is analogous to the classical one-way ANOVA design that is used to analyze means. In the case of only two groups, this procedure produces power and sample size estimates that match those from the two independent-group proportions procedure.
The methods used in this procedure come from Mai and Zhang (2017). They proposed using a likelihood ratio test that has similar power characteristics to logistic regression.
Sample Size for Multiple Comparisons of Proportions vs. Control
This module computes power and sample size for multiple comparisons of treatment proportions versus a control proportion based on the results in Chow, Shao, and Wang (2008). In this design, there are k treatment groups and one control group. A proportion is measured in each group. A total of k hypothesis tests are anticipated each comparing a treatment group with the common control group using a simple z-test of the difference between two proportions. The type I error rate is controlled using a Bonferroni adjustment.
Sample Size for GEE Tests for Multiple Proportions in a Cluster-Randomized Design
This module calculates the power for testing for differences among the group proportions from binary, correlated data from a cluster-randomized design that are analyzed using a GEE logistic regression model.
GEE is different from mixed models in that it does not require the full specification of the joint distribution of the measurements, as long as the marginal mean model is correctly specified.
Estimation consistency is achieved even if the correlation matrix is incorrect. For clustered designs such as those discussed here, GEE assumes a compound symmetric (CS) correlation structure.
The outcomes are averaged at the cluster level. The precision of the experiment is increased by increasing the number of subjects per cluster as well as the number of clusters.
Sample Size for Sensitivity and Specificity
There are three procedures in PASS involving tests for sensitivity or specificity:
- Tests for One-Sample Sensitivity and Specificity
- Tests for Two Independent Sensitivities
- Tests for Paired Sensitivities
In each of these procedures, the user may solve for either power or sample size.
There are three procedures in PASS involving confidence intervals for sensitivity or specificity:
- Confidence Intervals for One-Sample Sensitivity
- Confidence Intervals for One-Sample Specificity
- Confidence Intervals for One-Sample Sensitivity and Specificity


