Comparing Means in NCSS
The group of tools for comparison of means constitute a very large portion of the common statistical tasks required in research. NCSS Statistical Software contains a variety of tools for tackling these tasks that are easy-to-use and carefully validated for accuracy. Use the links below to jump to the comparison of means topic you would like to examine. To see how these tools can benefit you, we recommend you download and install the free trial of NCSS. Jump to:- Introduction
- Technical Details
- T-Tests
- One-Way Analysis of Variance
- General Linear Models
- Repeated Measures Analysis of Variance
- Balanced Design Analysis of Variance
- Analysis of Two-Level Designs
- Nondetects-Data Group Comparison
- Multivariate Analysis of Variance (MANOVA)
- Mixed Models
Introduction
A common problem that arises in research is the comparison of the central tendency of one group to a value, or to another group or groups. Common statistical tools for assessing these comparisons are t-tests, analysis-of-variance, and general linear models. For cases where some assumptions are not met, a nonparametric alternative may be considered. The general goal for most of these tools is to use the estimate of the mean (or other central measure), assess the variation based on sample estimates, and use this information to provide the amount of evidence of a difference in means or central tendency. In our NCSS software, we seek to provide these tools in a concise and accurate manner, with straightforward output and to-the-point graphics.Technical Details
This page is designed to give a general overview of the capabilities of NCSS for the comparison of means. If you wish to see the formulas and technical details relating to a particular NCSS procedure, click on the corresponding '[Documentation PDF]' link under each heading to load the complete procedure documentation. There you will find references, formulas, discussions, and examples/tutorials describing the procedure in detail.T-Tests
[Documentation PDF for Two-Sample T-Test]The T-test is a common method for comparing the mean of one group to a value or the mean of one group to another. T-tests are very useful because they usually perform well in the face of minor to moderate departures from normality of the underlying group distributions. The T-test procedures available in NCSS include the following:
- One-Sample T-Test
- Paired T-Test
- Two-Sample T-Test
- Two-Sample T-Test from Means and Standard Deviations
- Cross-Over Analysis Using T-Tests
- Hotelling's One-Sample T²
- Hotelling's Two-Sample T²
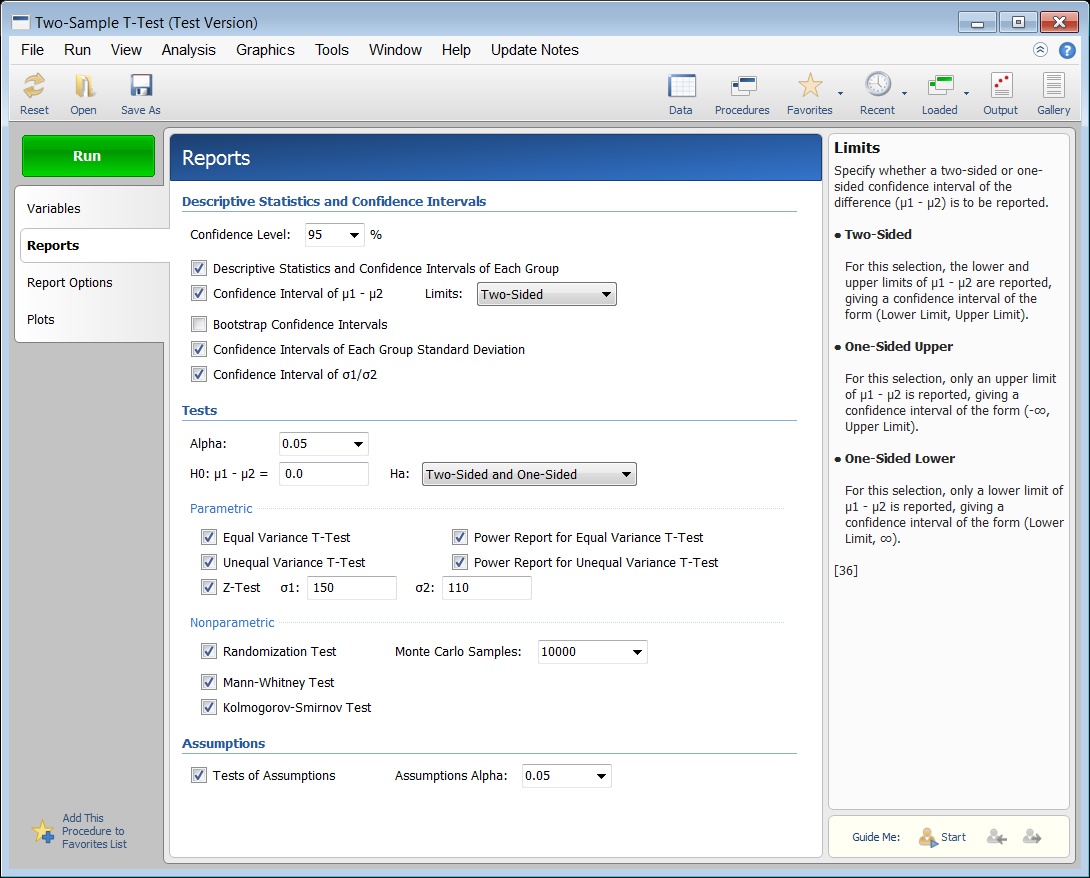
Report Selection Screen from the Two-Sample T-Test Procedure
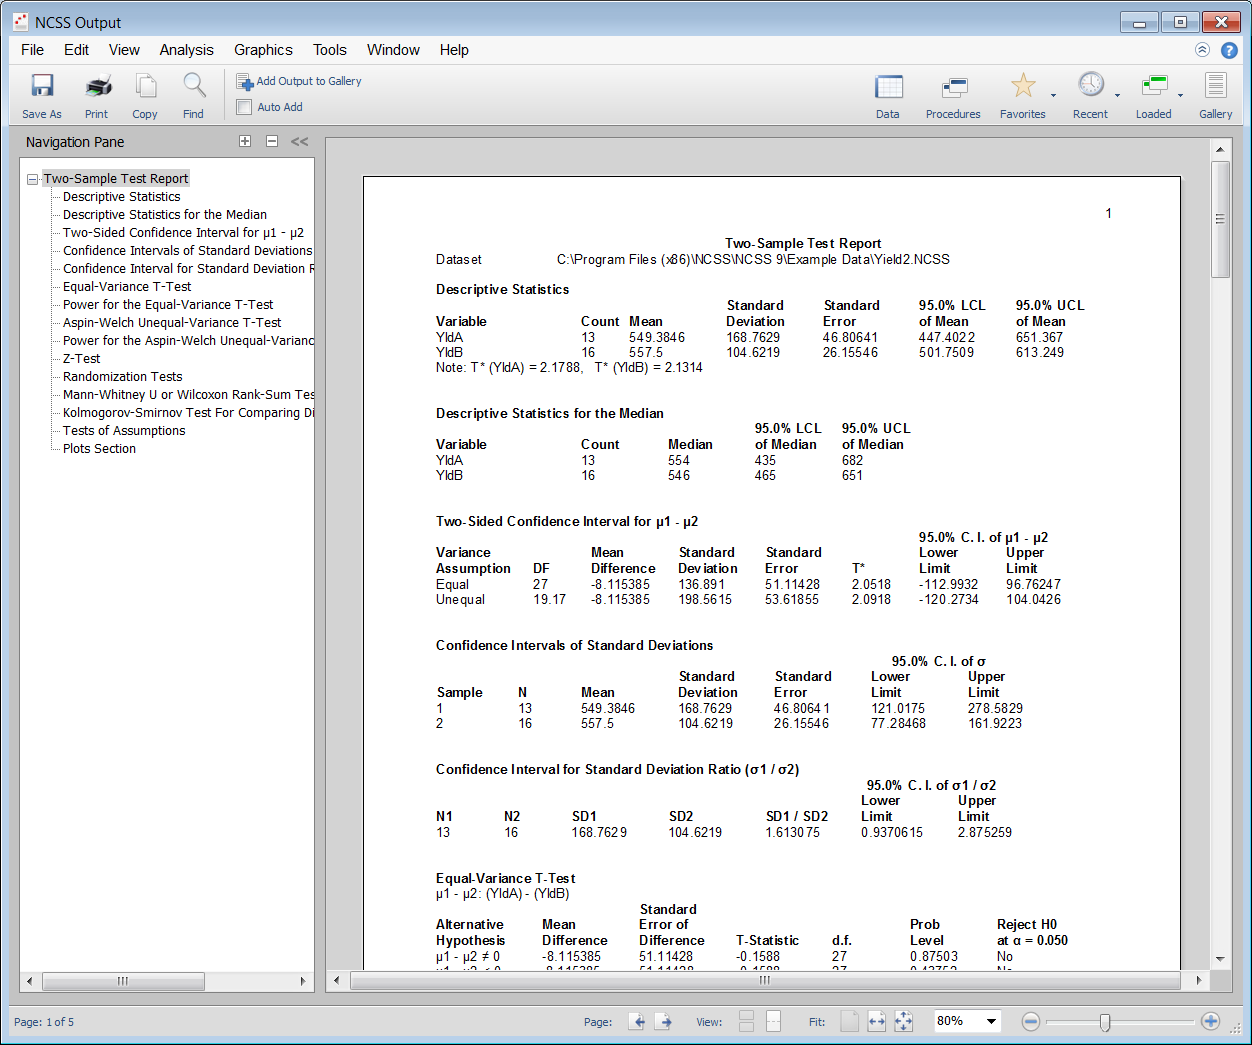
 The output has a section for each report chosen. You can easily jump to a particular section by clicking on the line of the navigation pane on the left. Output can easily be saved or copied-and-pasted into a word processing document or presentation software.
Portion of Two-Sample T-Test Procedure Output
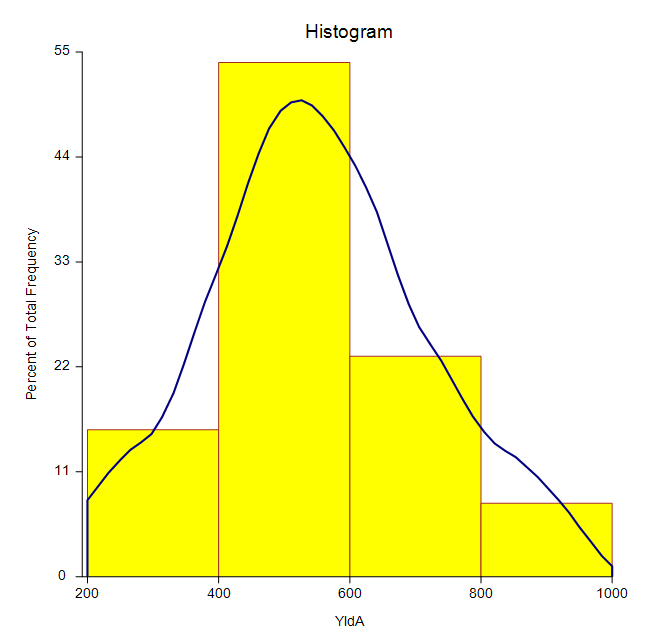
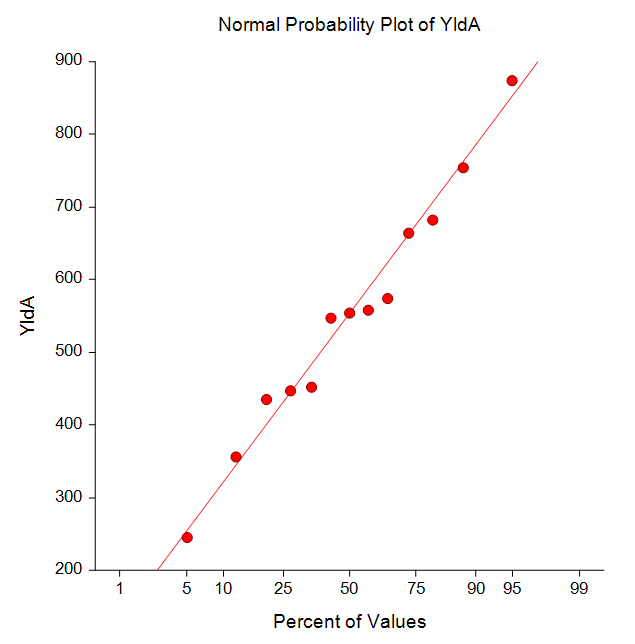
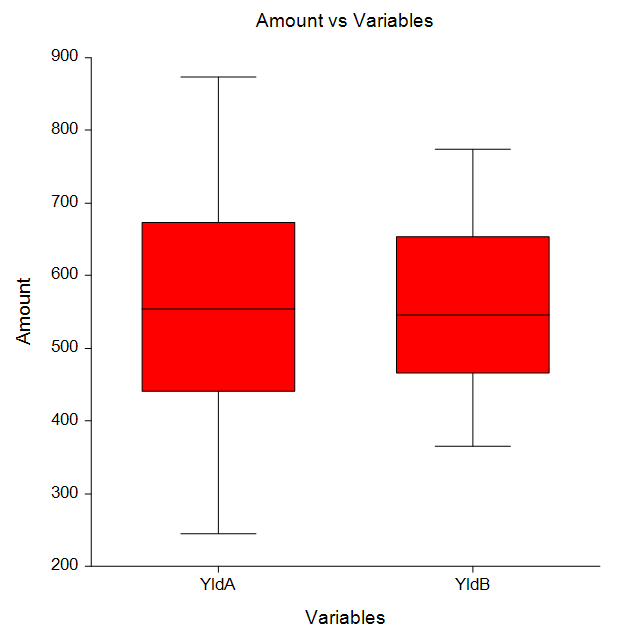
 In addition to the numeric reports, several graphs for assessing differences or test assumptions are also available.
Some Graphs from a Two-Sample T-Test Analysis
One-Way Analysis of Variance
[Documentation PDF]One-way analysis of variance is the typical method for comparing three or more group means. The usual goal is to determine if at least one group mean (or median) is different from the others. Often follow-up multiple comparison tests are used to determine where the differences occur. The One-Way Analysis of Variance procedure in NCSS can be used to perform a one-way (single-factor) analysis of variance and the Kruskal-Wallis nonparametric analysis based on ranks. The data for this procedure may be contained in either two or more columns or in one column indexed by a second (grouping) column. The procedure also provides an analysis of the typical assumptions associated with one-way ANOVA, as well as various multiple comparison options.
Multiple Comparison Tests in the One-Way ANOVA Procedure
- Bonferroni
- Duncan
- Dunnett's One- and Two-Sided Versus Control Tests
- Dunnett's Confidence Intervals
- Fisher's LSD Test
- Hsu's Multiple Comparison with Best
- Kruskal-Wallis Z Test (Dunn's Test)
- Newman-Keuls
- Scheffe
- Tukey-Kramer Test
- Tukey-Kramer Confidence Intervals and P-Values
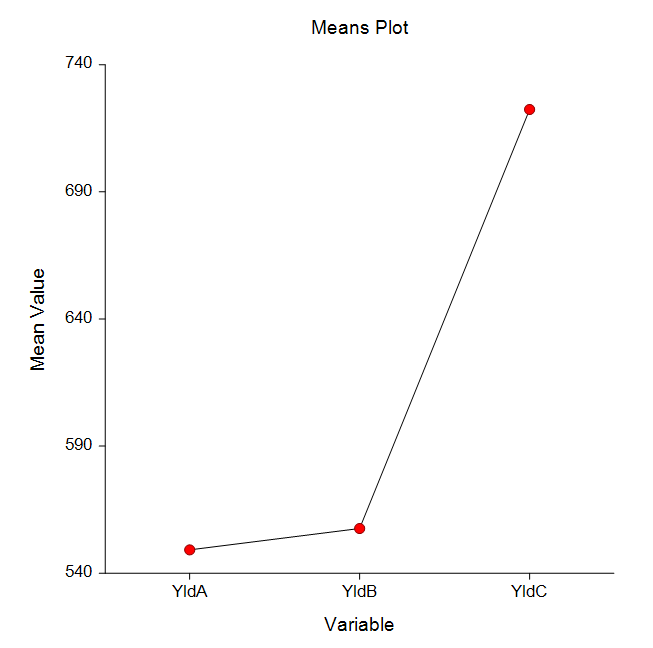
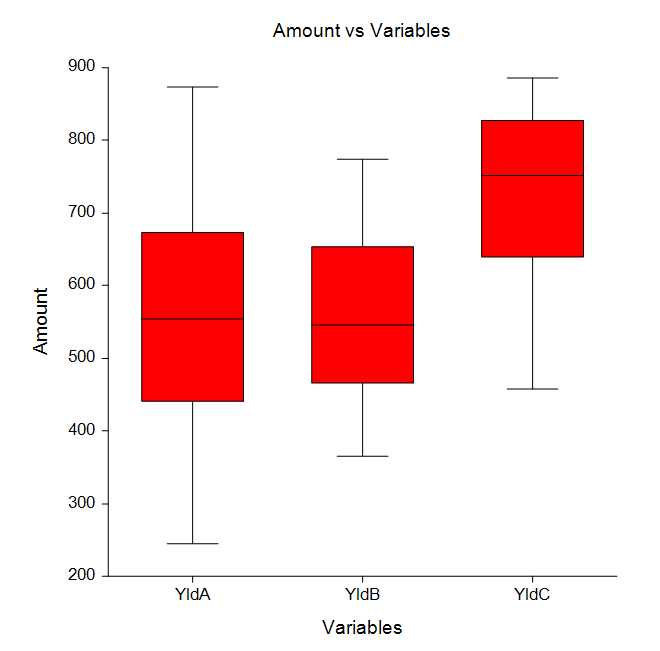
Some Plots from a One-Way Analysis of Variance Analysis
General Linear Models
[Documentation PDF]This procedure performs an analysis of variance or analysis of covariance on up to ten factors using the general linear models approach. The experimental design may include up to two nested terms, making possible various repeated measures and split-plot analyses. Because the program allows you to control which interactions are included and which are omitted, it can analyze designs with confounding such as Latin squares and fractional factorials. The procedure also provides a full array of multiple comparison options.
Multiple Comparison Tests in the General Linear Models Procedure
- Bonferroni
- Duncan
- Dunnett's One- and Two-Sided Versus Control Tests
- Dunnett's Confidence Intervals
- Fisher's LSD Test
- Hsu's Multiple Comparison with Best
- Newman-Keuls
- Scheffe
- Tukey-Kramer Test
- Tukey-Kramer Confidence Intervals and P-Values
- Tests for Two-Factor Interactions
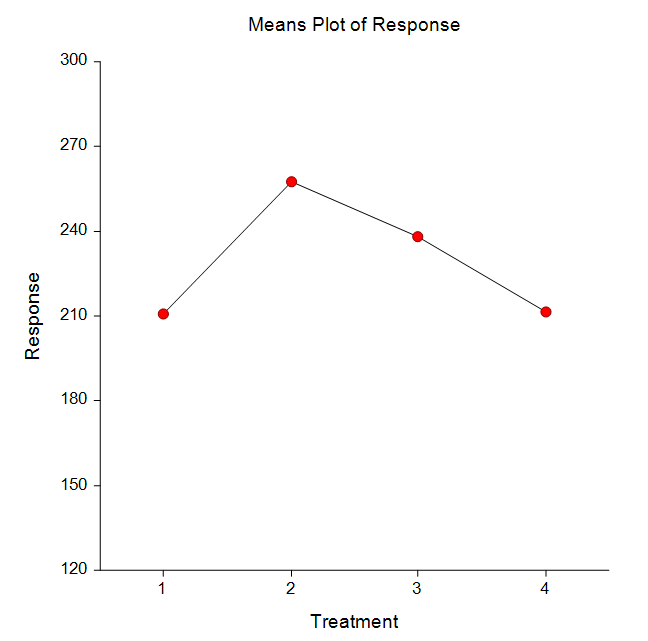
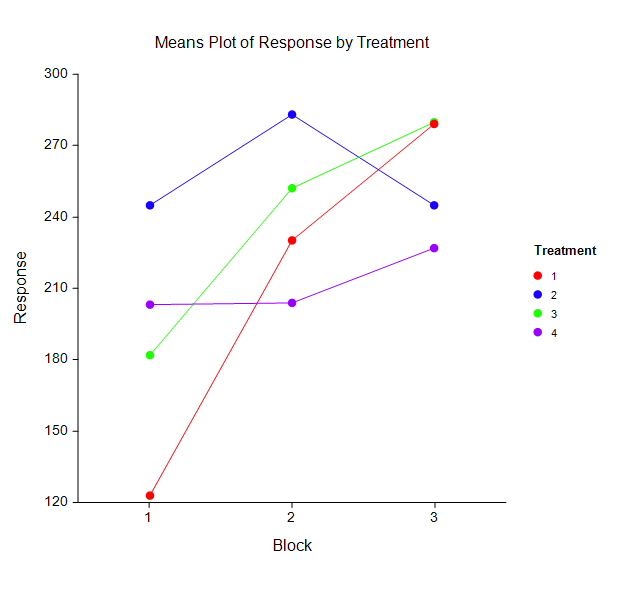
Some Means Plots from a General Linear Models Analysis
Repeated Measures Analysis of Variance
[Documentation PDF]This procedure performs an analysis of variance on repeated measures (within-subject) designs using the general linear models approach. The experimental design may include up to three between-subject terms as well as three within-subject terms. Box’s M and Mauchly’s tests of the assumptions about the within-subject covariance matrices are provided. Geisser-Greenhouse, Box, and Huynh-Feldt corrected probability levels on the within-subject F tests are given along with the associated test power. Repeated measures designs are popular because they allow a subject to serve as their own control. This improves the precision of the experiment by reducing the size of the error variance on many of the F-tests, but additional assumptions concerning the structure of the error variance must be made. This procedure uses the general linear model (GLM) framework to perform its calculations. Identical results can be achieved by using the GLM ANOVA procedure in NCSS. The procedure also provides a full array of multiple comparison options.
Multiple Comparison Tests in the General Linear Models Procedure
- Bonferroni
- Duncan
- Dunnett's One- and Two-Sided Versus Control Tests
- Dunnett's Confidence Intervals
- Fisher's LSD Test
- Hsu's Multiple Comparison with Best
- Newman-Keuls
- Scheffe
- Tukey-Kramer Test
- Tukey-Kramer Confidence Intervals and P-Values
- Tests for Two-Factor Interactions
Balanced Design Analysis of Variance
[Documentation PDF]This procedure performs an analysis of variance on up to ten factors. The experimental design must be of the factorial type (no nested or repeated-measures factors) with no missing cells. If the data are balanced (equal-cell frequency), this procedure yields exact F-tests. If the data are not balanced, approximate F-tests are generated using the method of unweighted means (UWM). The F-ratio is used to determine statistical significance. The tests are nondirectional in that the null hypothesis specifies that all means for a specified main effect or interaction are equal and the alternative hypothesis simply states that at least one is different. Studies have shown that the properties of UWM F-tests are very good if the amount of unbalance in the cell frequencies is small. When there are several factors each with many levels, the GLM solution may not be obtainable. In these cases, UWM provides a very useful approximation. When the design is balanced, both procedures yield the same results, but the UWM method is much faster. The procedure also calculates Friedman’s two-way analysis of variance by ranks. This test is the nonparametric analog of the F-test in a randomized block design. The multiple comparison options available in this procedure are the same as those given in the General Linear Models procedure.
Analysis of Two-Level Designs
[Documentation PDF]Several analysis programs are available in NCSS for the analysis of designed experiments. The General Linear Models and the Multiple Regression procedures are often used. The Analysis of Two-Level Designs procedure is used to analyze a very particular set of designs: two-level factorials (with an optional blocking variable) in which the number of rows is a power of two (4, 8, 16, 32, 64, 128, etc.) and there are no missing values. Given that your data meet these restrictions, this program gives you a complete analysis including:
- Analysis of the design itself
- List of confounding and aliasing patterns
- Analysis of variance table
- Tables of means and effects
- Probability plots of residuals and effects
- Two-way and cube plots of means and differences
Nondetects-Data Group Comparison
[Documentation PDF]This procedure computes summary statistics, generates EDF plots, and computes hypothesis tests appropriate for two or more groups for data with nondetects (left-censored) values. Click here for more information about the Nondetects-Data Group Comparison procedure in NCSS.
Multivariate Analysis of Variance (MANOVA)
[Documentation PDF]Multivariate analysis of variance (MANOVA) is an extension of common analysis of variance (ANOVA). In ANOVA, differences among various group means on a single-response variable are studied. In MANOVA, the number of response variables is increased to two or more. The hypothesis concerns a comparison of vectors of group means. When only two groups are being compared, the results are identical to Hotelling’s T² procedure. The multivariate extension of the F-test is not completely direct. Instead, several test statistics are available, including Wilks’ Lambda, the Lawley-Hotelling Trace, Pillai's Trace, and Roy's Largest Root. The distributions of these statistics are approximated by the F-distribution. In a MANOVA model, there are one or more factors (each with two or more levels) and two or more dependent variables. The calculations are based on extensions of the general linear model approach used for analysis of variance.
Mixed Models
[Documentation PDF]The Mixed Models procedures in NCSS provide a flexible framework for the analysis of linear models. There are four models procedures in NCSS:
- Mixed Models - General
- Mixed Models - Repeated Measures
- Mixed Models - No Repeated Measures
- Mixed Models - Random Coefficients
- Two-sample designs
- One-way layout designs
- Factorial designs
- Split-plot designs
- Repeated-measures designs
- Cross-over designs
- Designs with covariates
- Specifying More Appropriate Variance-Covariance Structures for Longitudinal Data: The ability to fit complex covariance patterns provides more appropriate fixed effect estimates and standard errors.
- Analysis Assuming Unequal Group Variances: Different variances can be fit for each treatment group.
- Analysis of Longitudinal Data with Unequal Time Points: Mixed models allow for the analysis of data in which the measurements were made at random (varying) time points.
- Analysis of Longitudinal Data with Missing Response Data: Problems caused by missing data in repeated measures and cross-over trials are eliminated.
- Greater Flexibility in Modeling Covariates: Covariates can be modeled as fixed or random and more accurately represent their true contribution in the model.
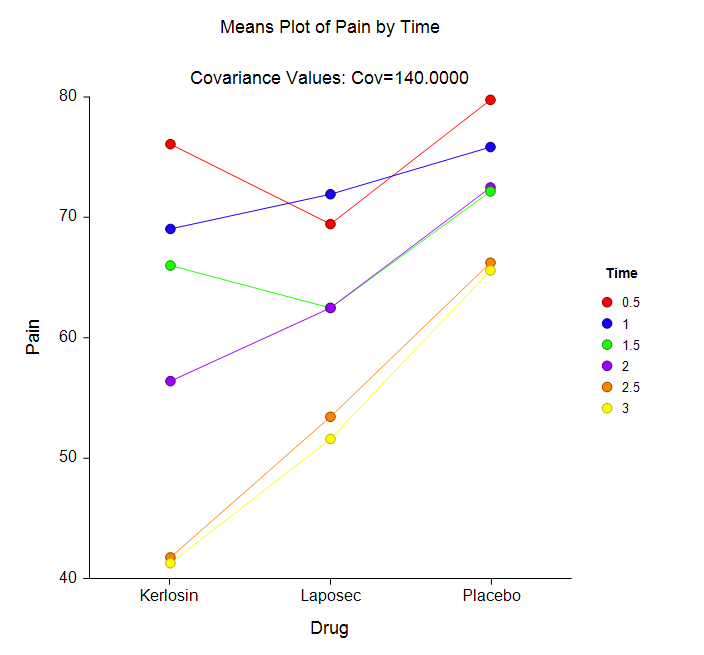
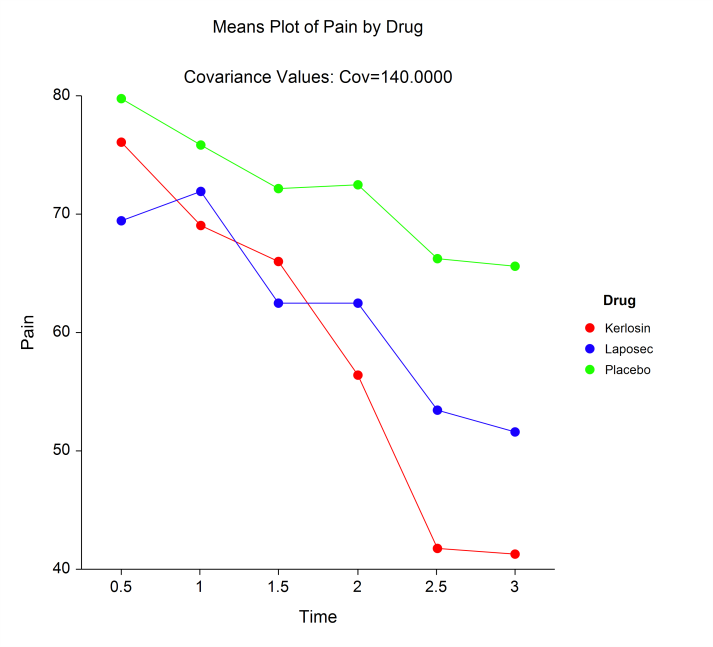
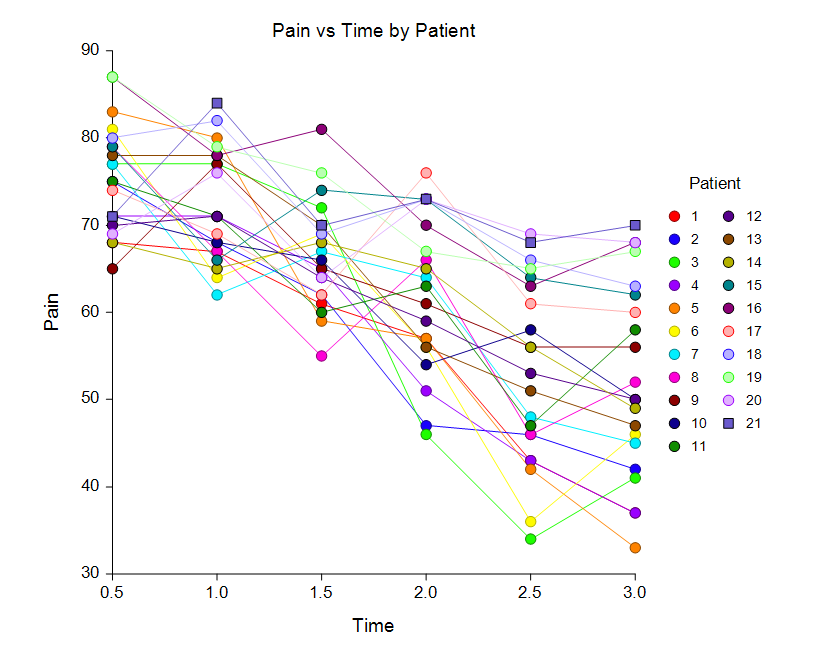
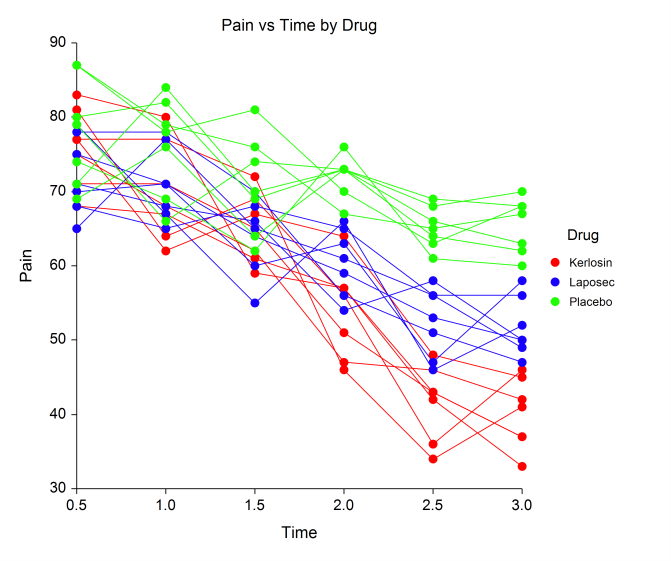
Some Means and Subject Plots in a Mixed Models Analysis
