Group-Sequential Analysis in NCSS
NCSS includes tools for performing group-sequential analysis of one or two means, two proportions, and two hazard rates. Tools are also available for non-inferiority and superiority by a margin tests. The group-sequential analysis procedures in NCSS are easy-to-use and validated for accuracy. Use the links below to jump to the group-sequential analysis topic you would like to examine. To see how these tools can benefit you, we recommend you download and install the free trial of NCSS. For details about the initial sample size estimation in PASS, as well as other general group-sequential testing details, click here.
Jump to:
- Introduction
- Technical Details
- Group-Sequential Analysis for Two Means with Known Variances
- Group-Sequential T-Tests for Two Means
- Group-Sequential Analysis for Two Proportions
- Group-Sequential Analysis for Two Hazard Rates
Introduction
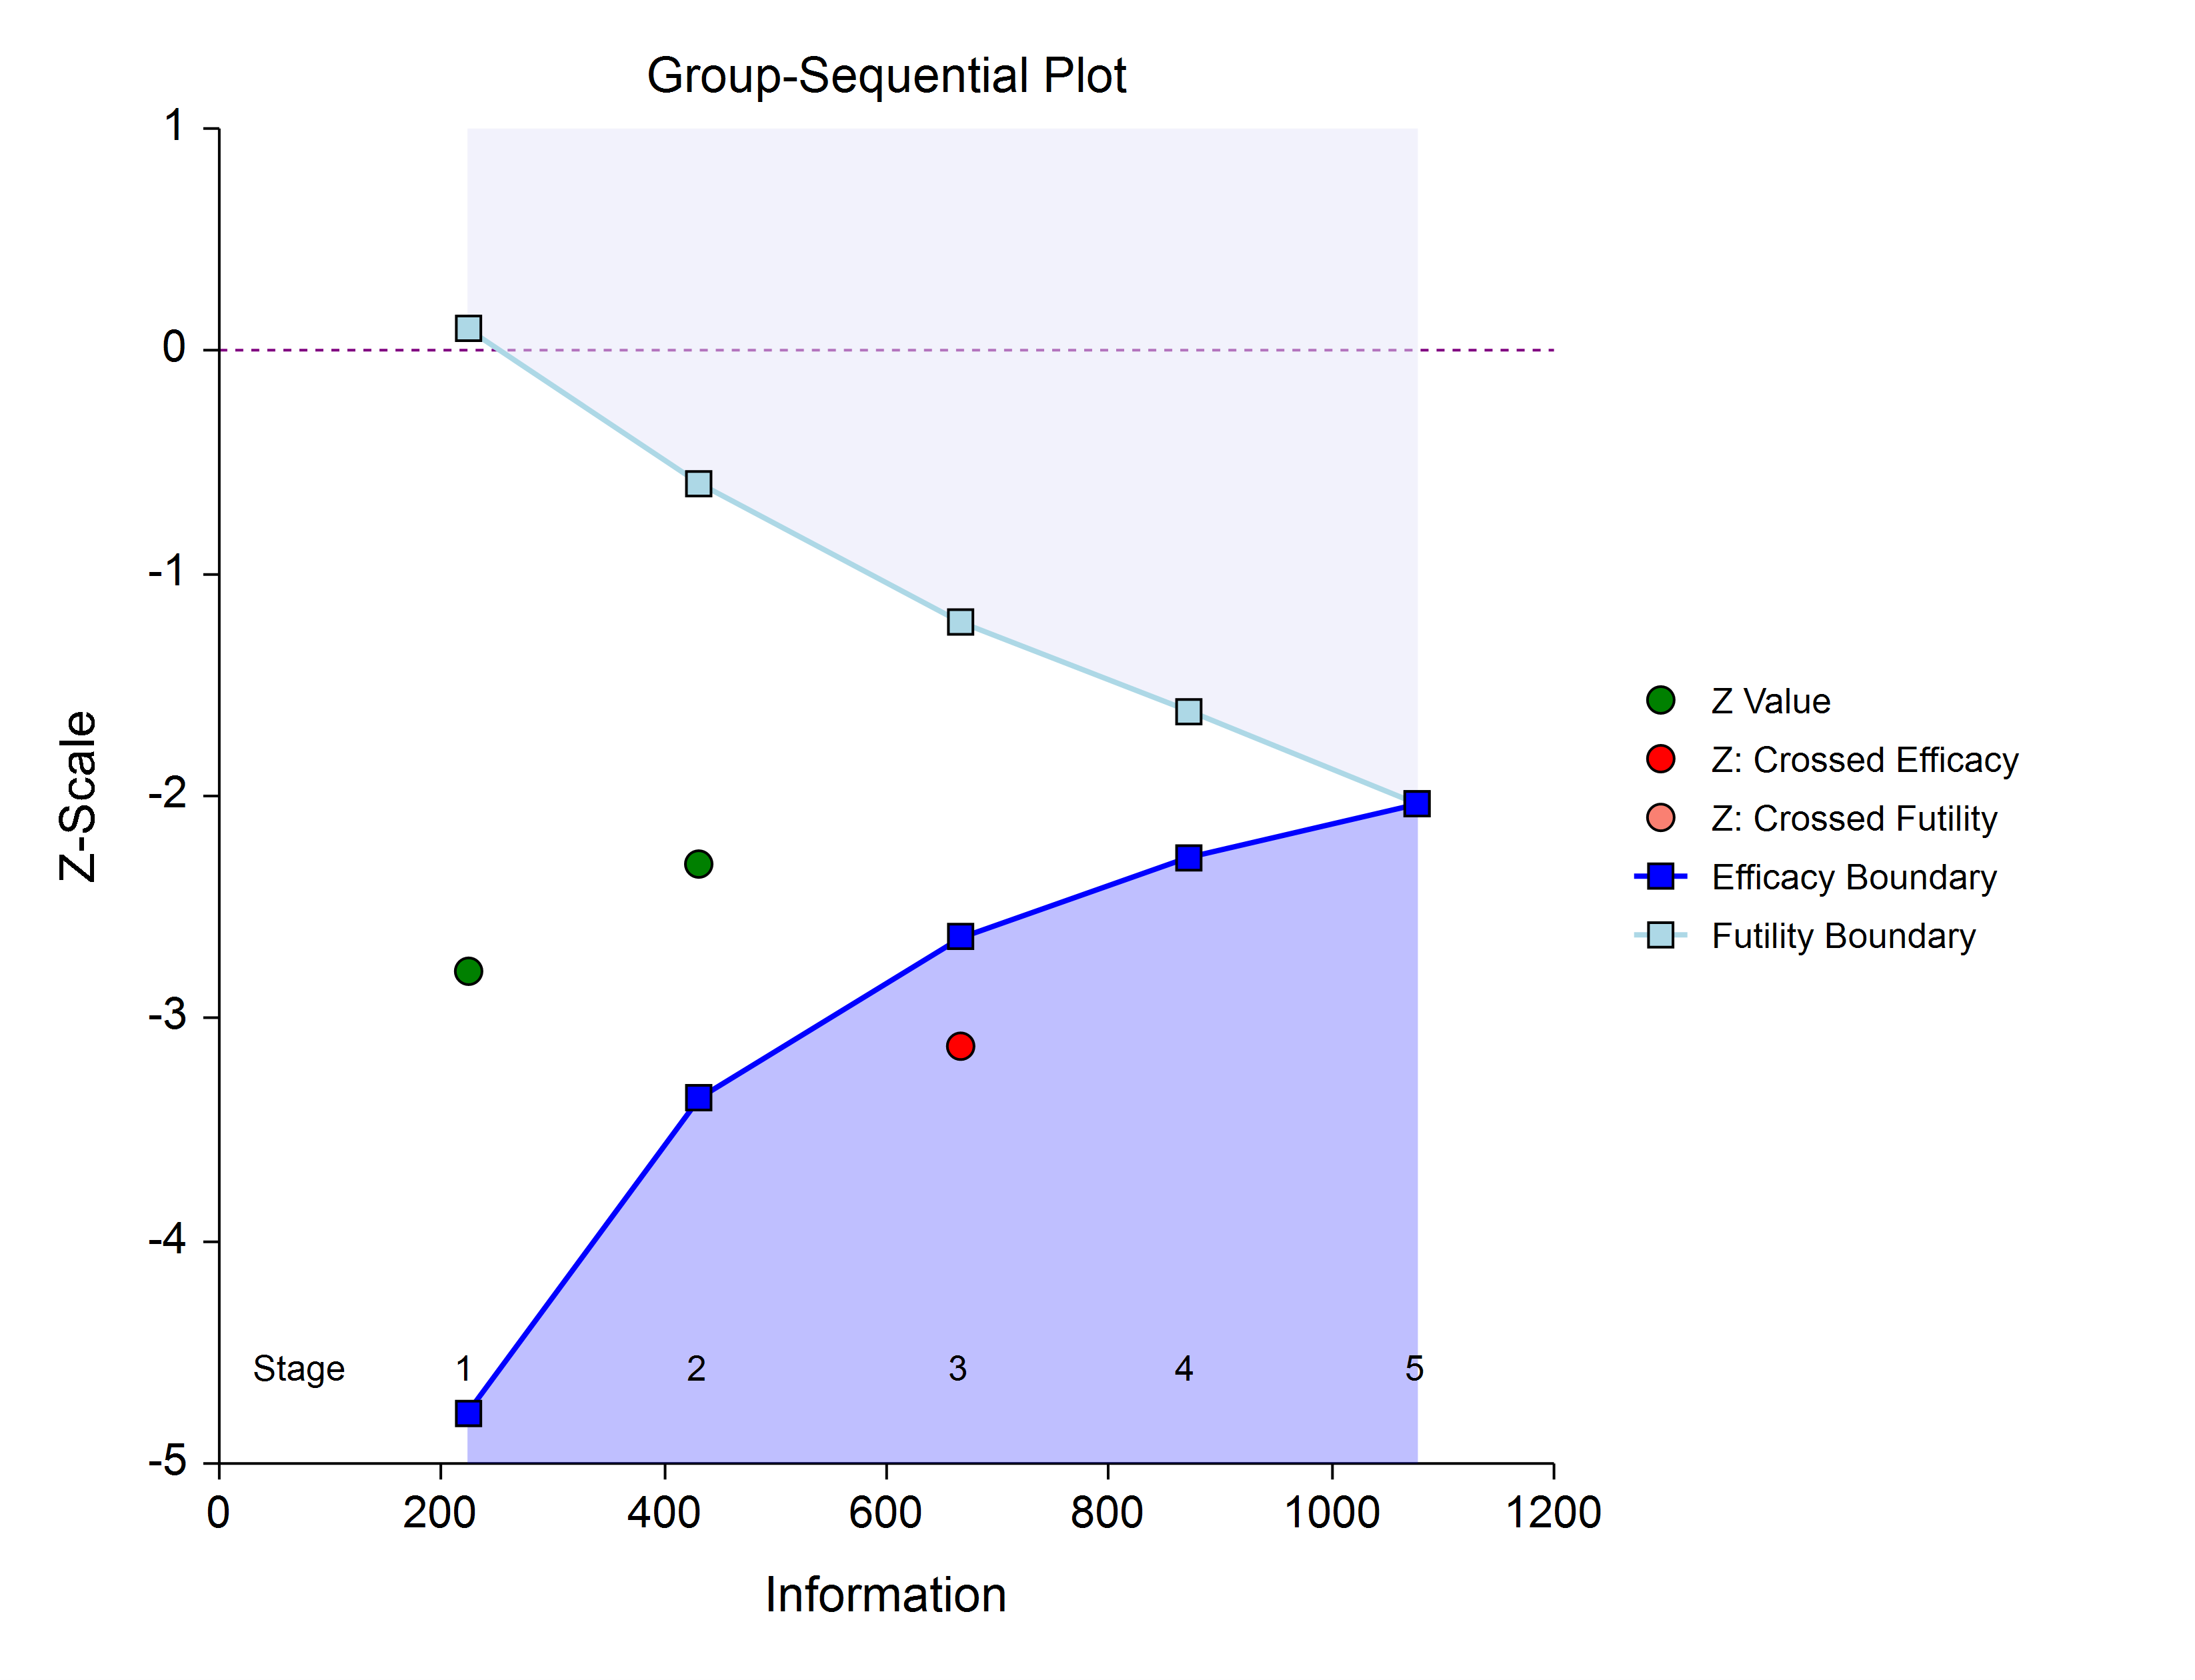
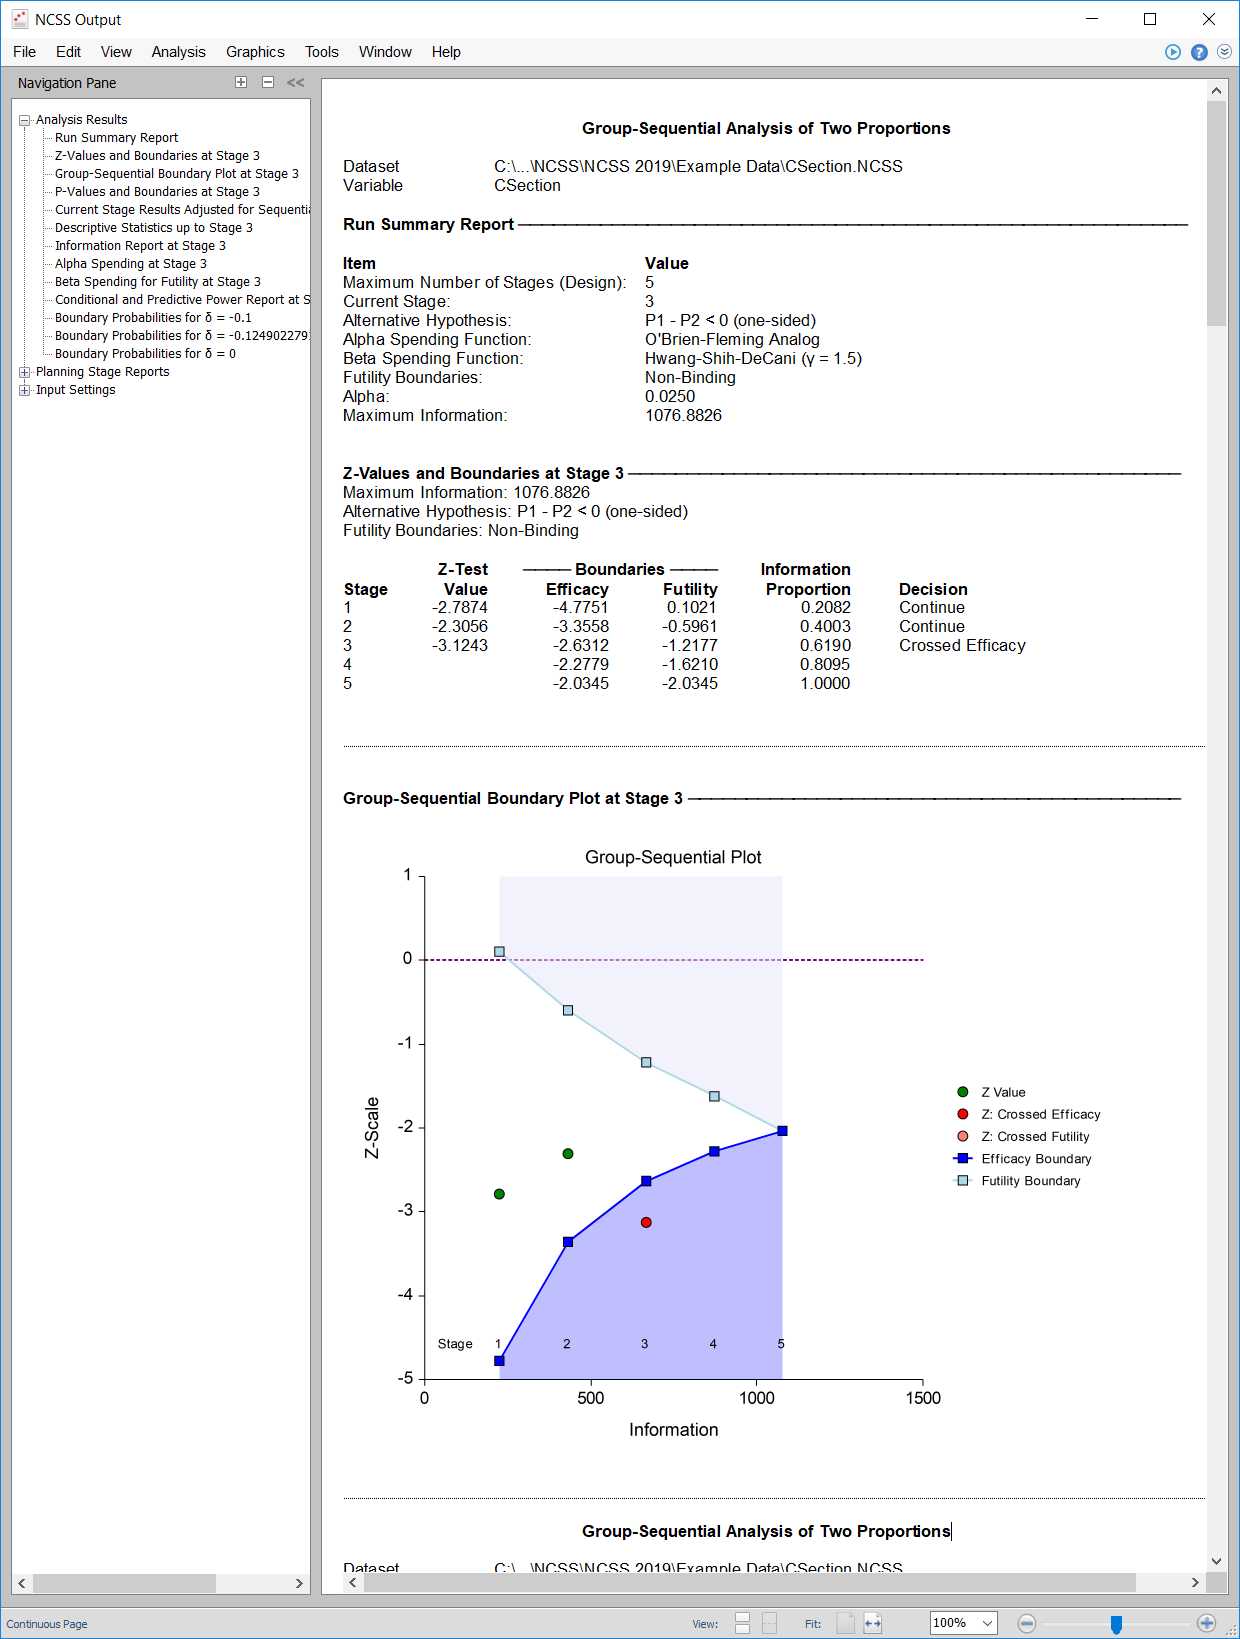
When data is gathered over time, it can be useful to make statistical comparisons when only portions of the data have been collected. Group-sequential analysis permits one to evaluate significant statistical difference at any stage in data collection. To accommodate this, and to maintain proper error control, the specified alpha and/or beta is apportioned according to appropriate alpha- or beta-spending functions. Boundaries for each stage are determined by the amount of data collected to that point (the information) and the amount of alpha or beta spent, as determined by the spending function(s). A group-sequential plot may be used to show the current progress of a group-sequential analysis.
Boundaries may be determined for either efficacy (significant difference), or futility (lack of evidence of difference), or both (as shown in the plot).
Technical Details
For in depth details of a group-sequential analysis, we refer the reader to the 'Documentation PDF' of each procedure, along with the referenced materials in that documentation. A brief outline is presented here.
Design Phase
In the design phase, an initial calculation of the sample size needed (if the final stage is reached) is made. Corresponding to each NCSS procedure for group-sequential analysis, there exists a companion procedure in PASS Sample Size software for making this calculation. This calculation requires the input of a number of parameters, including desired alpha, power, boundary types, maximum number of stages, spending functions, and assumed differences, among others. We refer the user to the PASS software and corresponding documentation for more details on sample size estimation.Group-Sequential Analysis Phase
The design phase gives the target number of subjects for the first stage. The study begins, and response data is collected for subjects, moving toward the first-stage target number of subjects, until a decision to perform an analysis on the existing data is made.Reporting Phase
Once a group-sequential boundary is crossed and the decision is made to stop, there remains the need to properly summarize and communicate the study results. Some or all of the following may be reported: Boundary plot showing the crossed boundary; Adjusted confidence interval and estimate of the mean difference; Sample size usedGroup-Sequential Analysis for Two Means with Known Variances
Because the group variances are rarely known in practice, this procedure may be more academic in nature. An understanding of this procedure can be helpful in better understanding the similar procedure based on T-Tests. The corresponding PASS Sample Size procedure is Group-Sequential Tests for Two Means with Known Variances (Simulation).
Group-Sequential T-Tests for Two Means
In this procedure, the underlying z-score calculations are used to produce corresponding t-statistic boundary calculations. Simulation-based sample-size re-estimation at each stage is a very useful part of this procedure. The corresponding PASS Sample Size procedure is Group-Sequential T-Tests for Two Means (Simulation).
Group-Sequential Analysis for Two Proportions
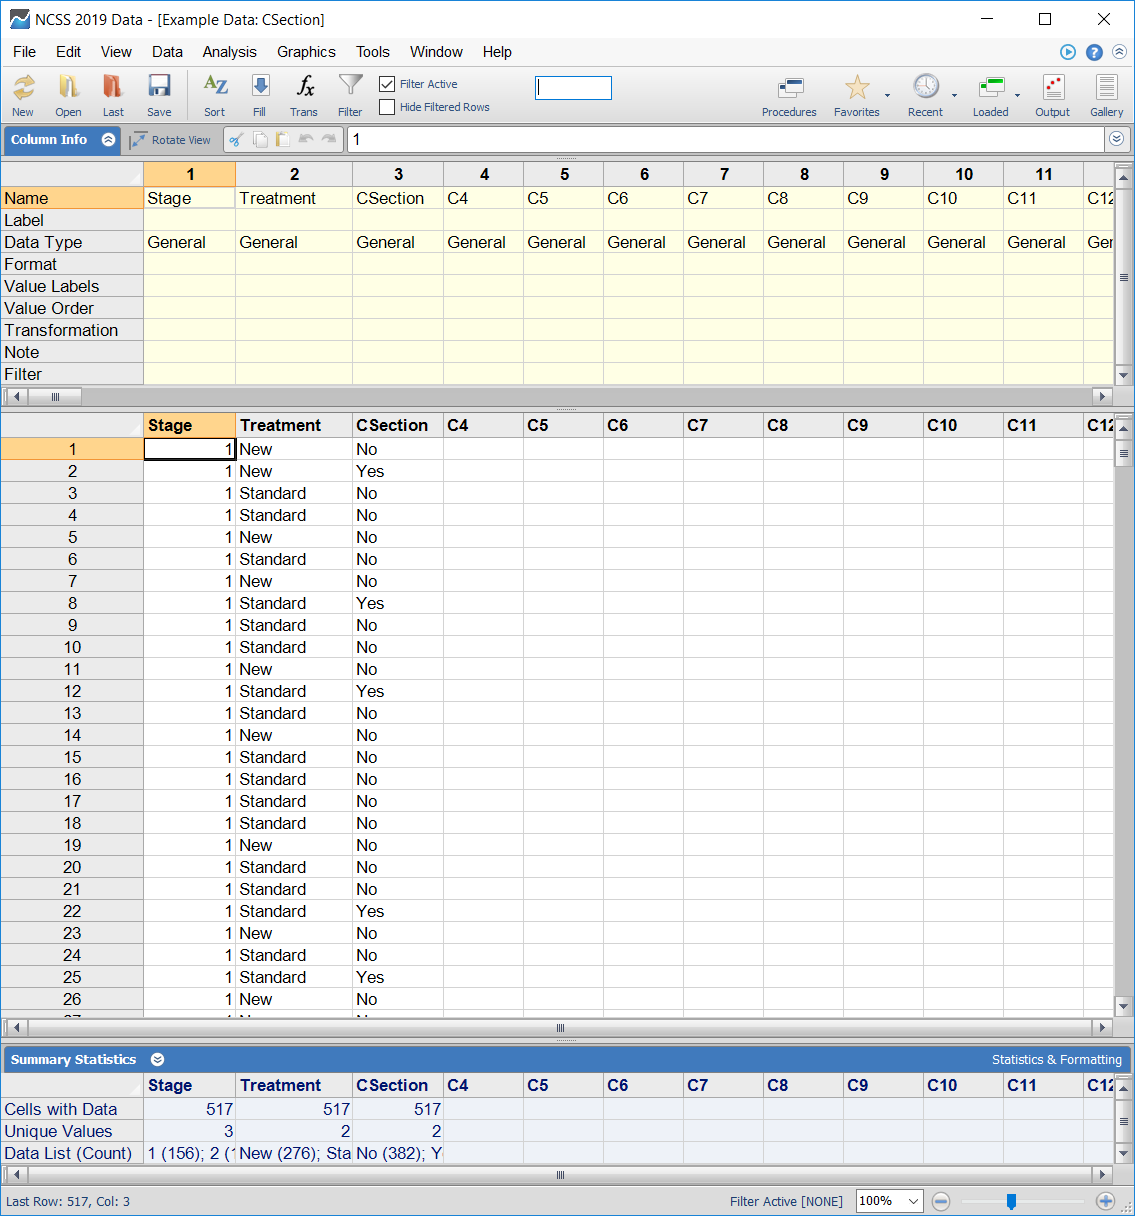
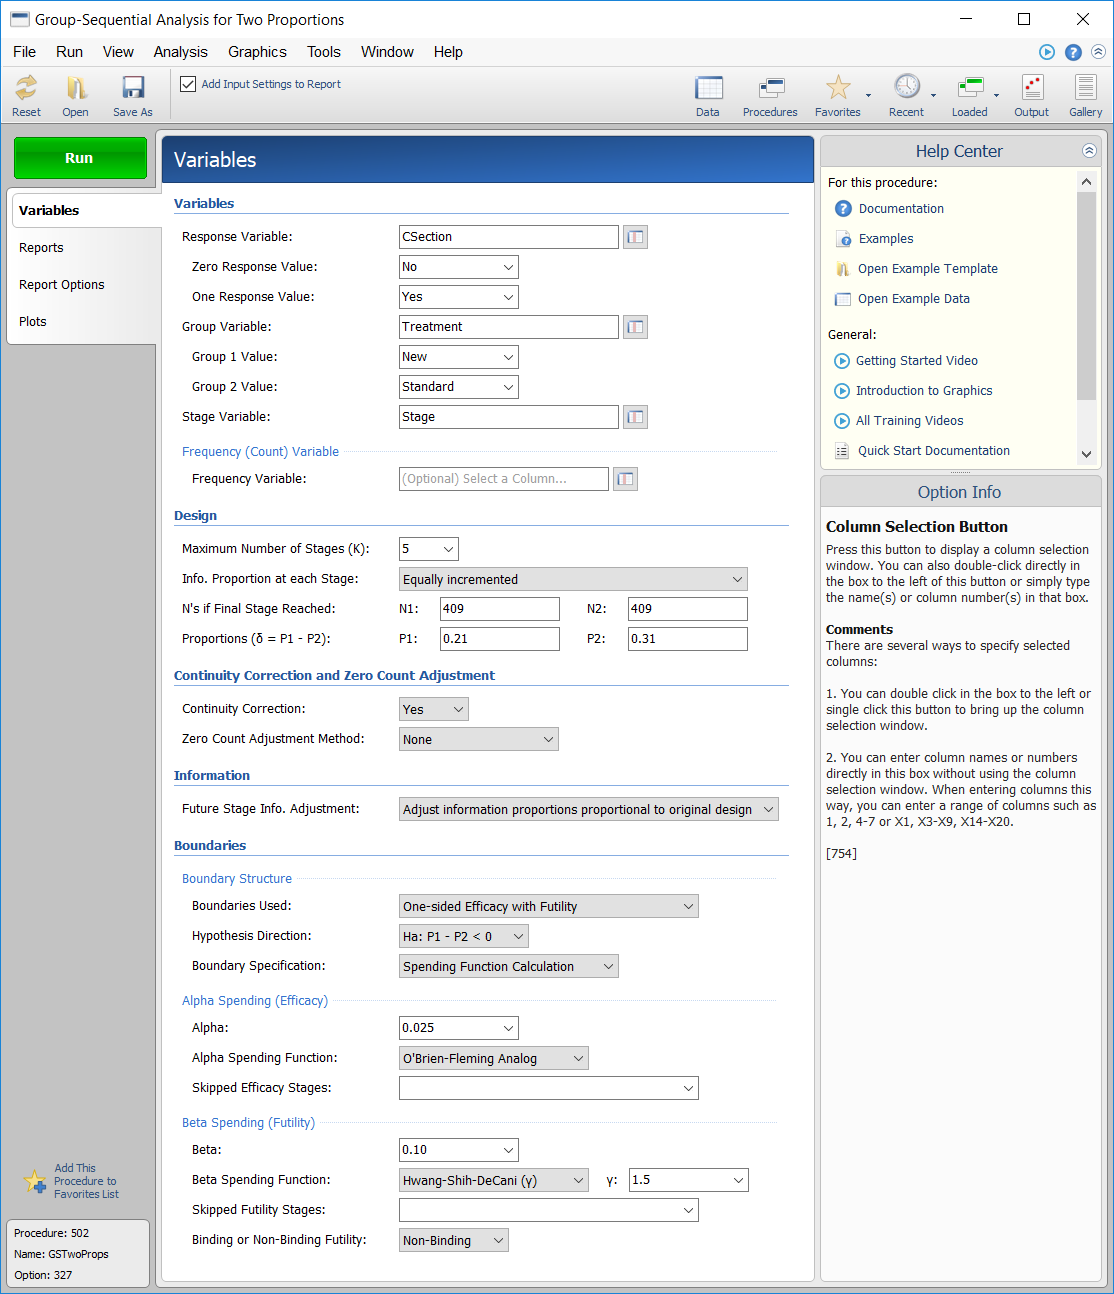
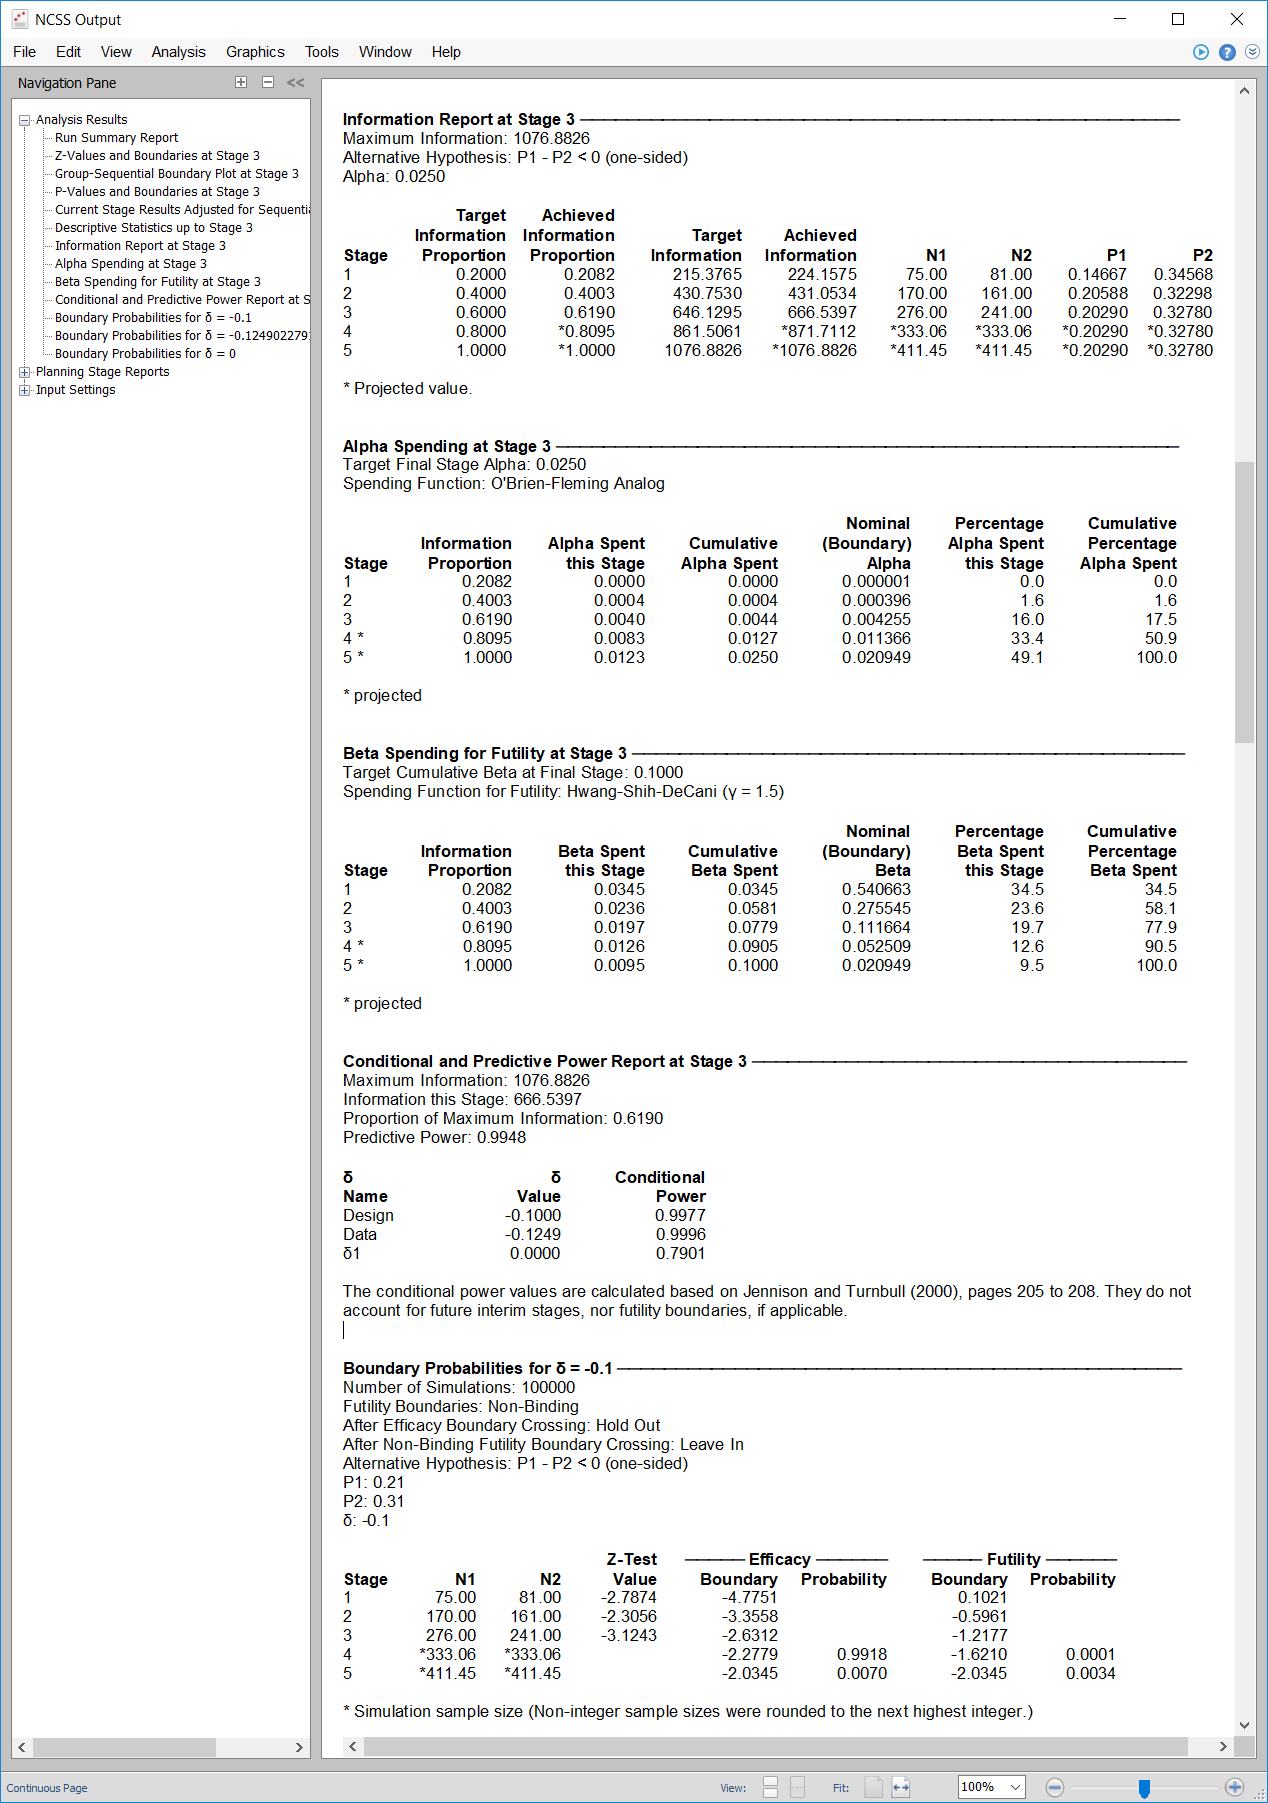
This procedure gives group-sequential tests for the common Wald Z-test, using the unpooled variance estimate, with or without the continuity correction. Simulation-based sample-size re-estimation at each stage is a very useful part of this procedure. The corresponding PASS Sample Size procedure is Group-Sequential Tests for Two Proportions (Simulation).
Group-Sequential Analysis for Two Hazard Rates
This procedure gives group-sequential tests for the difference of two hazard rates, assuming an underlying Exponential model. Simulation-based sample-size re-estimation at each stage is a very useful part of this procedure. The corresponding PASS Sample Size procedure is Group-Sequential Tests for Two Hazard Rates (Simulation).
