Sample Size for One Proportion in PASS
PASS contains over 20 tools for sample size estimation and power analysis of one proportion, including z-tests, equivalence, non-inferiority, confidence intervals, and conditional power, among others. Each procedure is easy-to-use and is carefully validated for accuracy. Use the links below to jump to a one proportion topic. For each procedure, only a brief summary of the procedure is given. For more details about a particular procedure, we recommend you
download and install the free trial of the software.
Jump to:
Introduction
For most of the sample size procedures in PASS for a single proportion, the user may choose to solve for sample size, power, or the population effect size in some manner. In the case of confidence intervals, one could solve for sample size or the distance to the confidence limit.
In a typical one proportion test procedure where the goal is to estimate the sample size, the user enters power, alpha, and the desired population proportion. The procedure is run and the output shows a summary of the entries as well as the sample size estimate. A summary statement is given, as well as references to the articles from which the formulas for the result were obtained.
For many of the parameters (e.g., power, alpha, sample size, proportions, etc.), multiple values may be entered in a single run. When this is done, estimates are made for every combination of entered values. A numeric summary of these is results is produced as well as easy-to-read sample size or power curve graphs.
Technical Details
This page provides a brief description of the tools that are available in PASS for power and sample size analysis of one proportion. If you would like to examine the formulas and technical details relating to a specific PASS procedure, we recommend you
download and install the free trial of the software, open the desired proportion procedure, and click on the help button in the top right corner to view the complete documentation of the procedure. There you will find summaries, formulas, references, discussions, technical details, examples, and validation against published articles for the procedure.
An Example Setup and Output
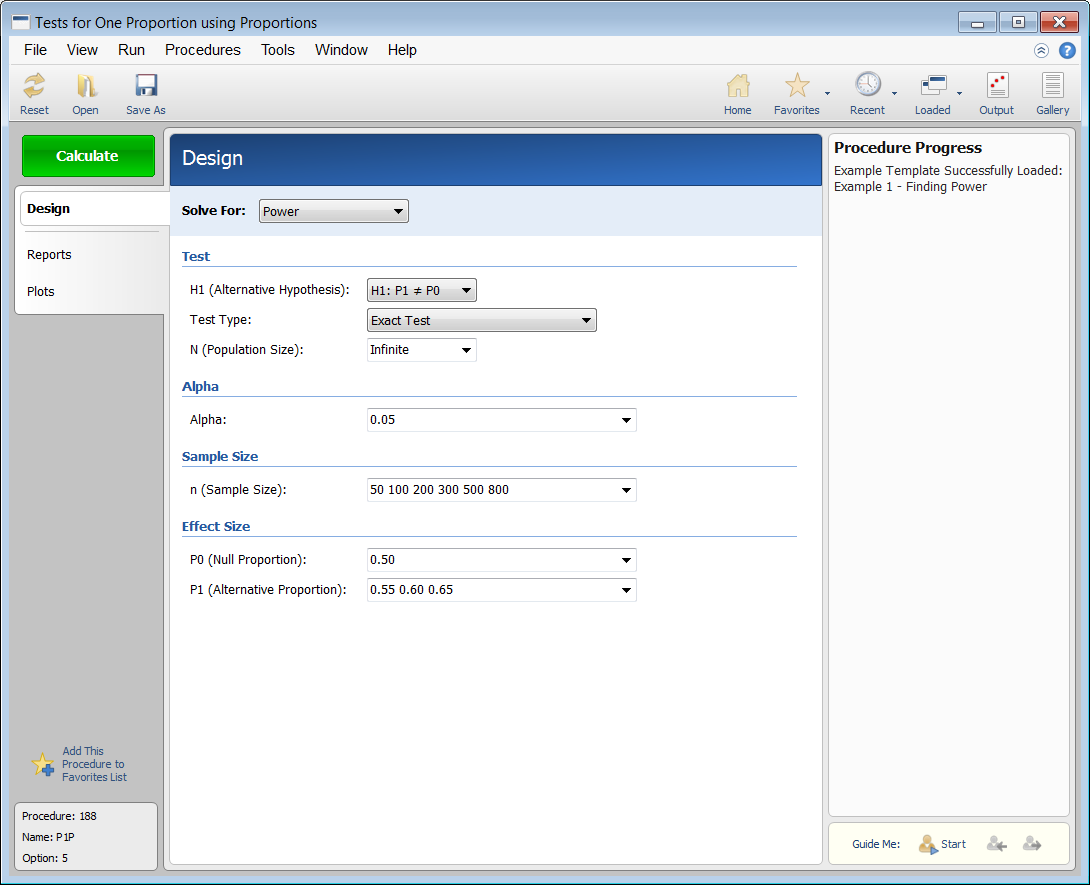
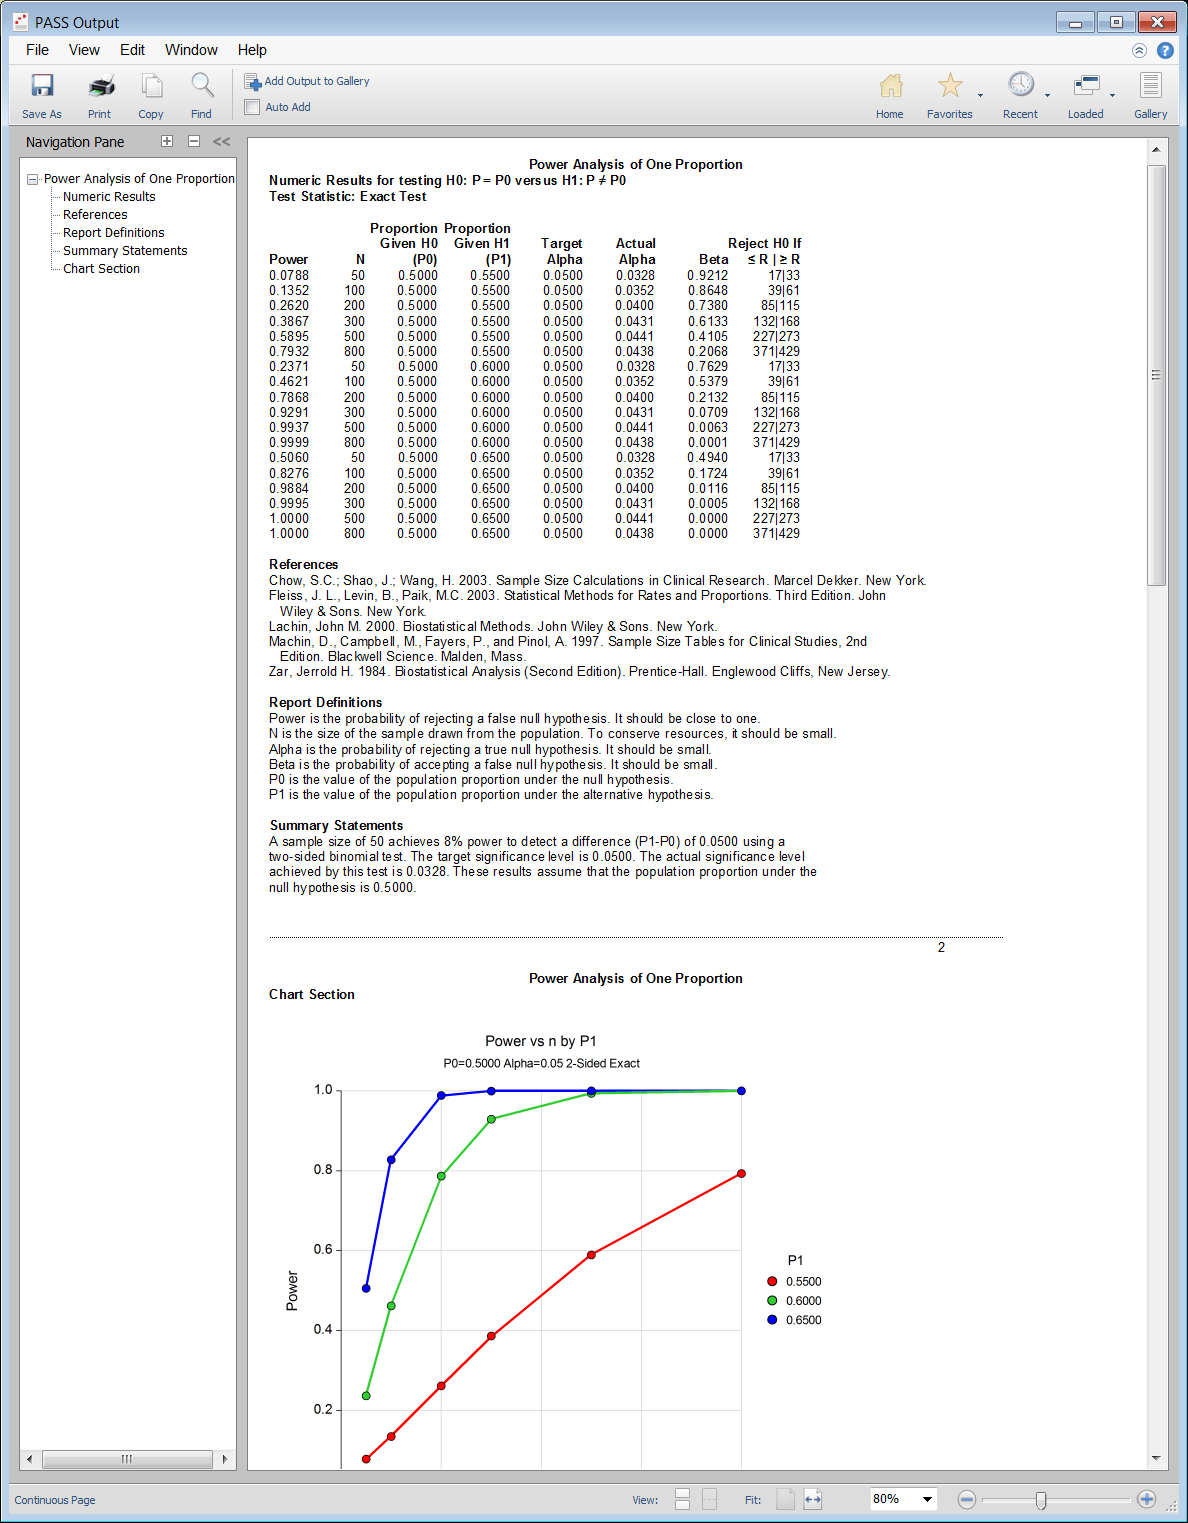
When the PASS software is first opened, the user is presented with the PASS Home window. From this window the desired procedure is selected from the menus, the category tree on the left, or with a procedure search. The procedure opens and the desired entries are made. When you click the Calculate button the results are produced. You can easily navigate to any part of the output with the navigation pane on the left.
PASS Home Window

Procedure Window for Tests for One Proportion

PASS Output Window

Sample Size for Inequality Tests for One Proportion
The One-Sample Proportion Test is used to assess whether a population proportion is significantly different from a hypothesized value. This is called the hypothesis of inequality. The hypotheses may be stated in terms of the proportions, the proportion difference, proportion ratio, or proportion odds ratio.
This procedure calculates sample size and statistical power for testing a single proportion using either exact or approximate tests. Results are based on exact calculations using the binomial and hypergeometric distributions. Because the analysis of several different test statistics is available, the statistical power may be compared to find the most appropriate test for a given situation. The test statistic options available include the one proportion exact test, and four versions of the z-test.
Four different input options are available for this procedure: the direct entry of the proportions, proportion differences, proportion ratios, and proportion odds ratios. A finite population correction is also available in these procedures.
Sample Size for Tests for One Proportion using Effect Size
This procedure provides sample size and power calculations for one- or two-sided hypothesis tests of the difference between a proportion and a given value (between 0 and 1) using the effect size. The details of procedure are given in Cohen (1988).
Sample Size for Confidence Invervals for One Proportion
The confidence intervals procedures permit the user to solve for sample size, confidence interval width, and confidence level. Exact, score, and asymptotic confidence interval methods can be specified. Both one-sided and two-sided tests can be examined. An additional procedure is available that permits the adjustment for a finite population size.
Sample Size for Confidence Invervals for One Proportion in a Stratified Design
This procedure calculates sample size and half-width for confidence intervals of a proportion from a stratified design in which the outcome variable is binary. It uses the results from elementary sampling theory which are presented in many works including Yamane (1967) and Levy and Lemeshow (2008).
Suppose that the response proportion of a binary outcome variable of a sample from a population of subjects (or items) is to be estimated with a confidence interval. Further suppose that the population can be separated into a few subpopulations, often called strata. If these strata are created so that items are similar within a particular stratum, but quite different between strata, then a stratified design might be adopted for a number of reasons. Note that the population may be finite or infinite.
This procedure allows you to determine the appropriate sample size to be taken from each stratum so that various parameters of the confidence interval are guaranteed. These parameters include the confidence level and width of the interval.
Sample Size for Confidence Invervals for One Proportion in a Cluster-Randomized Design
This procedure calculates sample size and half-width for confidence intervals of a proportion from a cluster design in which the outcome variable is binary. It uses the results from Ahn, Heo, and Zang (2015), Lohr (2019), and Campbell and Walters (2014).
Suppose that the proportion of a binary outcome variable of a sample from a population of subjects (or items) is to be estimated with a confidence interval. Further suppose that the population is separated into small groups, called clusters. These clusters may contain different numbers of items.
This procedure allows you to determine the appropriate number of clusters to be sampled so that the width of a confidence interval of the proportion may be guaranteed at a certain confidence level.
Sample Size for Confidence Invervals for One Proportion in a Stratified Cluster-Randomized Design
This procedure calculates sample size and half-width for confidence intervals of a proportion from a stratified cluster randomization trial (CRT) in which the outcome variable is binary. It uses the results from elementary sampling theory which are presented in Xu, Zhu, and Ahn (2019).
Suppose that the response proportion of a binary outcome variable of a sample from a population of subjects (or items) is to be estimated with a confidence interval. Further suppose that the population can be separated into a few subpopulations, often called strata. Further suppose that each stratum can be separated into a number of clusters and that sampling occurs at the cluster level. That is, a simple random sample of clusters is drawn within a stratum. Next, a simple random sample of subjects is drawn from within each cluster.
Note that this procedure assumes an infinite population in which the size of every cluster and every stratum is not know.
This procedure allows you to determine the appropriate sample size to be taken from each stratum so that width of the confidence interval is guaranteed.
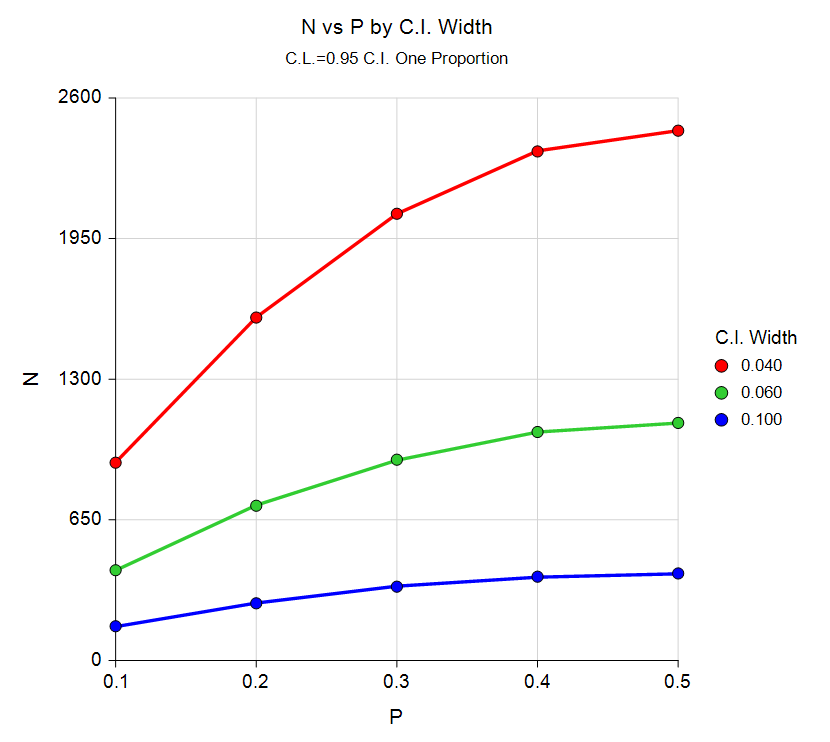
Sample Size Curve from the Confidence Intervals for One Proportion Procedure

Sample Size for Non-Inferiority Tests for One Proportion
The Non-Inferiority Tests for One Proportion procedures provide power analysis and sample size calculation for non-inferiority tests in one-sample designs in which the outcome is binary. Users may choose from among popular test statistics commonly used for running the hypothesis test. These tests include the exact test and four versions of the z-test.
Approximate sample size formulas for non-inferiority tests of a single proportion are presented in Chow et al. (2003). However, only large sample (normal approximation) results are given there. The results available in this procedure use exact calculations based on the enumeration of all possible values of the binomial distribution.
Four different input options are available for this procedure: the direct entry of the proportions, proportion differences, proportion ratios, and proportion odds ratios.
Sample Size for Equivalence Tests for One Proportion
There are four procedures providing different input options for equivalence tests of one proportion: direct entry of the proportions, proportion differences, proportion ratios, and proportion odds ratios. An exact test or one of four z-tests may be specified. Flexible upper and lower equivalence proportions are permitted. The results available in this procedure use exact calculations based on the enumeration of all possible values of the binomial distribution.
Sample Size for Phase II Clinical Trials
There are three one proportion Phase II clinical trials procedures available in PASS:
- Single-Stage Phase II Clinical Trials
- Two-Stage Phase II Clinical Trials
- Three-Stage Phase II Clinical Trials
Sample Size for Single-Stage Designs
Phase II clinical trials determine whether a drug or regimen has sufficient activity against disease to warrant more extensive study and development. In a single-stage design, a single group of patients is studied. Usually, investigators will know the response rate of other drugs against the disease. Unless the current drug can be shown to be significantly more effective, its use will not be pursued.
The single-stage procedure finds designs that meet the error rate (alpha and beta) criterion and minimize the sample size when an exact test of proportions is used. The algorithm, discussed by A’Hern (2001), is an exact version of the algorithm of Fleming (1982).
Sample Size for Two-Stage Designs
In a two-stage design, the patients are divided into two groups or stages. At the completion of the first stage, an interim analysis is made to determine if the second stage should be conducted. If the number of patients responding is greater than a certain amount, the second stage is conducted. Otherwise, it is not.
The two-stage procedure in PASS finds designs that meet the error rate (alpha and beta) criterion and minimize the expected sample size. The algorithm is discussed in Simon (1989). Extending Simon’s work, our algorithm allows the investigation of near-optimal designs that may have other useful properties.
Sample Size for Three-Stage Designs
In a three-stage design, the patients are divided into three groups or stages. At the completion of the first stage, an interim analysis is made to determine if the second stage should be conducted. If the number of patients responding is greater than a certain amount, the second stage is conducted. Otherwise, it is not. A similar interim analysis is conducted at the end of the second stage.
The three-stage design procedure in PASS finds designs that meet the error rate (alpha and beta) criterion and minimize the expected sample size. The formulation is given in Chen (1997). Extending Chen’s work, our algorithm allows the investigation of near-optimal designs that may have other useful properties.
Sample Size for Post-Marketing Surveillance
Post-marketing surveillance refers to the search for adverse reactions to drugs that have been cleared for general use. Two types of study designs are often used: the cohort study and the case-control study. In a cohort design, a large group of treated patients are studied to determine the frequency of any adverse reactions. In a case-control study, patients who have experienced the adverse reaction are matched with other treated patients who have not.
The Post-Marketing Surveillance procedure in PASS permits the user to examine power and sample size for four design types:
- Cohort Study, No Background Incidence of Adverse Reactions
- Cohort Study, Known Background Incidence of Adverse Reactions
- Cohort Study, Unknown Background Incidence of Adverse
Reactions
- Matched Case-Control Study
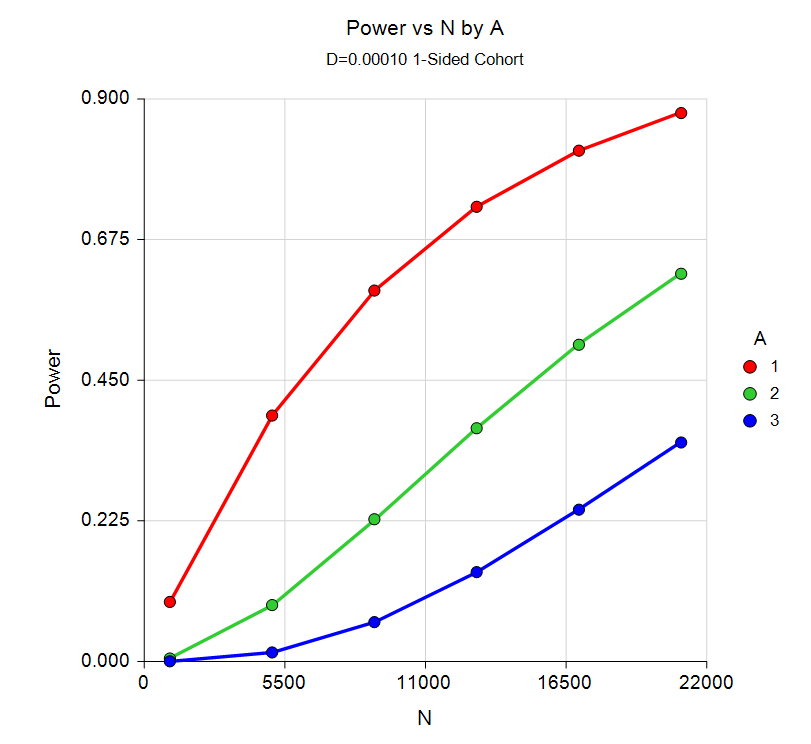
Power Curve from the Post-Marketing Surveillance Procedure

Sample Size for Conditional Power of One Proportion Tests
In sequential designs, one or more intermediate analyses of the emerging data are conducted to evaluate whether the experiment should be continued. This may be done to conserve resources or to allow a data monitoring board to evaluate safety and efficacy when subjects are entered in a staggered fashion over a long period of time. Conditional power (a frequentist concept) is the probability that the final result will be significant, given the data obtained up to the time of the interim look. Predictive power (a Bayesian concept) is the result of averaging the conditional power over the posterior distribution of effect size. Both of these methods fall under the heading of stochastic curtailment techniques.
This procedure computes conditional and predicted power for the case when a one-proportion z test is used to test whether a population proportion is greater than, less than, or not equal to a specific value.
Conditional power procedures are also available in PASS for the case of non-inferiority and superiority by a margin.
Sample Size for Two-Stage Designs for Tests of One Proportion (Simon)
This module finds two-stage designs for exact tests of a single proportion that meet the error rate (type-I and type-II) criterion and minimize the expected sample size. An algorithm, presented by Simon (1989), finds the designs with the minimum N (minimax) and the minimum expected N (optimum). Extending Simon’s work, Jung, Lee, Kim, George (2004) discuss other designs which are optimum from a Bayesian point of view which they call admissible designs.
In a two-stage design, the subjects are divided into two groups or stages. At the completion of the first stage, an interim analysis is made to determine if the second stage should be conducted. If the number of patients responding is greater than a certain amount, the second stage is conducted. Otherwise, it is not.


