Analysis of Two-Way Tables in NCSS
NCSS has a wide range of tools for analyzing two-way table (or contingency table) data. All of the tools in NCSS are validated for accuracy and are easy to learn and use.
Use the links below to jump to the two-way table analysis topic you would like to examine. For more details about a particular procedure, we recommend you
download and install the free trial of the software.
Jump to:
Introduction
Two-way tables are used in statistical analysis to summarize the relationship between two categorical variables. Two-way tables are also known as contingency, cross-tabulation, or crosstab tables. The levels of one categorical variable are entered as the rows in the table and the levels of the other categorical variable are entered as the columns in the table. If Variable 1 has
r levels and Variable 2 has
c levels, then the data can be summarized in an
r x
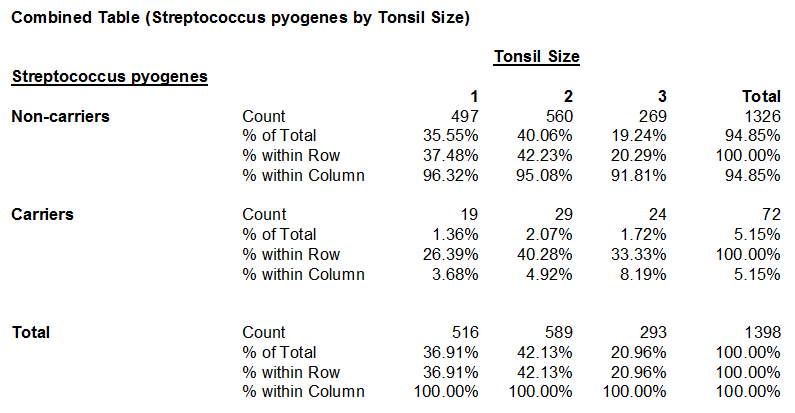
c contingency table. The categorical data are summarized as counts (i.e. frequencies) corresponding to each combination of levels within the two variables and are entered in individual cells in the table. Percentages within rows, columns, and of the overall total are often included in two-way table output.
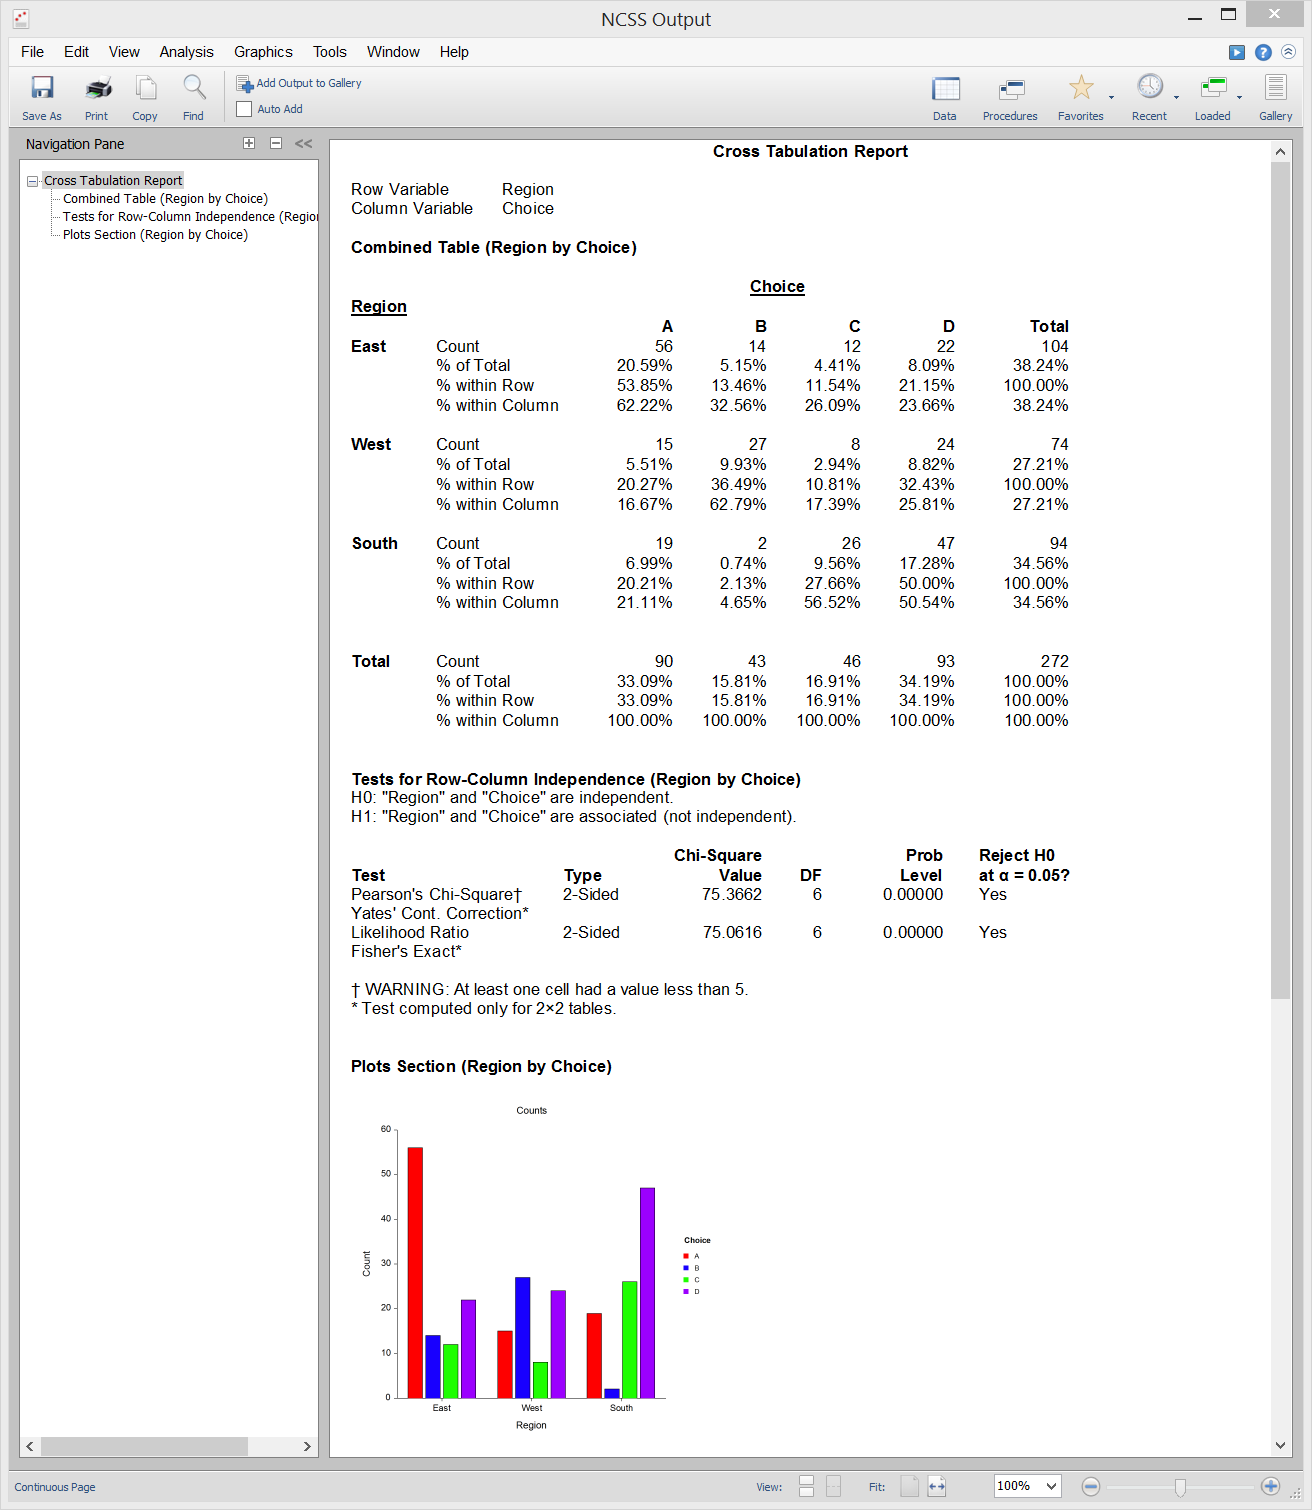
The following is an example of a two-way table from NCSS displaying cell counts and various table percentages:
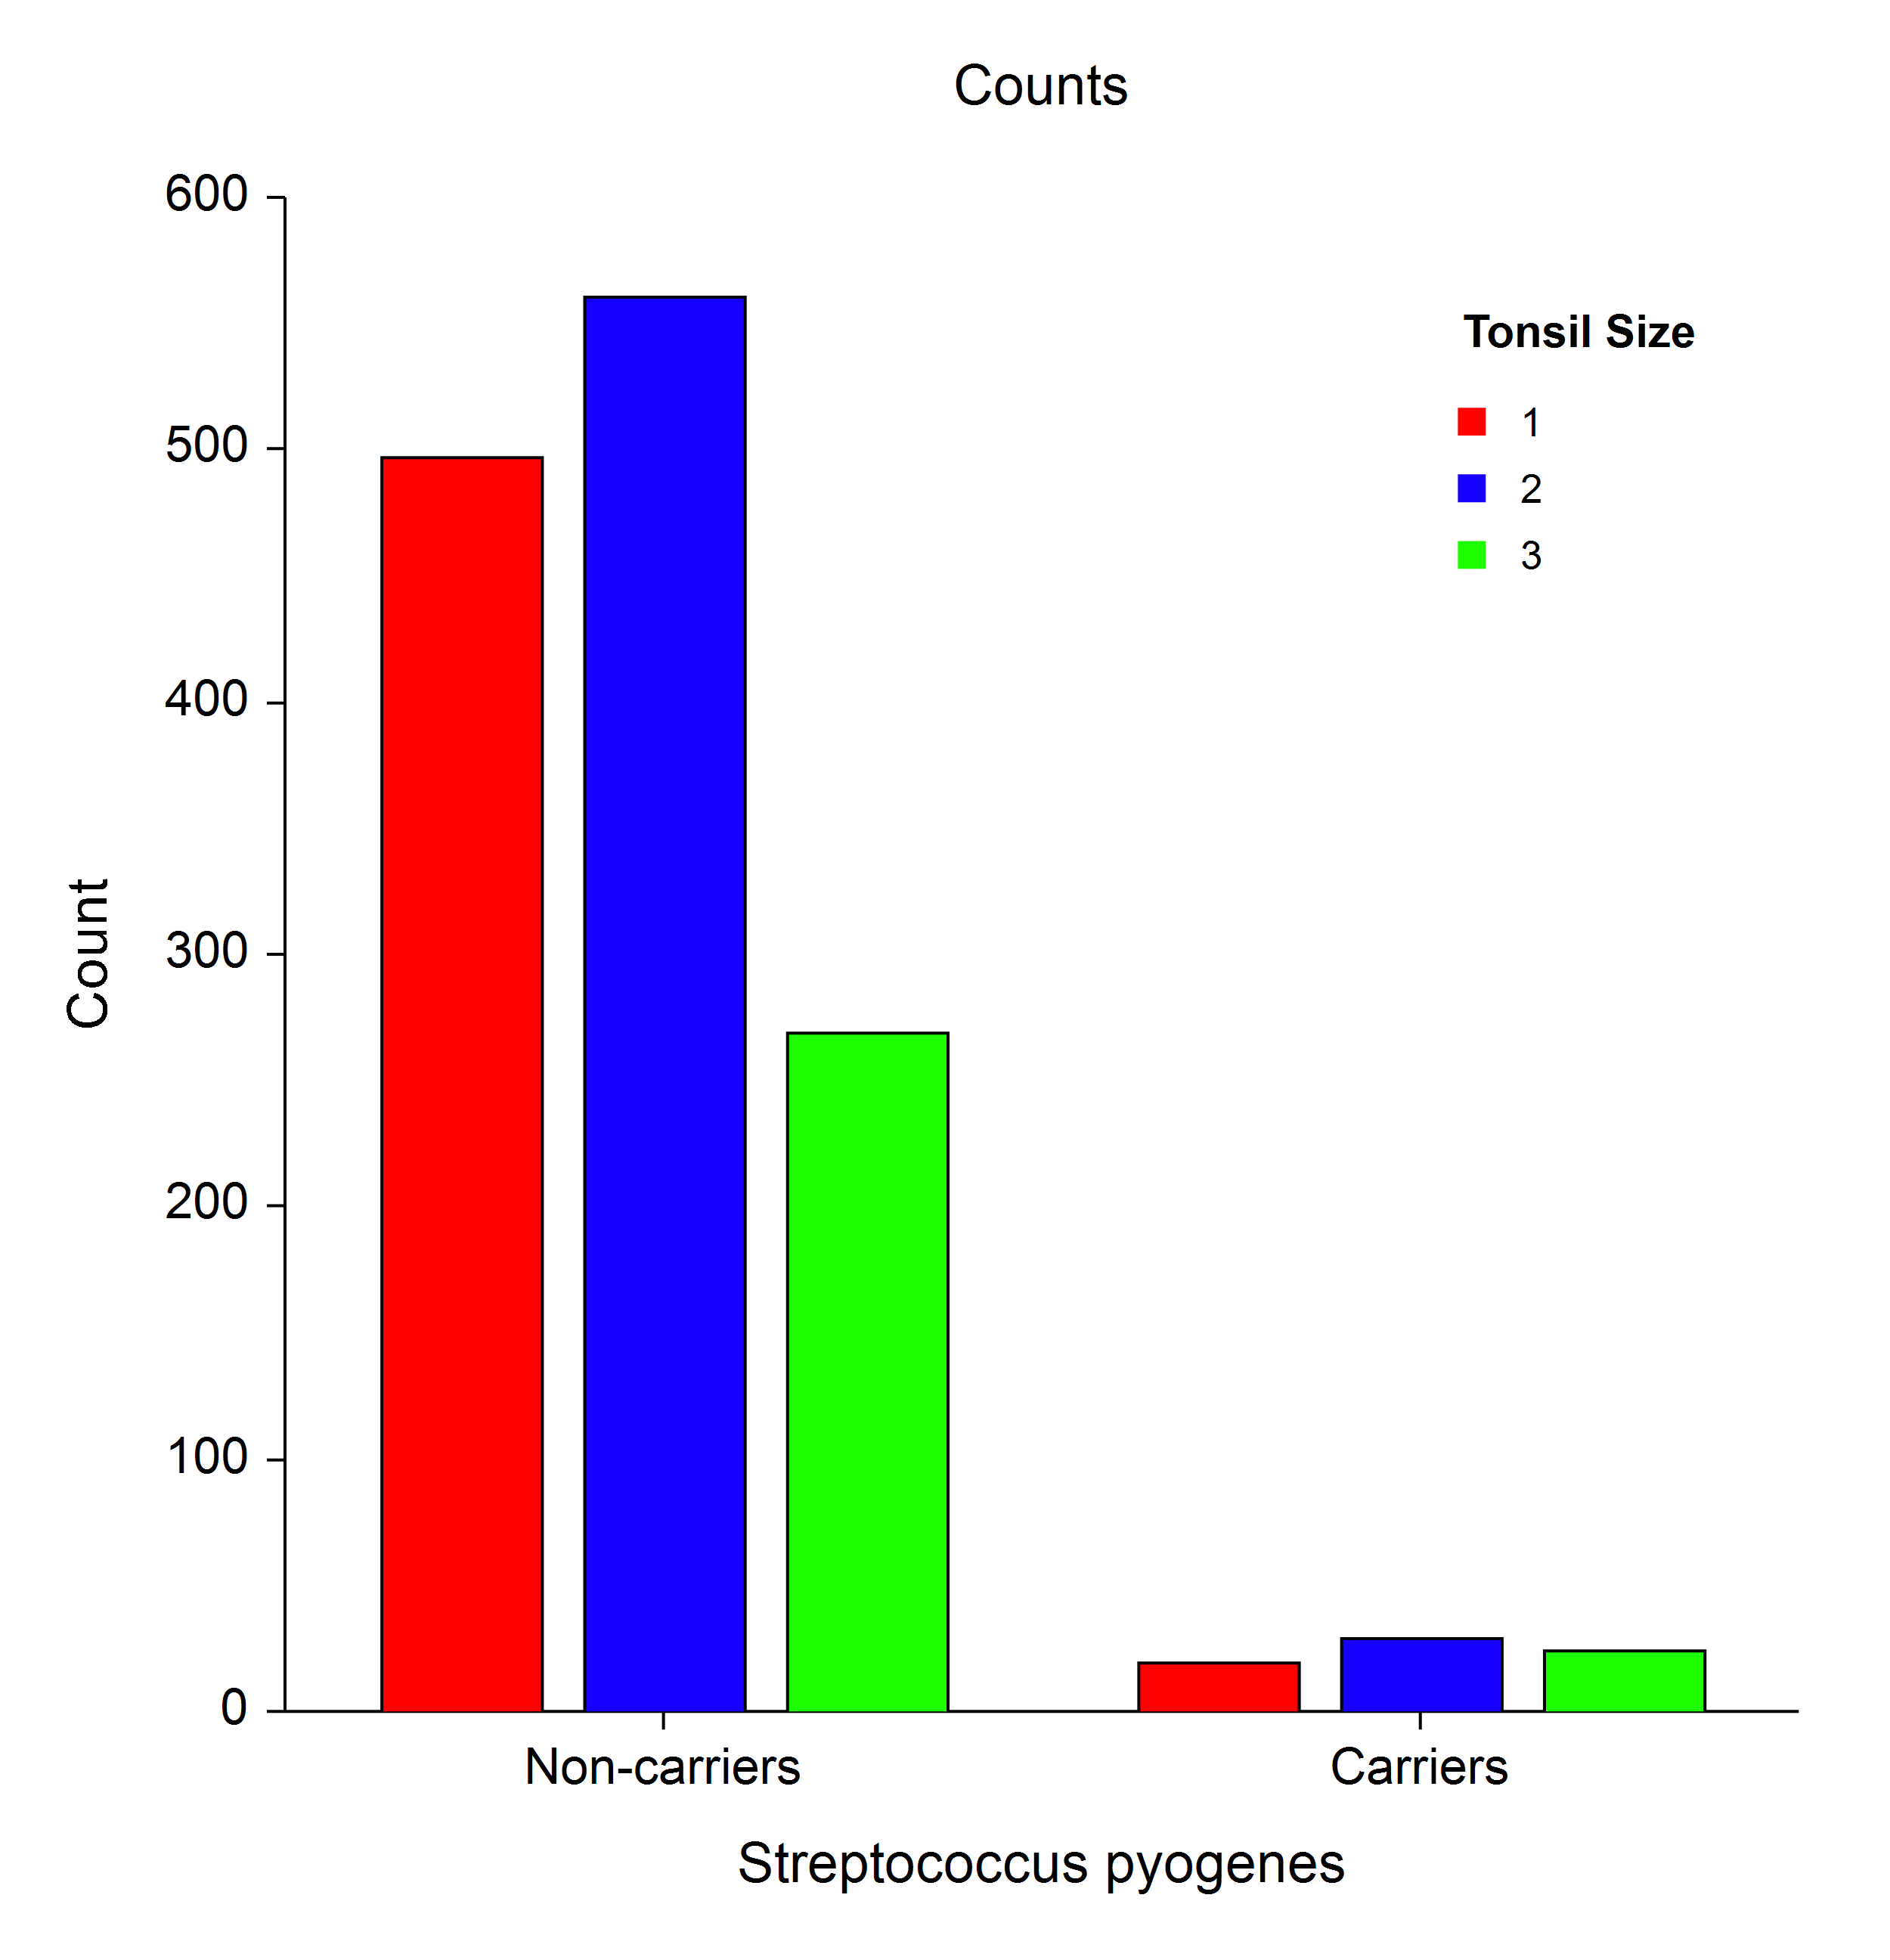
The two-way table data can also be presented in a simple two-factor bar chart:
A wide variety of analyses can be performed on two-way table data, depending on the study design and research objectives. This page outlines the analyses available in NCSS for two-way table data.
Technical Details
This page is designed to give a general overview of the capabilities of NCSS for analyzing two-way table data. If you wish to see the formulas and technical details relating to a particular NCSS procedure, we recommend you
download and install the free trial of the software, open the two-way table analysis procedure of interest, and click on the help button in the top right corner to view the complete documentation of the procedure. There you will find references, formulas, discussions, and examples/tutorials describing the procedure in detail.
Two-Way Contingency Tables (Crosstabs / Chi-Square Test)
The Contingency Tables procedure in NCSS produces tables of counts and percentages for the joint distribution of two categorical variables. When a breakdown of more than two variables is desired, you can specify up to eight grouping (break) variables in addition to the two table variables. A separate table is generated for each unique set of values of these grouping variables.
This procedure serves as a summary reporting tool and is often used to analyze survey data. It calculates most of the popular two-way table statistics and tests such as Pearson’s Chi-Square Test for Row-Column Independence, Fisher’s Exact Test (for 2 x 2 tables only), the McNemar Test for matched samples, as well as the Cochran-Armitage test for trend in proportions and the Kappa and weighted Kappa tests for inter-rater agreement.
This procedure also produces a broad set of association and correlation statistics for contingency tables: Phi, Cramer’s V, Pearson’s Contingency Coefficient, Tschuprow’s T, Lamba, Kendall’s Tau, and Gamma.
Plots based on counts, table percentages, row percentages, column percentages, expected counts, chi-square contributions, deviations from independence, and standardized residuals may also be produced.
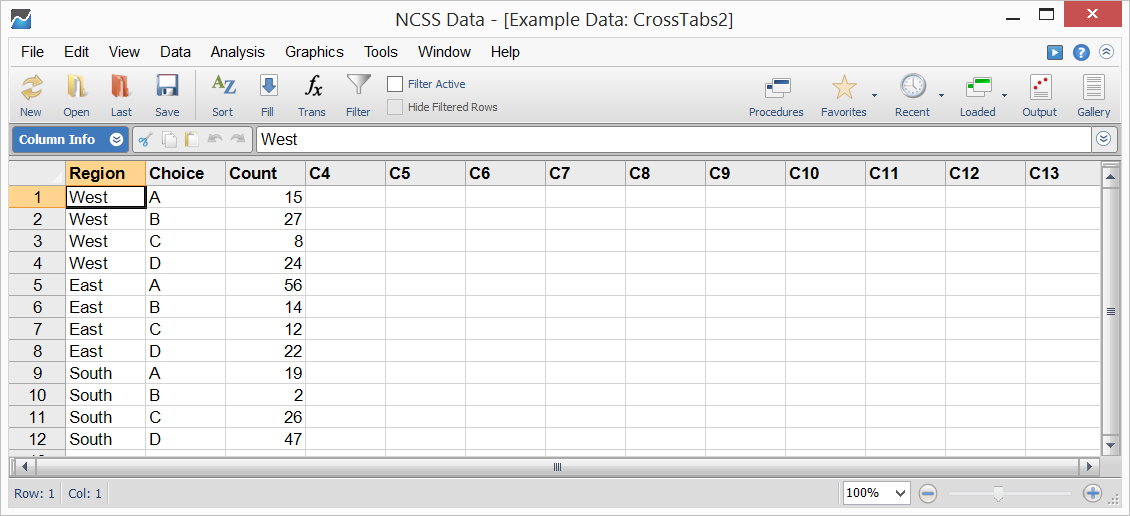
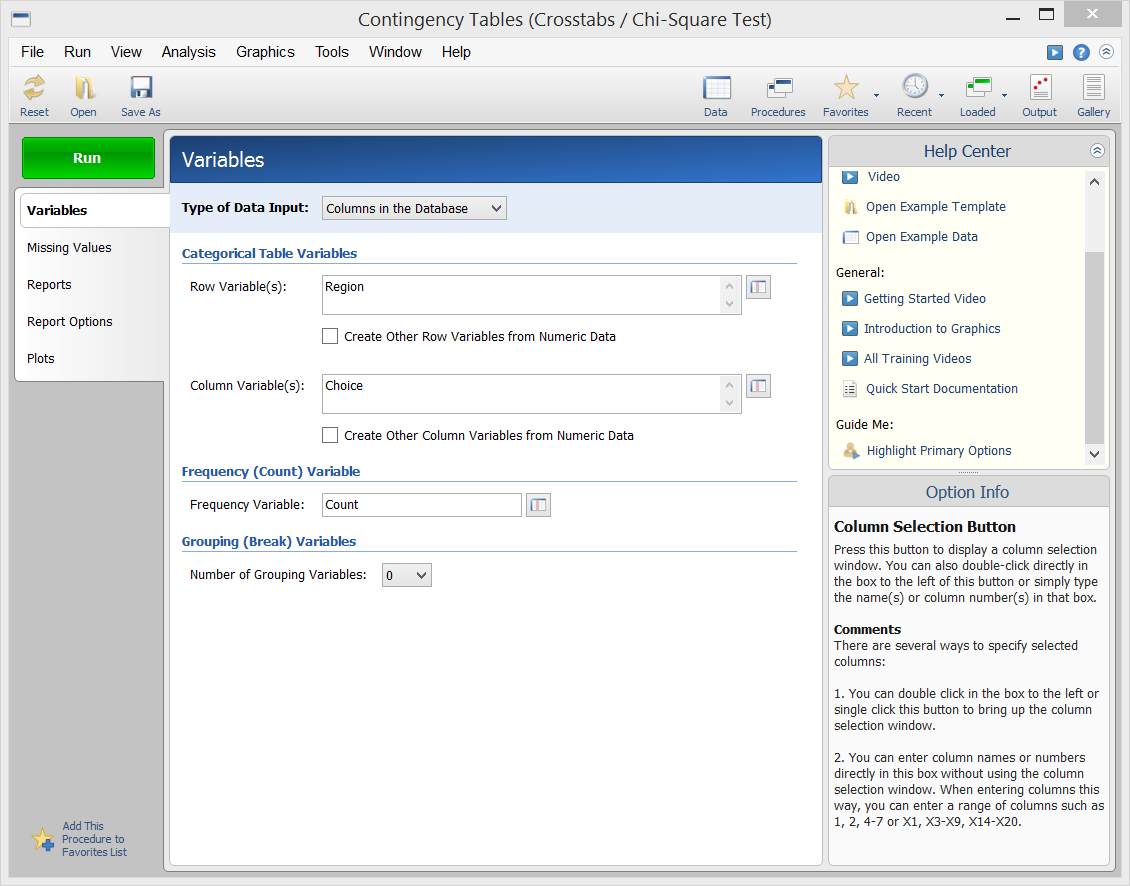
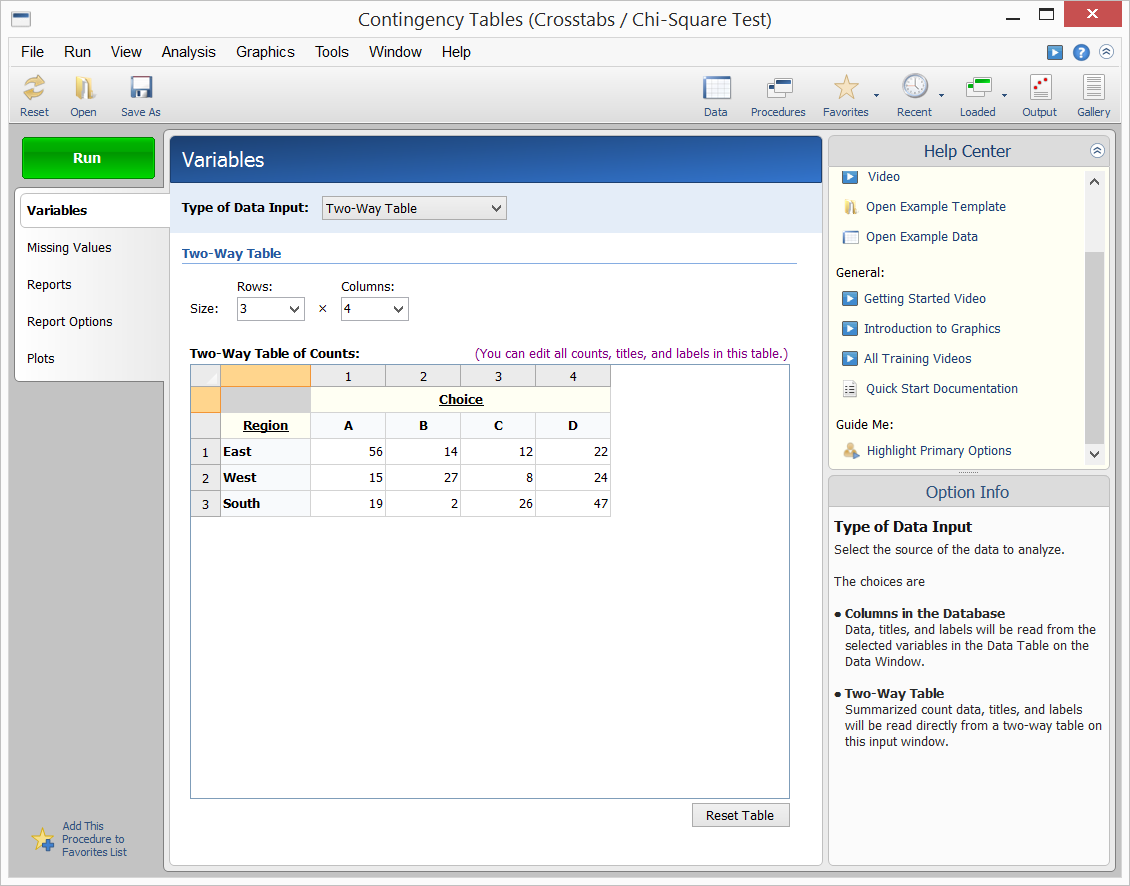
The Contingency Tables procedure is able to process raw categorical data directly from the database, tabulated data stored in the database, or a two-way table entered directly into the procedure window.
Sample Summarized Data for Database Input
Procedure Input - Database Input
Procedure Input - Direct Two-Way Table Input
Sample Output
Frequency Tables
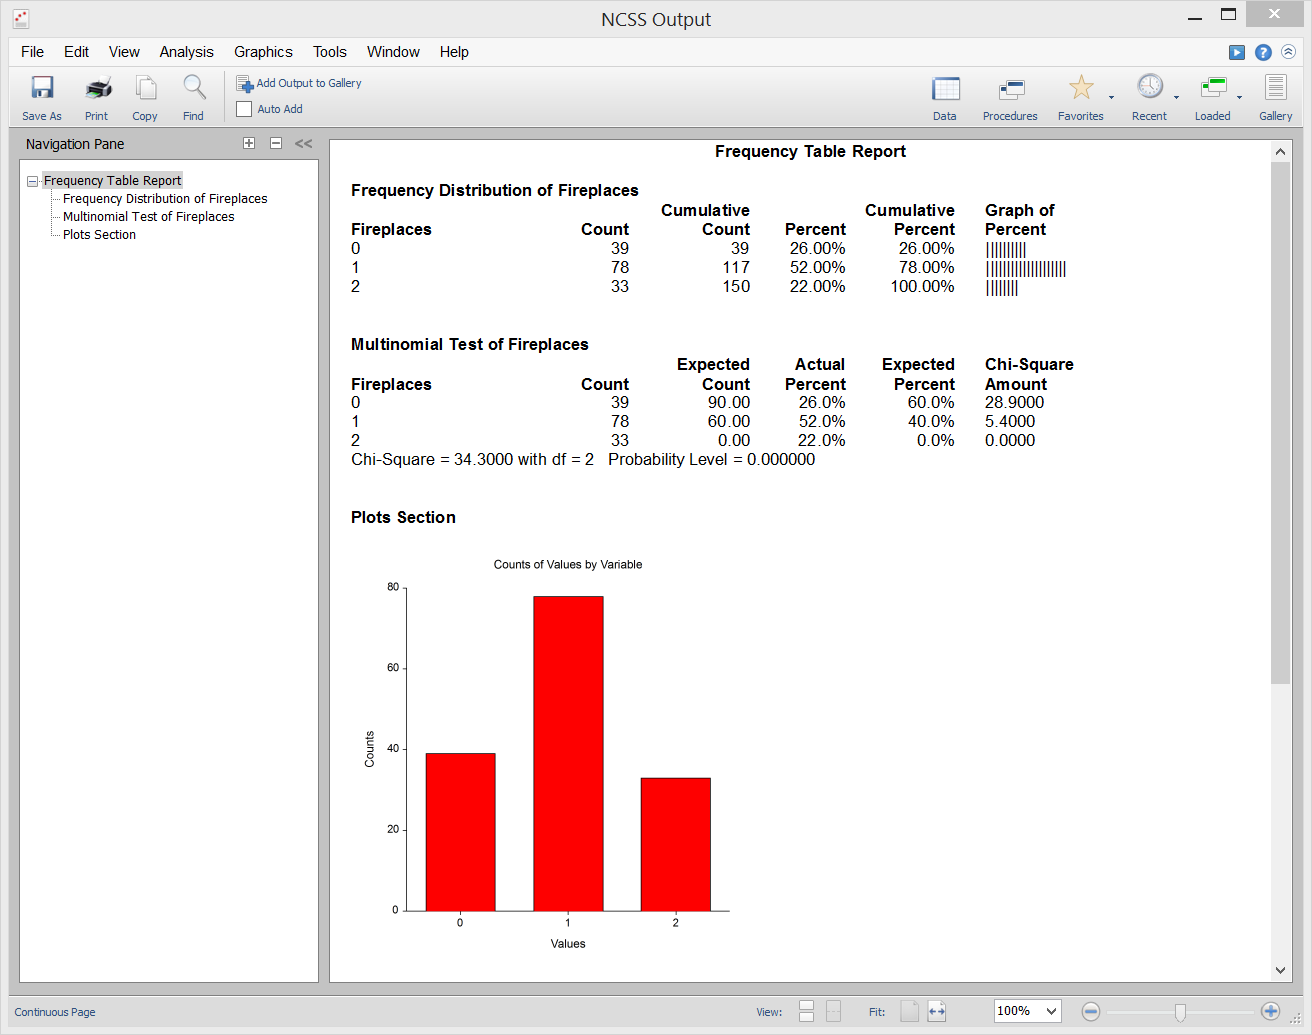
A Frequency Table is a table of counts and percentages for categorical and summarized continuous variables. This procedure serves as a summary reporting tool and is often used to analyze survey data. The Frequency Table procedure in NCSS is really a special case of the two-way table… where there is only one categorical variable (not two). This procedure also calculates the Multinomial Chi-Square Test, which is used to determine if the sample frequencies follow a defined frequency pattern.
Sample Output
Cochran's Q Test
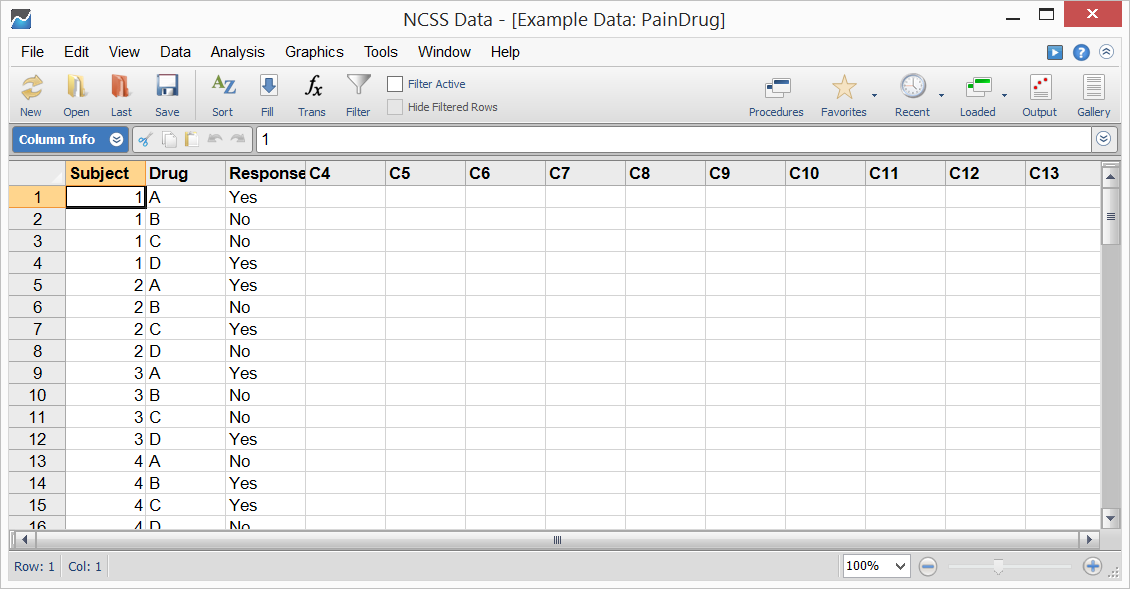
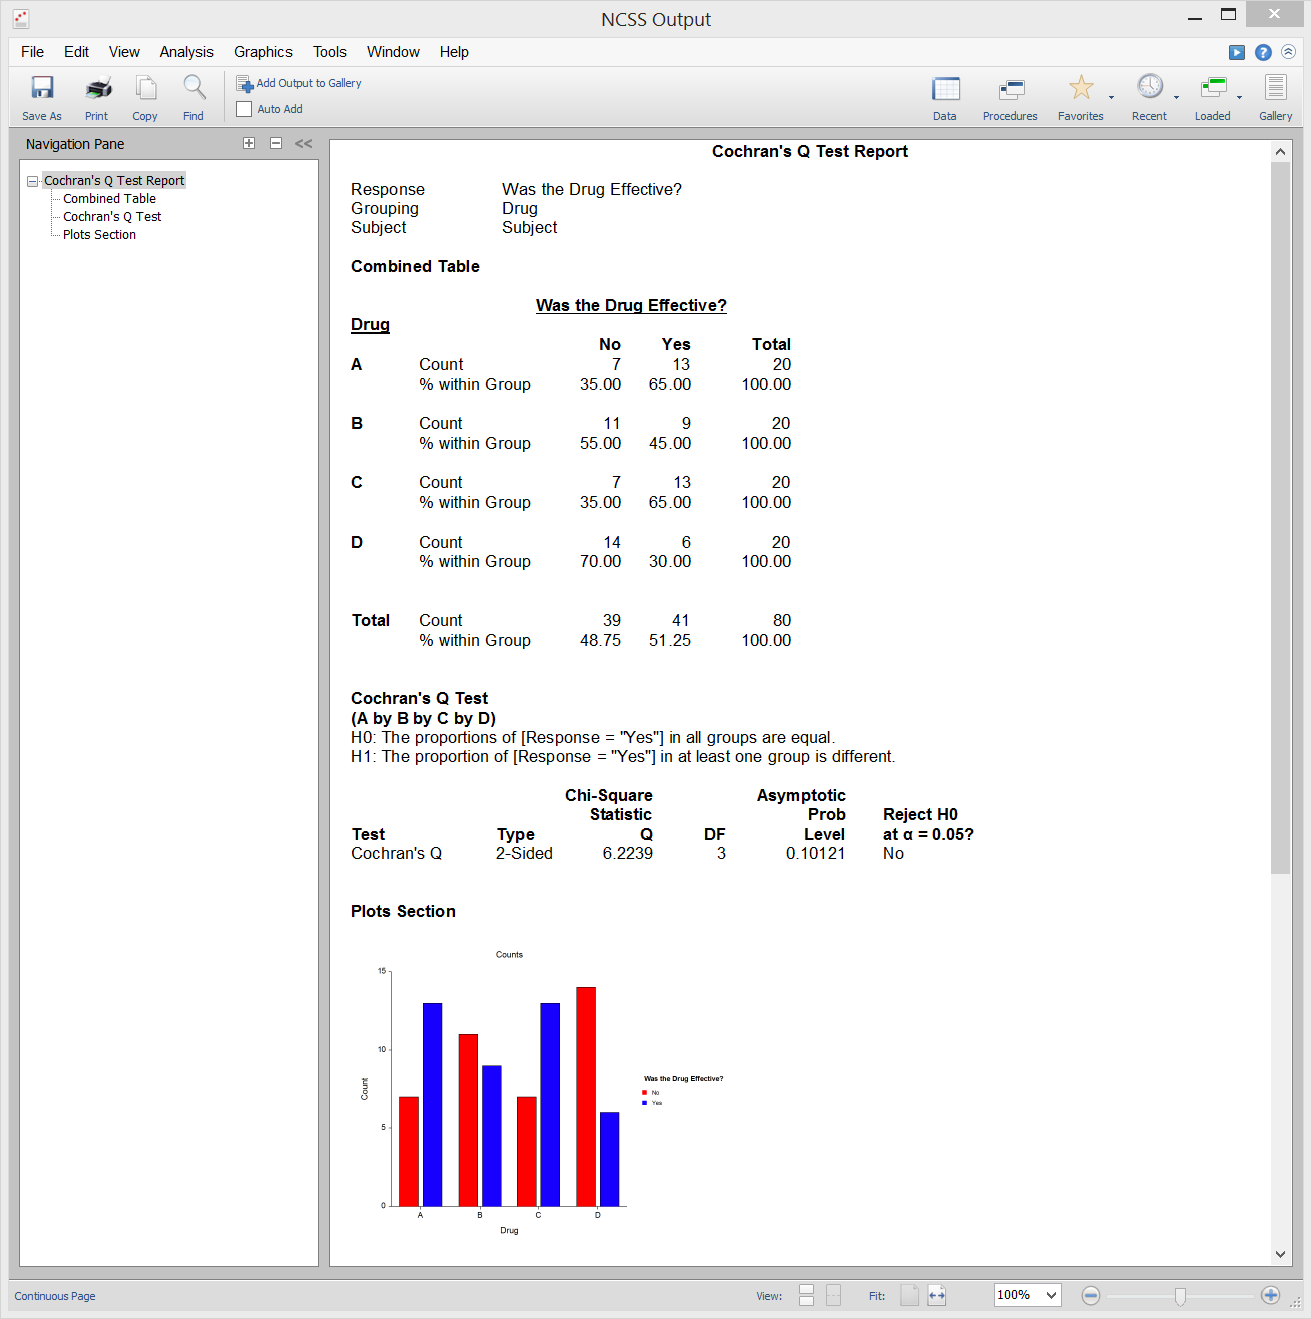
Cochran’s Q Test is a nonparametric test used for testing 2 or more matched sets of binary responses. Cochran’s Q tests the null hypothesis that the proportion of “successes” is the same in all groups versus the alternative that the proportion is different in at least one of the groups.
Click here for more information about the Cochran’s Q Test procedure in NCSS.
Sample Data
Sample Output
Loglinear Models
Loglinear Models (LLM) study the relationships among two or more discrete variables. Loglinear models are often used to analyze surveys and questionnaires with complex relationships among the questions. Although technically not a two-way table analysis method, the method is mentioned here because it is an extension of the familiar chi-square test for independence in two-way contingency tables.
Click here for more information about the Loglinear Models procedure in NCSS.
Mantel-Haenszel Test
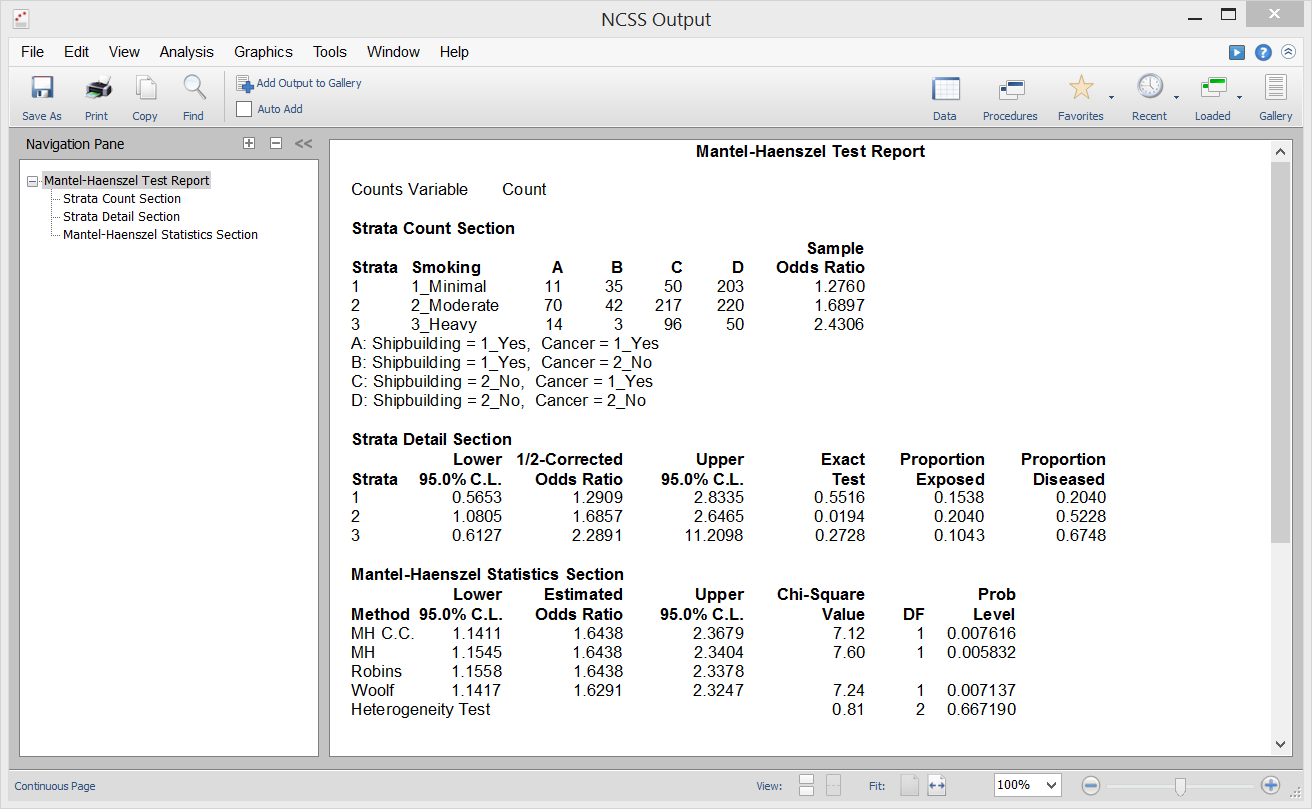
The Mantel-Haenszel Test compares the odds ratios of several stratified 2 x 2 tables. A Mantel-Haenszel analysis provides two closely related pieces of information: First, it provides statistical tests of whether the odds ratios are equal (homogeneous) or unequal (heterogeneous) across strata. Second, it provides an estimate of the odds ratio of the exposure variable, adjusted for the strata variable. In the example below, Mantel-Haenszel Test procedure provides estimates of the odds ratio of asbestos exposure to lung cancer after removing the influence of smoking.
Sample Output
 The two-way table data can also be presented in a simple two-factor bar chart:
 A wide variety of analyses can be performed on two-way table data, depending on the study design and research objectives. This page outlines the analyses available in NCSS for two-way table data.


