Nonparametric Analysis in NCSS
NCSS includes a variety of nonparametric analysis tools covering a wide range of statistical applications. Use the links below to jump to the nonparametric analysis topic you would like to examine. To see how these tools can benefit you, we recommend you download and install the free trial of NCSS. Jump to:- Introduction
- Technical Details
- One Group (Continuous Data)
- Sign or Quantile Test
- Wilcoxon Signed-Rank Test
- Two Groups (Continuous Data)
- Mann-Whitney U or Wilcoxon Rank-Sum Test
- Kolmogorov-Smirnov Test
- Nondetects-Data Group Comparison
- Many Groups (Continuous Data)
- Conover Equal Variance Test
- Kruskal-Wallis Test
- Dunn's Test
- Dwass-Steel-Critchlow-Fligner Test
- Friedman's Rank Test
- Two Proportions and Two-Way Tables (Discrete Data)
- McNemar Test
- Cochran's Q Test
- Correlation
- Spearman-Rank Correlation
- Kendall's Tau Correlation
- Survival Analysis and Reliability Testing
- Kaplan-Meier Curves
- Cumulative Incidence Curves
- Logrank Test
- ROC
- ROC Curves
- Analysis of Runs
- Runs Tests (e.g. Wald-Wolfowitz Runs Test)
- Randomization
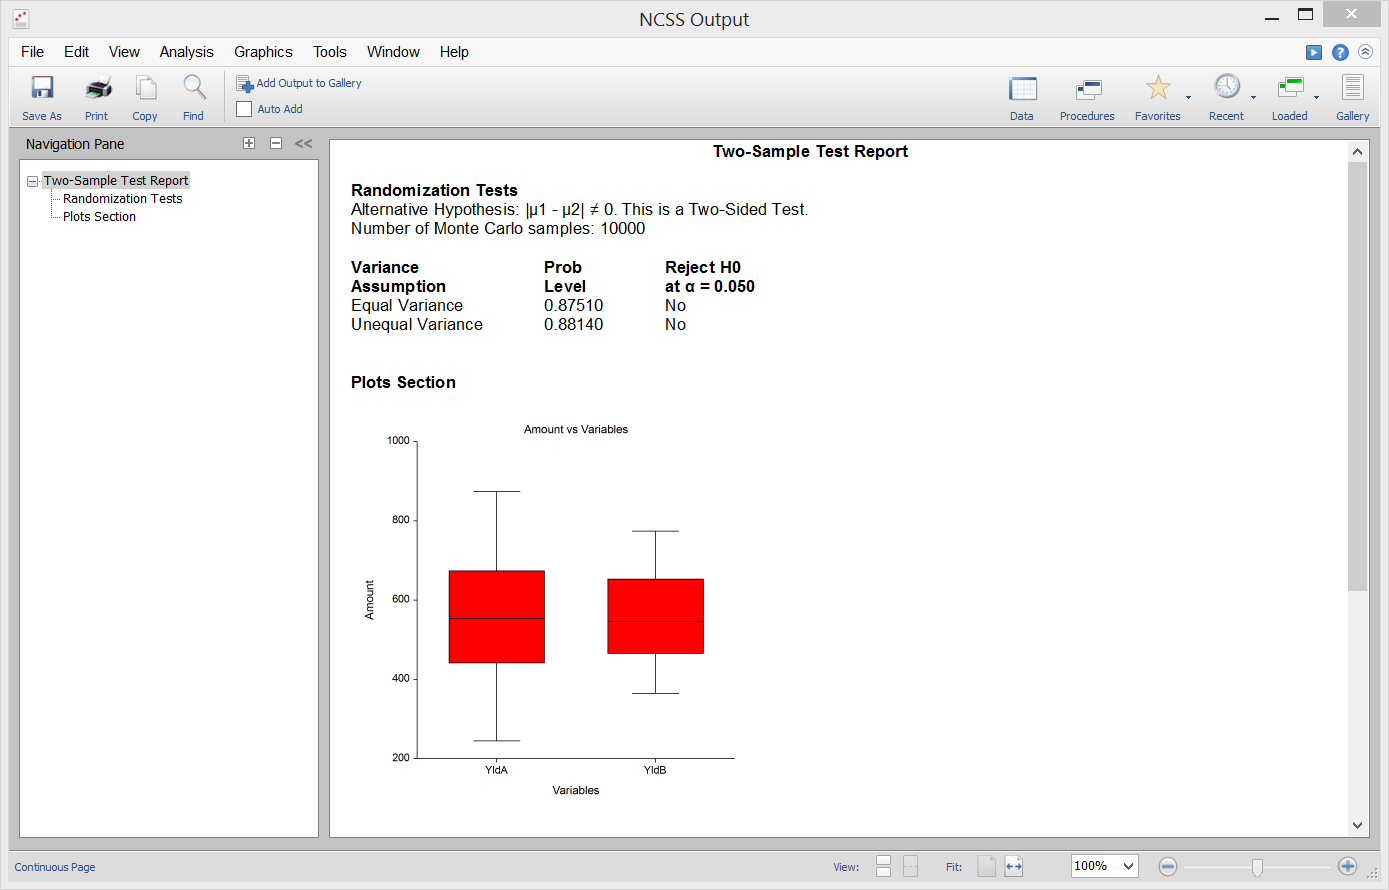
- Randomization Tests
Introduction
Nonparametric methods are statistical analysis methods that require no assumptions about an underlying probability distribution. That is, nonparametric statistical methods are “distribution-free.” Parametric methods often make inference about means and variances, while nonparametric methods often make inference about medians, ranks, and percentiles. Many parametric statistical methods require an assumption of Normality. When the normality assumption is violated, nonparametric analysis methods are often employed for inference. For example, when the assumption of normality of residuals in One-Way ANOVA is violated, a common practice is to use the analogous Kruskal-Wallis One-Way ANOVA on ranks. This page describes the various nonparametric methods available in NCSS Statistical Software. Some nonparametric statistics are output by more than one procedure in the software.Technical Details
This page is designed to give a general overview of the nonparametric methods available in NCSS. If you would like to examine the formulas and technical details relating to a specific NCSS procedure, click on the corresponding '[Documentation PDF]' link under each heading to load the complete procedure documentation. There you will find formulas, references, discussions, and examples or tutorials describing the procedure in detail.One Group (Continuous Data)
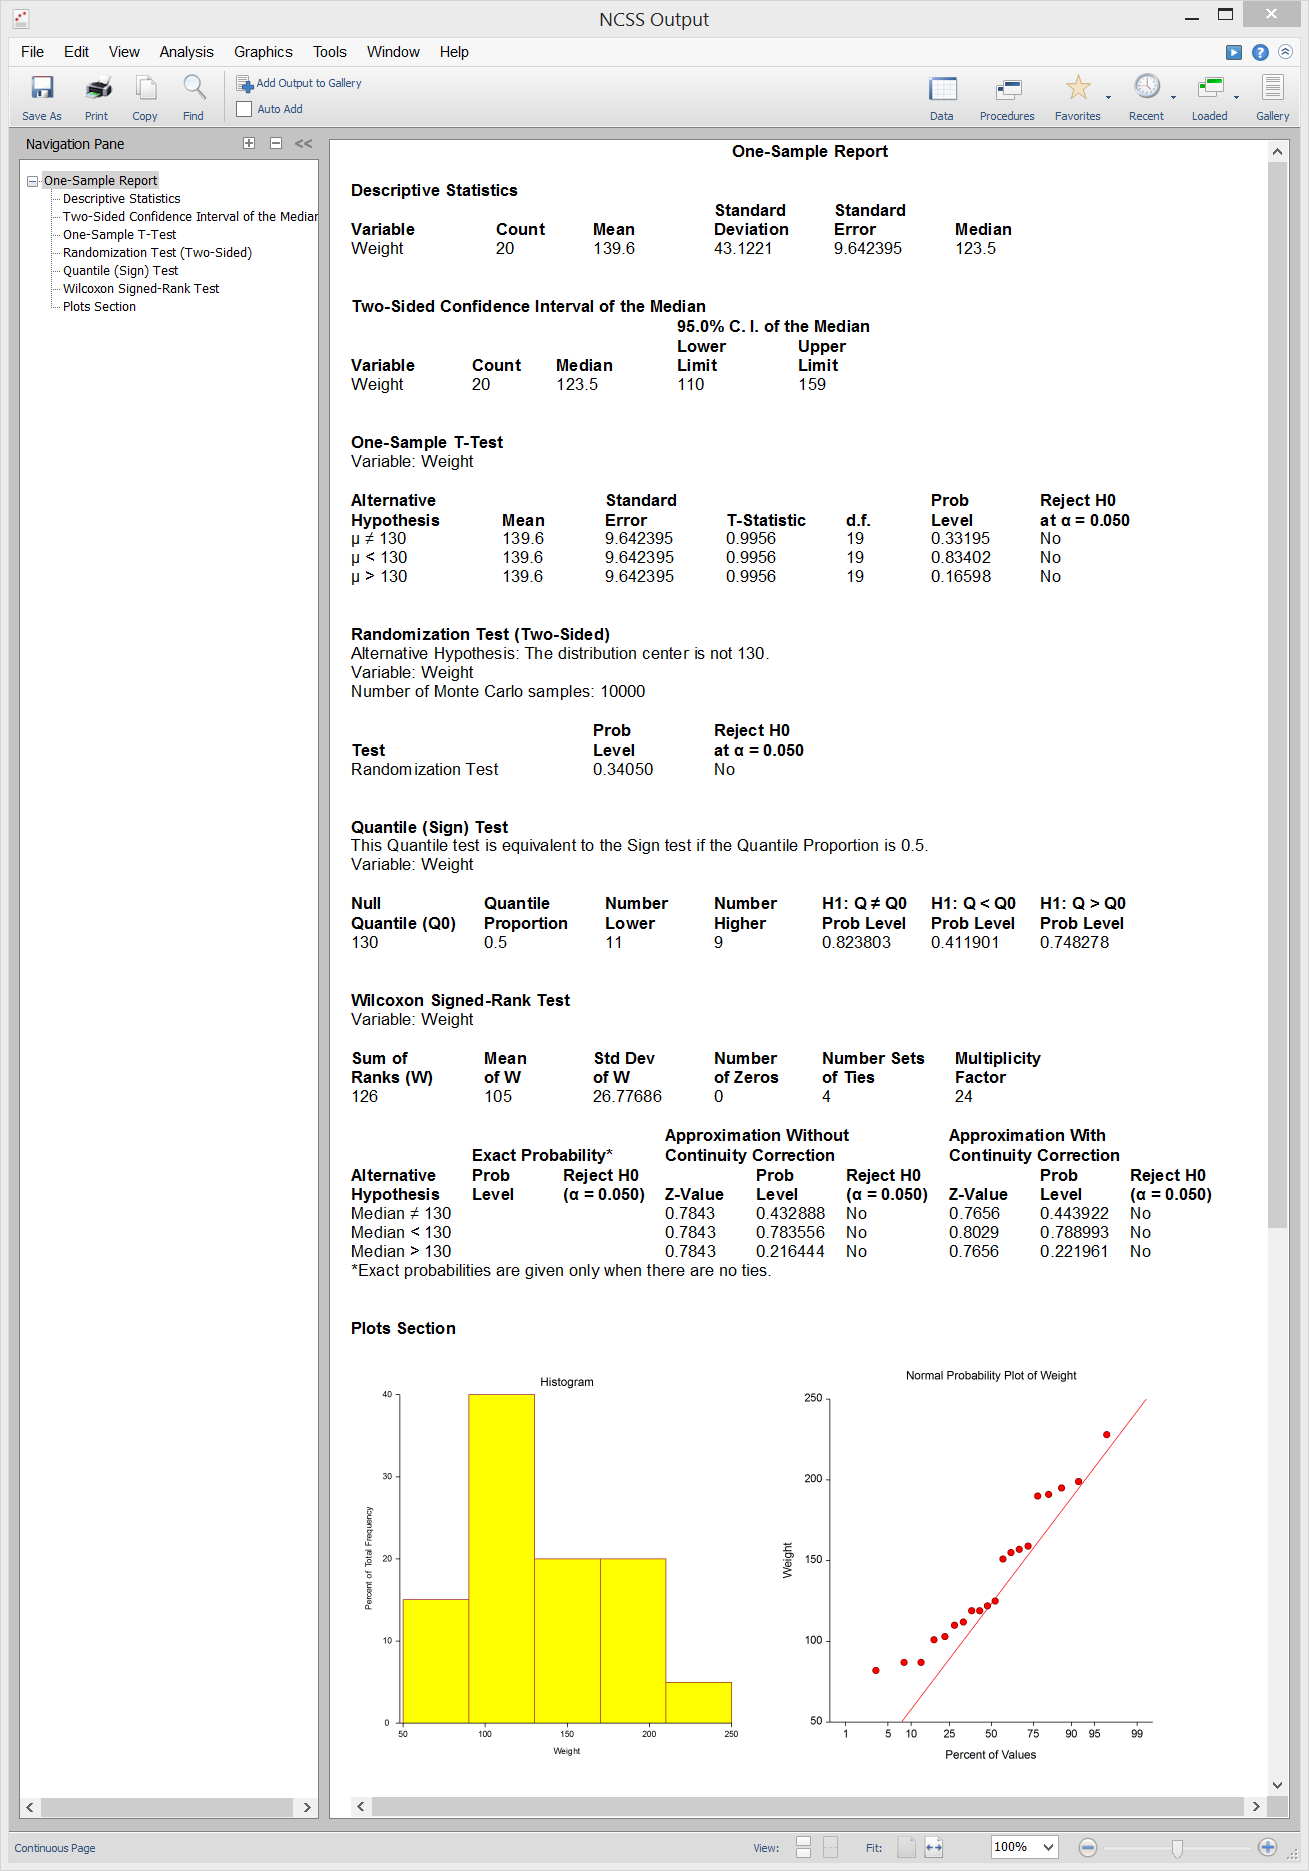
[Documentation PDF]The nonparametric Quantile Test (or Sign Test) and the Wilcoxon Signed-Rank Test are nonparametric analogs to the one-sample or paired T-test. Both can be applied in the case where there is only one group with continuous data.
Sign or Quantile Test
The Quantile Test tests whether the null hypothesized quantile value is the quantile for the quantile test proportion. When the quantile of interest is the median (i.e. the quantile test proportion is 0.5), this quantile test is called the Sign Test. Each of the values in the sample is compared to the null hypothesized quantile value and determined whether it is larger or smaller. Values equal to the null hypothesized value are removed. The binomial distribution based on the Quantile Test Proportion is used to determine the probabilities in each direction of obtaining such a sample or one more extreme if the null quantile is the true one. These probabilities are the p-values for the one-sided test of each direction. The two-sided p-value is twice the value of the smaller of the two one-sided p-values. The assumptions of the Sign or Quantile Test are:- 1. A random sample has been taken resulting in observations that are independent and identically distributed.
- 2. The measurement scale is at least ordinal.
- 1. One-Sample T-Test
- 2. Paired T-Test
Wilcoxon Signed-Rank Test
The Wilcoxon Signed-Rank Test makes use of the sign and the magnitude of the ranks of the differences (original data minus the hypothesized value). The assumptions for the Wilcoxon Signed-Rank Test are as follows:- 1. The data are continuous (not discrete).
- 2. The distribution of the data is symmetric.
- 3. The data are mutually independent.
- 4. The data all have the same median.
- 5. The measurement scale is at least interval.
- 1. One-Sample T-Test
- 2. Paired T-Test
Sample Output from the One-Sample T-Test Procedure
Two Groups (Continuous Data)
[Documentation PDF]The Mann-Whitney U or Wilcoxon Rank-Sum Test and the Kolmogorov-Smirnov Test are nonparametric analogs to the two-sample T-test. Both can be applied when comparing two groups with continuous data. Of the two, the Mann-Whitney U or Wilcoxon Rank-Sum Test is more commonly used.
Mann-Whitney U or Wilcoxon Rank-Sum Test
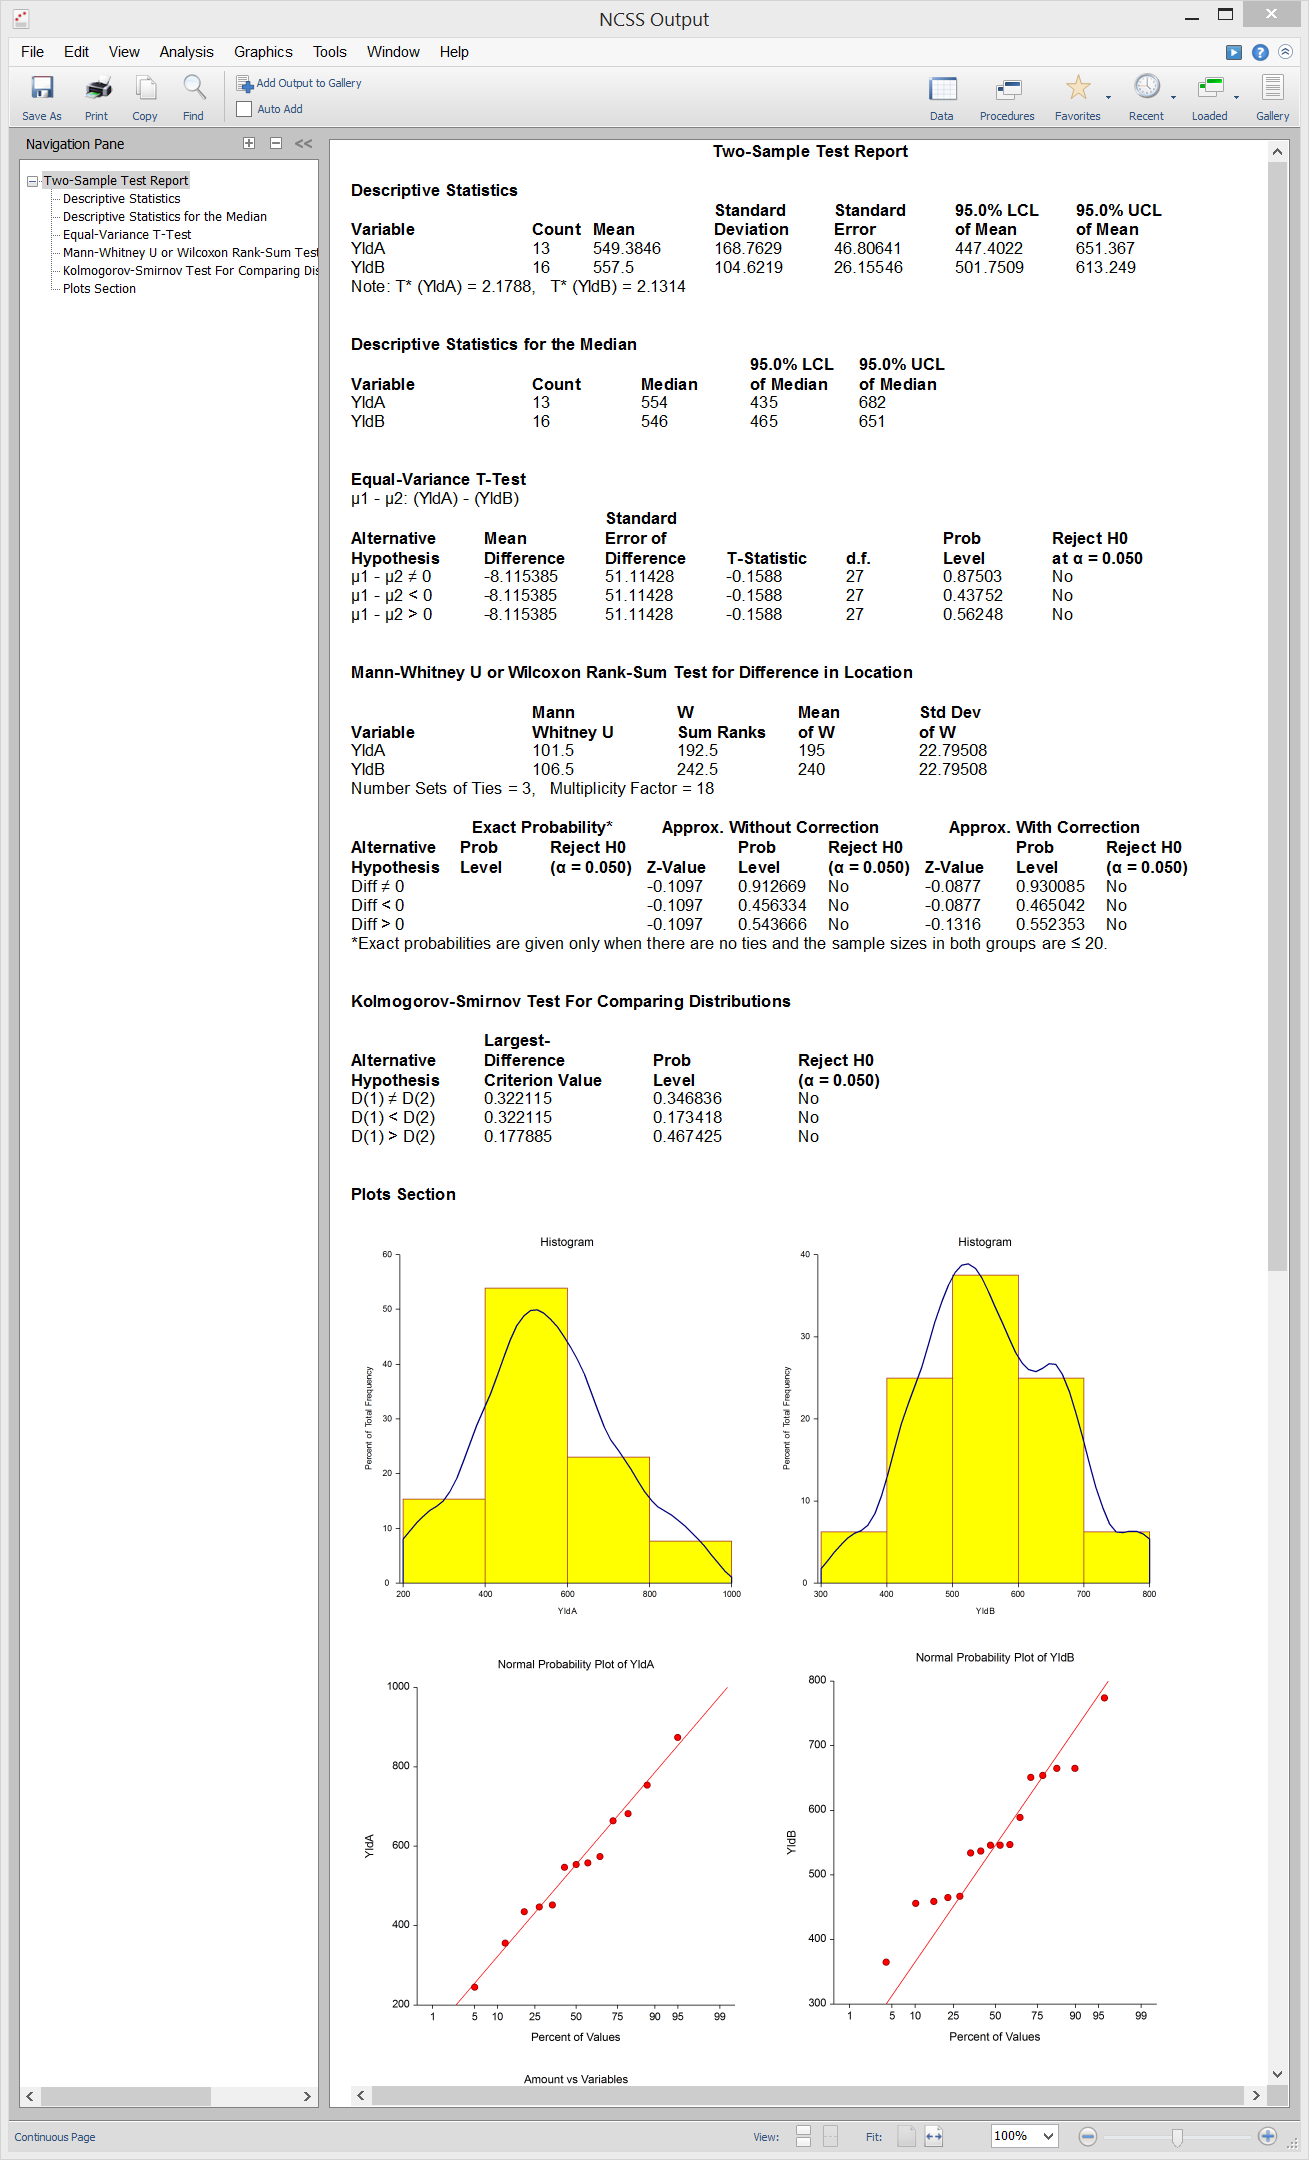
The Mann-Whitney U or Wilcoxon Rank-Sum Test is the most common nonparametric analog to the two-sample T-test. This test is for a difference in location between the two groups. The test is based on ranks and has good properties (asymptotic relative efficiency) for symmetric distributions. There are exact procedures for this test given small samples with no ties, and there are large sample approximations available as well. The assumptions of the Mann-Whitney U or Wilcoxon Rank-Sum Test are:- 1. The variable of interest is continuous (not discrete). The measurement scale is at least ordinal.
- 2. The probability distributions of the two populations are identical, except for location.
- 3. The two samples are independent.
- 4. Both samples are simple random samples from their respective populations. Each individual in the population has an equal probability of being selected in the sample.
- 1. Two-Sample T-Test
- 2. Testing Non-Inferiority with Two Independent Samples
- 3. Testing Equivalence with Two Independent Samples
Kolmogorov-Smirnov Test
The Kolmogorov-Smirnov Test is a two-sample test for differences between two samples or distributions. If a statistical difference is found between the distributions of Groups 1 and 2, the test does not indicate the particular cause of the difference. The difference could be due to differences in location (mean), variation (standard deviation), presence of outliers, skewness, kurtosis, number of modes, and so on. This test is sometimes preferred over the Mann-Whitney U or Wilcoxon Rank-Sum Test when there are a lot of ties. The test statistic is the maximum distance between the empirical distribution functions (EDF) of the two samples. The assumptions of the Kolmogorov-Smirnov test are:- 1. The measurement scale is at least ordinal.
- 2. The probability distributions are continuous.
- 3. The two samples are mutually independent.
- 4. Both samples are simple random samples from their respective populations.
- 1. Two-Sample T-Test
- 2. Descriptive Statistics (for testing data Normality)
- 3. Normality Tests (for testing data Normality)
- 4. Tolerance Intervals (for testing data Normality)
Nondetects-Data Group Comparison
[Documentation PDF]The Nondetects-Data Group Comparison procedure uses nonparametric methods compare the data in two groups in the presence of nondetects. The theory behind this type of analysis is closely tied to the theory behind the Kaplan-Meier survival curve. Click here for more information about the Nondetects-Data Group Comparison procedure in NCSS.
Sample Output from the Two-Sample T-Test Procedure
Many Groups (Continuous Data)
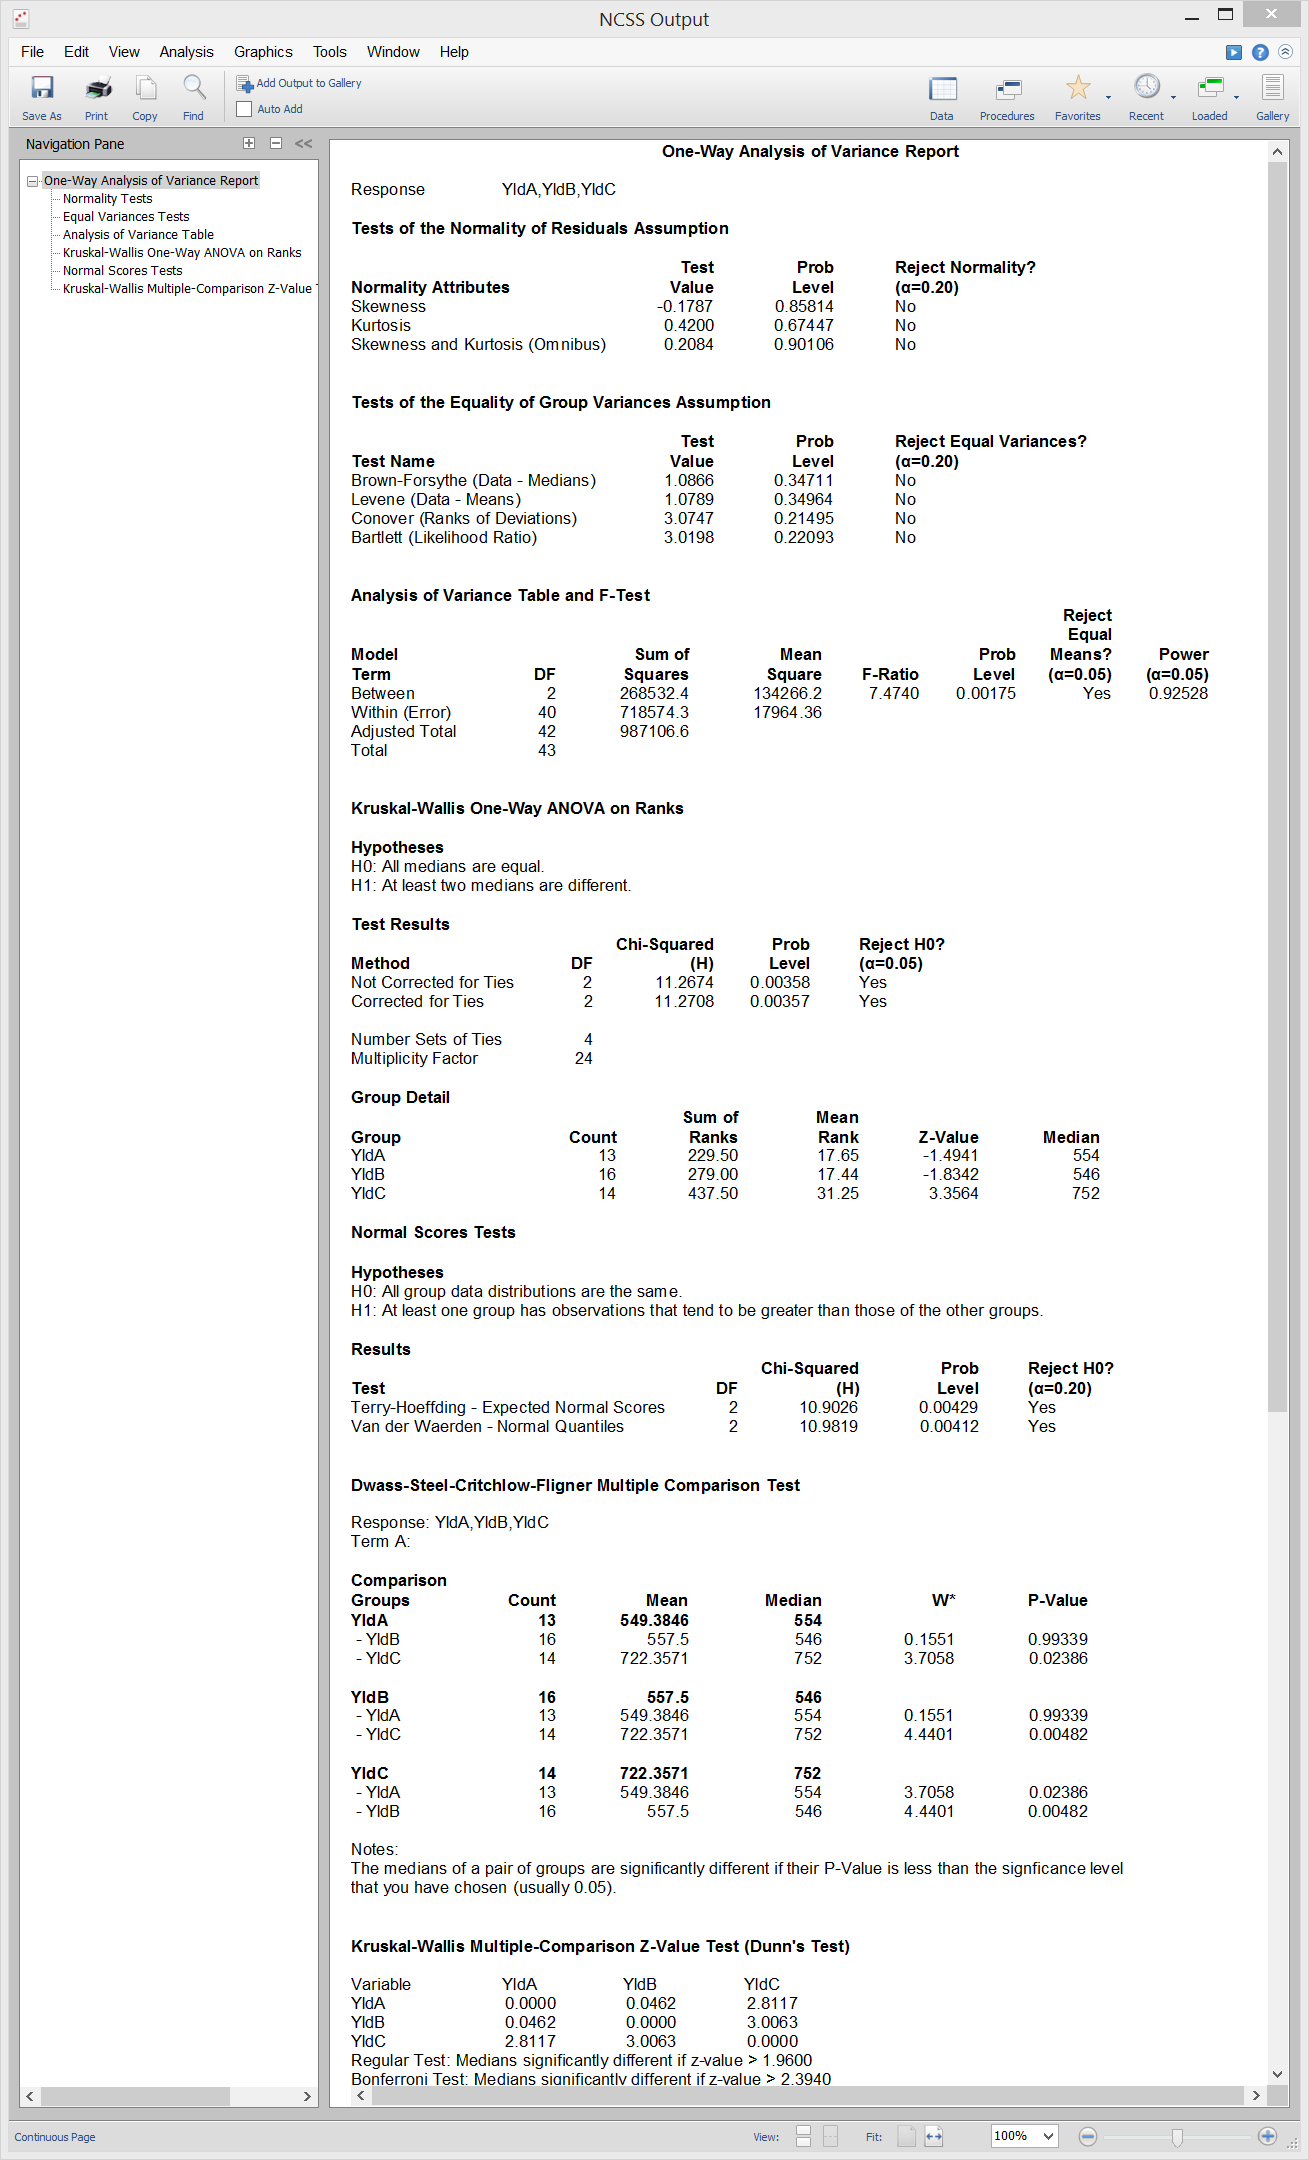
[Documentation PDF]Several nonparametric tests are available in NCSS for the case where you have two or more groups with continuous data. All are utilized as analogs to tests related to ANOVA. The Conover Equal Variance Test is a nonparametric test of the equal variance assumption in one-way ANOVA, an analog to the Levene test among others. The Kruskal-Wallis Test is the nonparametric substitute for the one-way ANOVA F-Test. Dunn’s Test and the Dwass-Steel-Critchlow-Fligner Test are nonparametric multiple comparison tests that are used after the null hypothesis is rejected in the Kruskal-Wallis Test. Finally, Friedman’s Rank Test is the nonparametric analog of the F-test in a two-way, randomized block design.
Conover Equal Variance Test
Conover (1999) present a nonparametric test of homogeneity (equal variance) based on ranks. The test does not assume that all populations are normally distributed and is recommended when the normality assumption is not viable. The test assumes that the data are obtained by taking a simple random sample from each of the K populations. The Conover Equal Variance Test is available in the One-Way Analysis of Variance procedure in NCSS.Kruskal-Wallis Test
The Kruskal-Wallis test is a nonparametric substitute for the one-way ANOVA when the assumption of normality is not valid. Two key assumptions are that the group distributions are at least ordinal in nature and that they are identical, except for location. When ties are present in your data, you should use the corrected version of this test. The assumptions of the Kruskal-Wallis Test are:- 1. The variable of interest is continuous (not discrete). The measurement scale is at least ordinal.
- 2. The probability distributions of the populations are identical, except for location. Hence, the test still requires that the population variances are equal.
- 3. The groups are independent.
- 4. All groups are simple random samples from their respective populations. Each individual in the population has an equal probability of being selected in the sample.
Dunn's Test
Dunn’s Test is a distribution-free multiple comparison test, meaning that the assumption of normality is not necessary. This test, which is also known as the Kruskal-Wallis Z Test, is attributed to Dunn (1964) and is referenced in Daniel (1990), pages 240 - 242. The test is to be used for testing pairs of medians following the Kruskal-Wallis test. The test needs sample sizes of at least five (but preferably larger) for each treatment. The error rate is adjusted on a comparisonwise basis to give the experimentwise error rate, αf. Instead of using means, the test uses average ranks with error rate, α = αf/(k(k −1)). Dunn’s Test is available in the One-Way Analysis of Variance procedure in NCSS.Dwass-Steel-Critchlow-Fligner Test
The Dwass-Steel-Critchlow-Fligner Test procedure is a two-sided, nonparametric procedure that provides family-wise error rate protection. It is most often used after significance is found from the Kruskal-Wallis Test. The test is referenced in Hollander, Wolfe, and Chicken (2014). The test procedure is to calculate a Wilcoxon rank sum test statistic, W, on each pair of groups. If there are ties, average ranks are used in the individual rank sum statistics. The p-values for these tests are calculated using the distribution of the range of independent, standard-normal variables. This is different from the usual calculation based on the Mann-Whitney U statistic. This provides the family-wise error rate protection. The Dwass-Steel-Critchlow-Fligner Test is available in the One-Way Analysis of Variance procedure in NCSS.Friedman's Rank Test
Friedman’s Rank test is a nonparametric analysis that may be performed on data from a randomized block experiment with continuous outcome. In this test, the original data are replaced by their ranks. It is used when the assumptions of normality and equal variance are suspect. When the outcome is binary, this test reduces to Cochran’s Q Test. Friedman's Rank Test is available in the Balanced Design Analysis of Variance procedure in NCSS.Sample Output from the One-Way Analysis of Variance Procedure
Two Proportions and Two-Way Tables (Discrete Data)
The McNemar Test and the Cochran’s Q Test are nonparametric tests for discrete data. Both are used to test proportions based on matched samples in two-way tables.McNemar Test
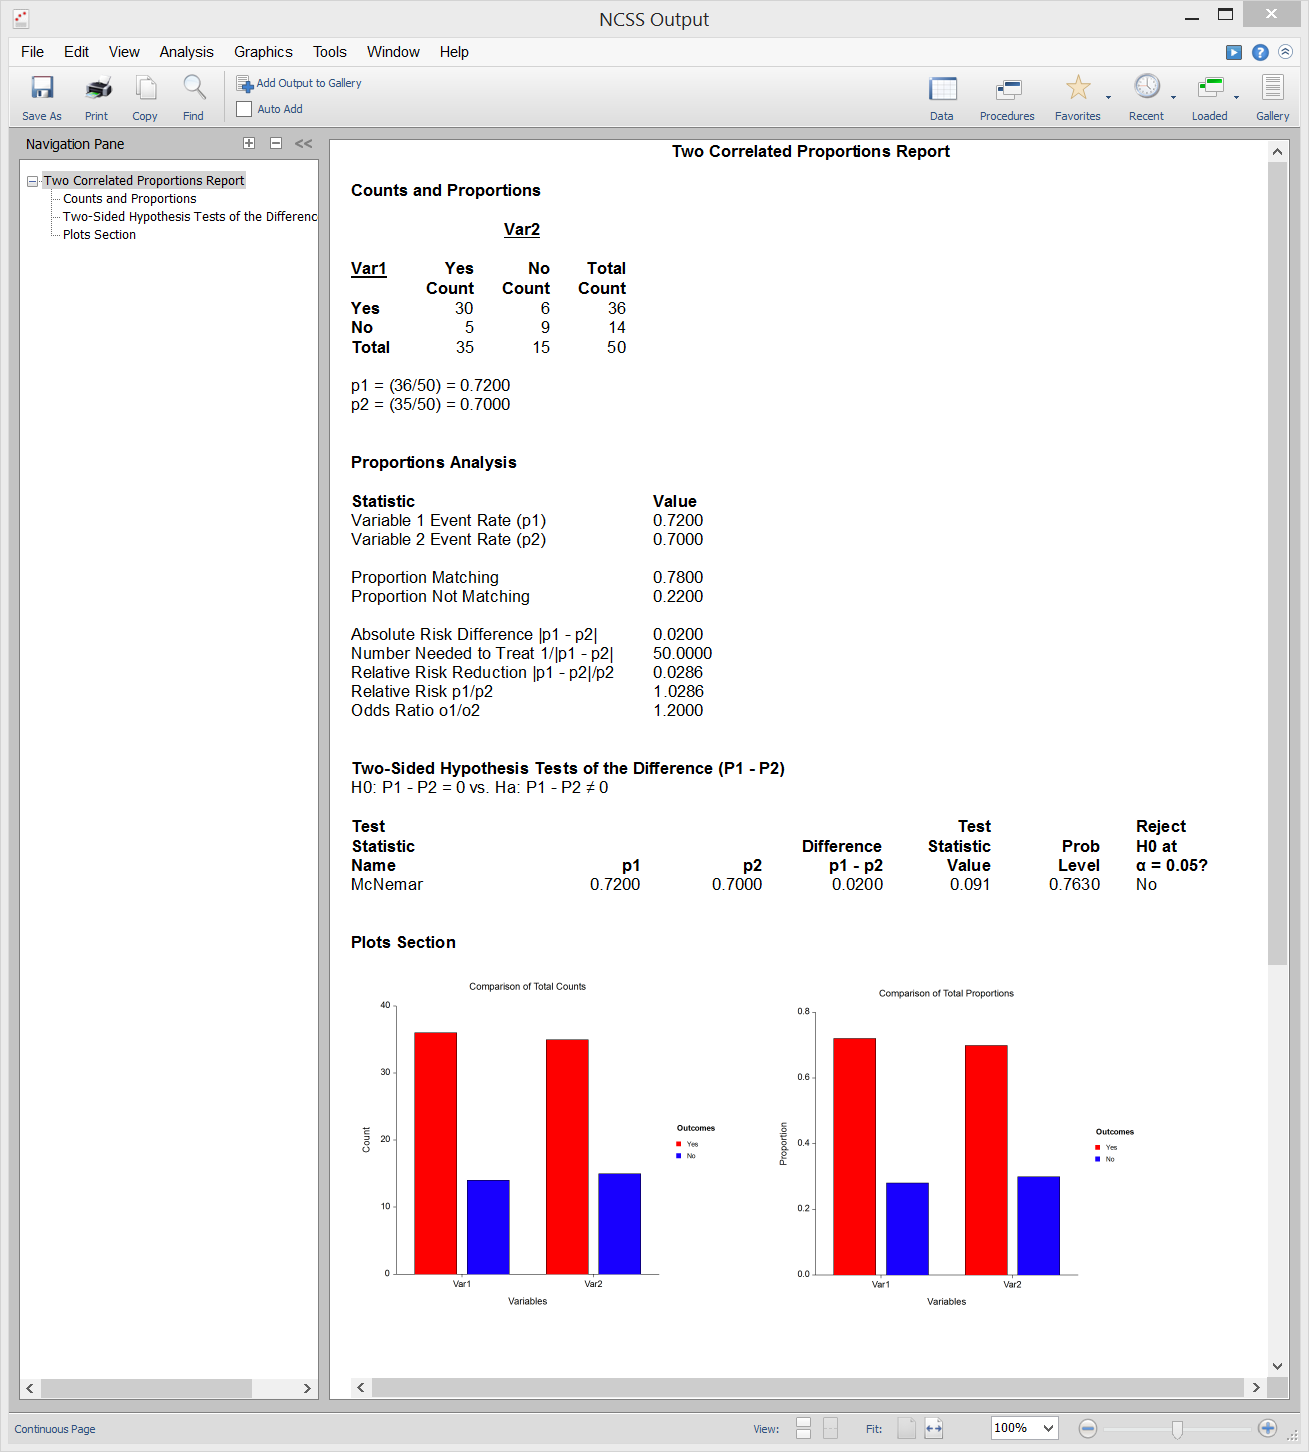
[Documentation PDF]The McNemar Test was first used to compare two proportions that are based on matched samples. Matched samples occur when individuals (or matched pairs) are given two different treatments, asked two different questions, or measured in the same way at two different points in time. Match pairs can be obtained by matching individuals on several other variables, by selecting two people from the same family (especially twins), or by dividing a piece of material in half. The McNemar test has been extended so that the measured variable can have more than two possible outcomes. It is then called the McNemar test of symmetry. It tests for symmetry around the diagonal of the table. The diagonal elements of the table are ignored. The test is computed for square k × k tables only. The McNemar Test is available in the following procedures in NCSS:
- 1. Two Correlated Proportions (McNemar Test)
- 2. Two Correlated Proportions – Equivalence Tests
- 3. Two-Way Contingency Tables (Crosstabs / Chi-Square Test)
- 4. Cochran’s Q Test (as pairwise multiple comparison tests)
Sample Output from the Two Correlated Proportions (McNemar Test) Procedure
Cochran's Q Test
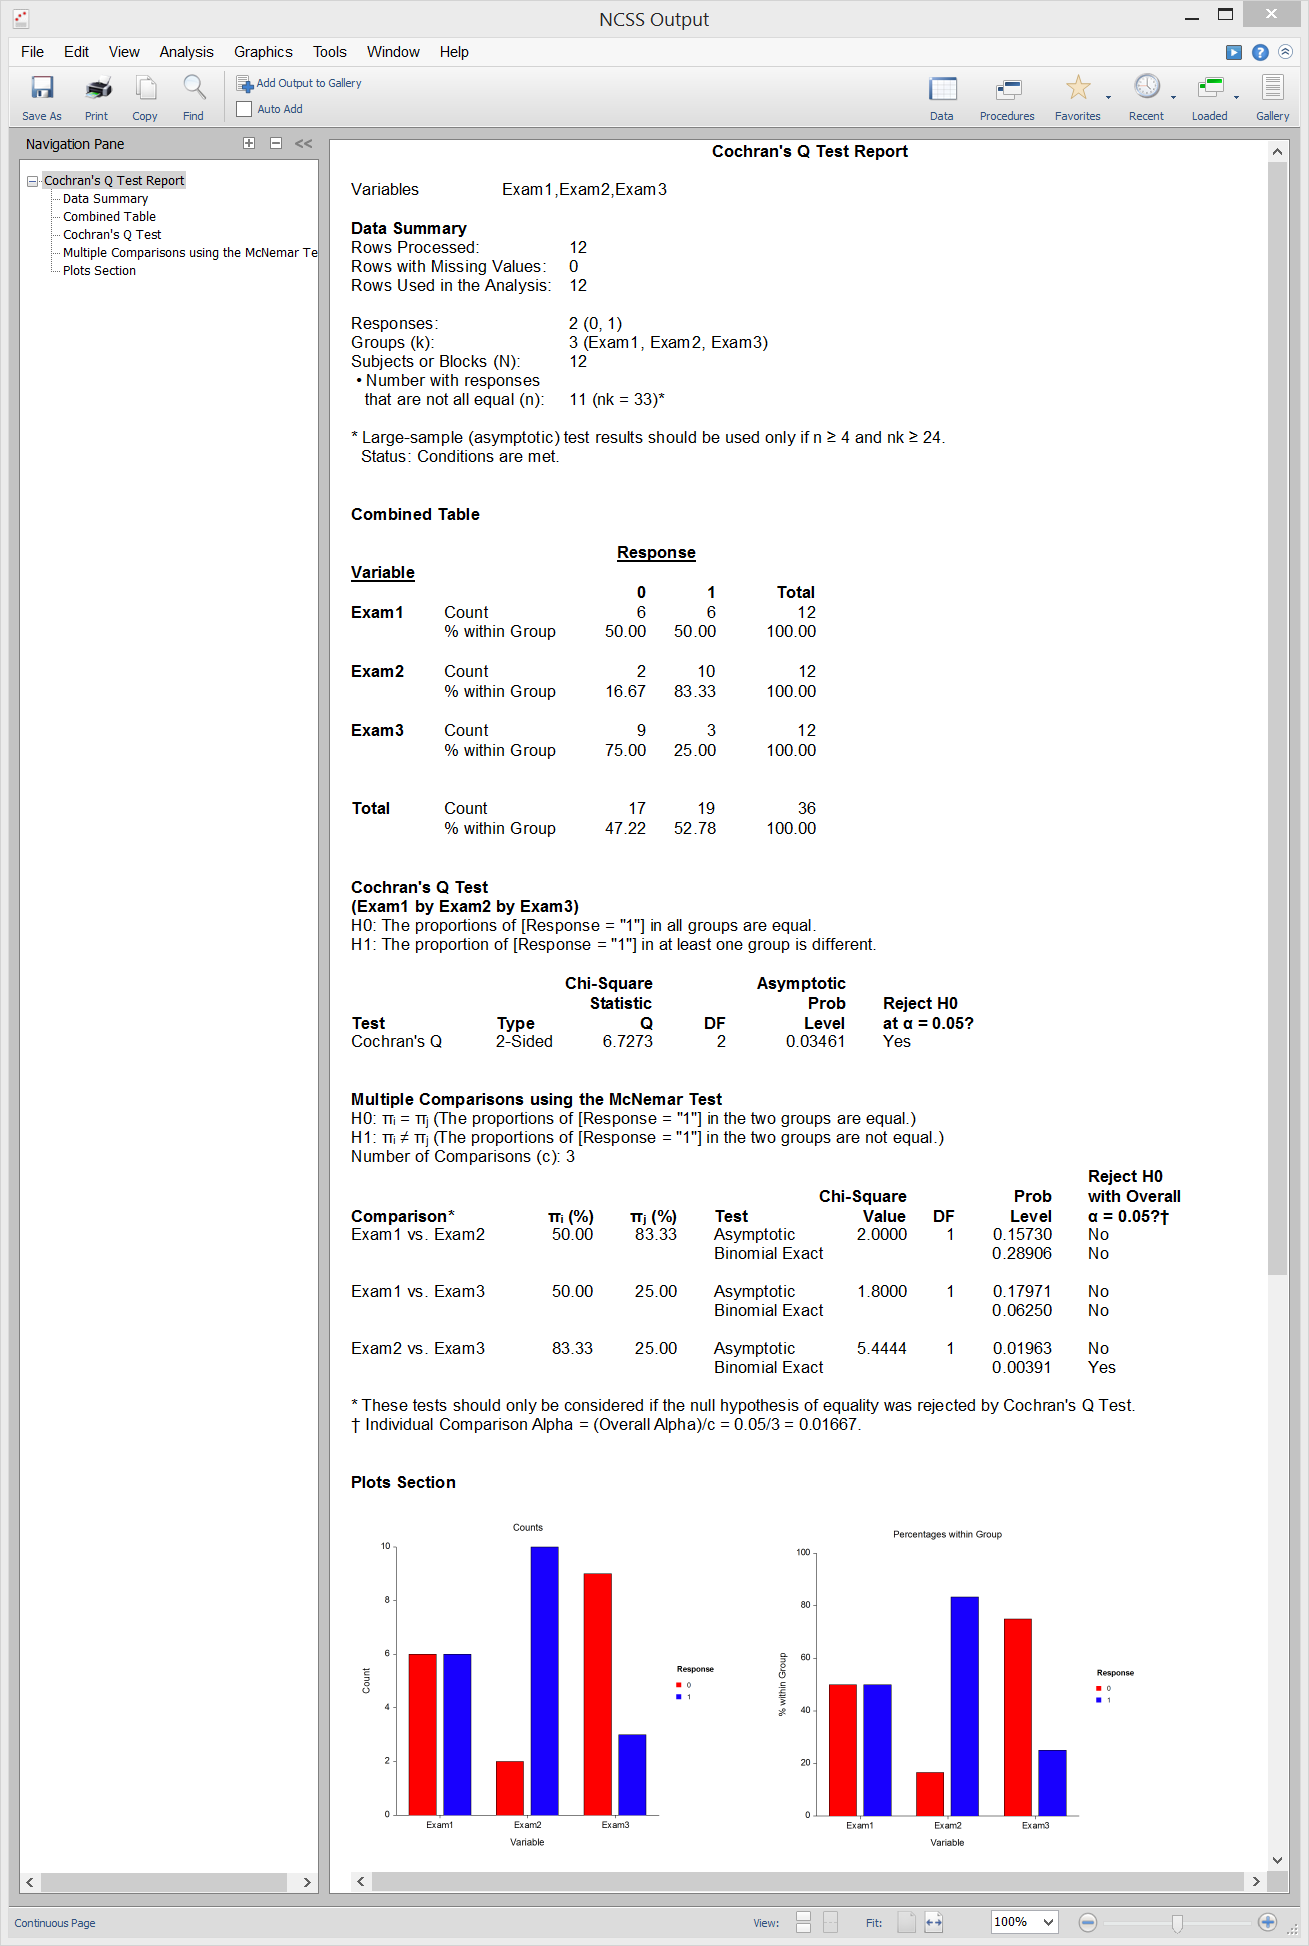
[Documentation PDF]Cochran’s Q Test is used for testing 2 or more matched sets, where a binary response (e.g. 0 or 1) is recorded from each category within each subject. Cochran’s Q tests the null hypothesis that the proportion of “successes” is the same in all groups versus the alternative that the proportion is different in at least one of the groups. Cochran’s Q test is an extension of the McNemar test to a situation where there are more than two matched samples. When Cochran’s Q test is computed with only k = 2 groups, the results are equivalent to those obtained from the McNemar test (without continuity correction). Cochran’s Q is also considered to be a special case of the nonparametric Friedman's rank test, which is similar to repeated measures ANOVA and is used to detect differences in multiple matched sets with numeric responses. When the responses are binary, the Friedman's rank test becomes Cochran’s Q test. This procedure also computes two-sided, pairwise nonparametric multiple comparison tests (McNemar tests) using that allow you to determine which of the individual groups are different if the null hypothesis in Cochran’s Q test is rejected. The individual alpha level is adjusted using the Bonferroni method to control the overall experiment-wise error rate. Cochran’s Q Test is available in the Cochran’s Q Test procedure in NCSS. The results in NCSS are based on the formulas given in chapter 26 of Sheskin (2011).
Sample Output from the Cochran’s Q Test Procedure
Correlation
[Documentation PDF]Spearman-Rank and Kendall’s Tau Correlation are both nonparametric alternatives to the commonly-used Pearson correlation coefficient. Both are available in NCSS.
Spearman-Rank Correlation
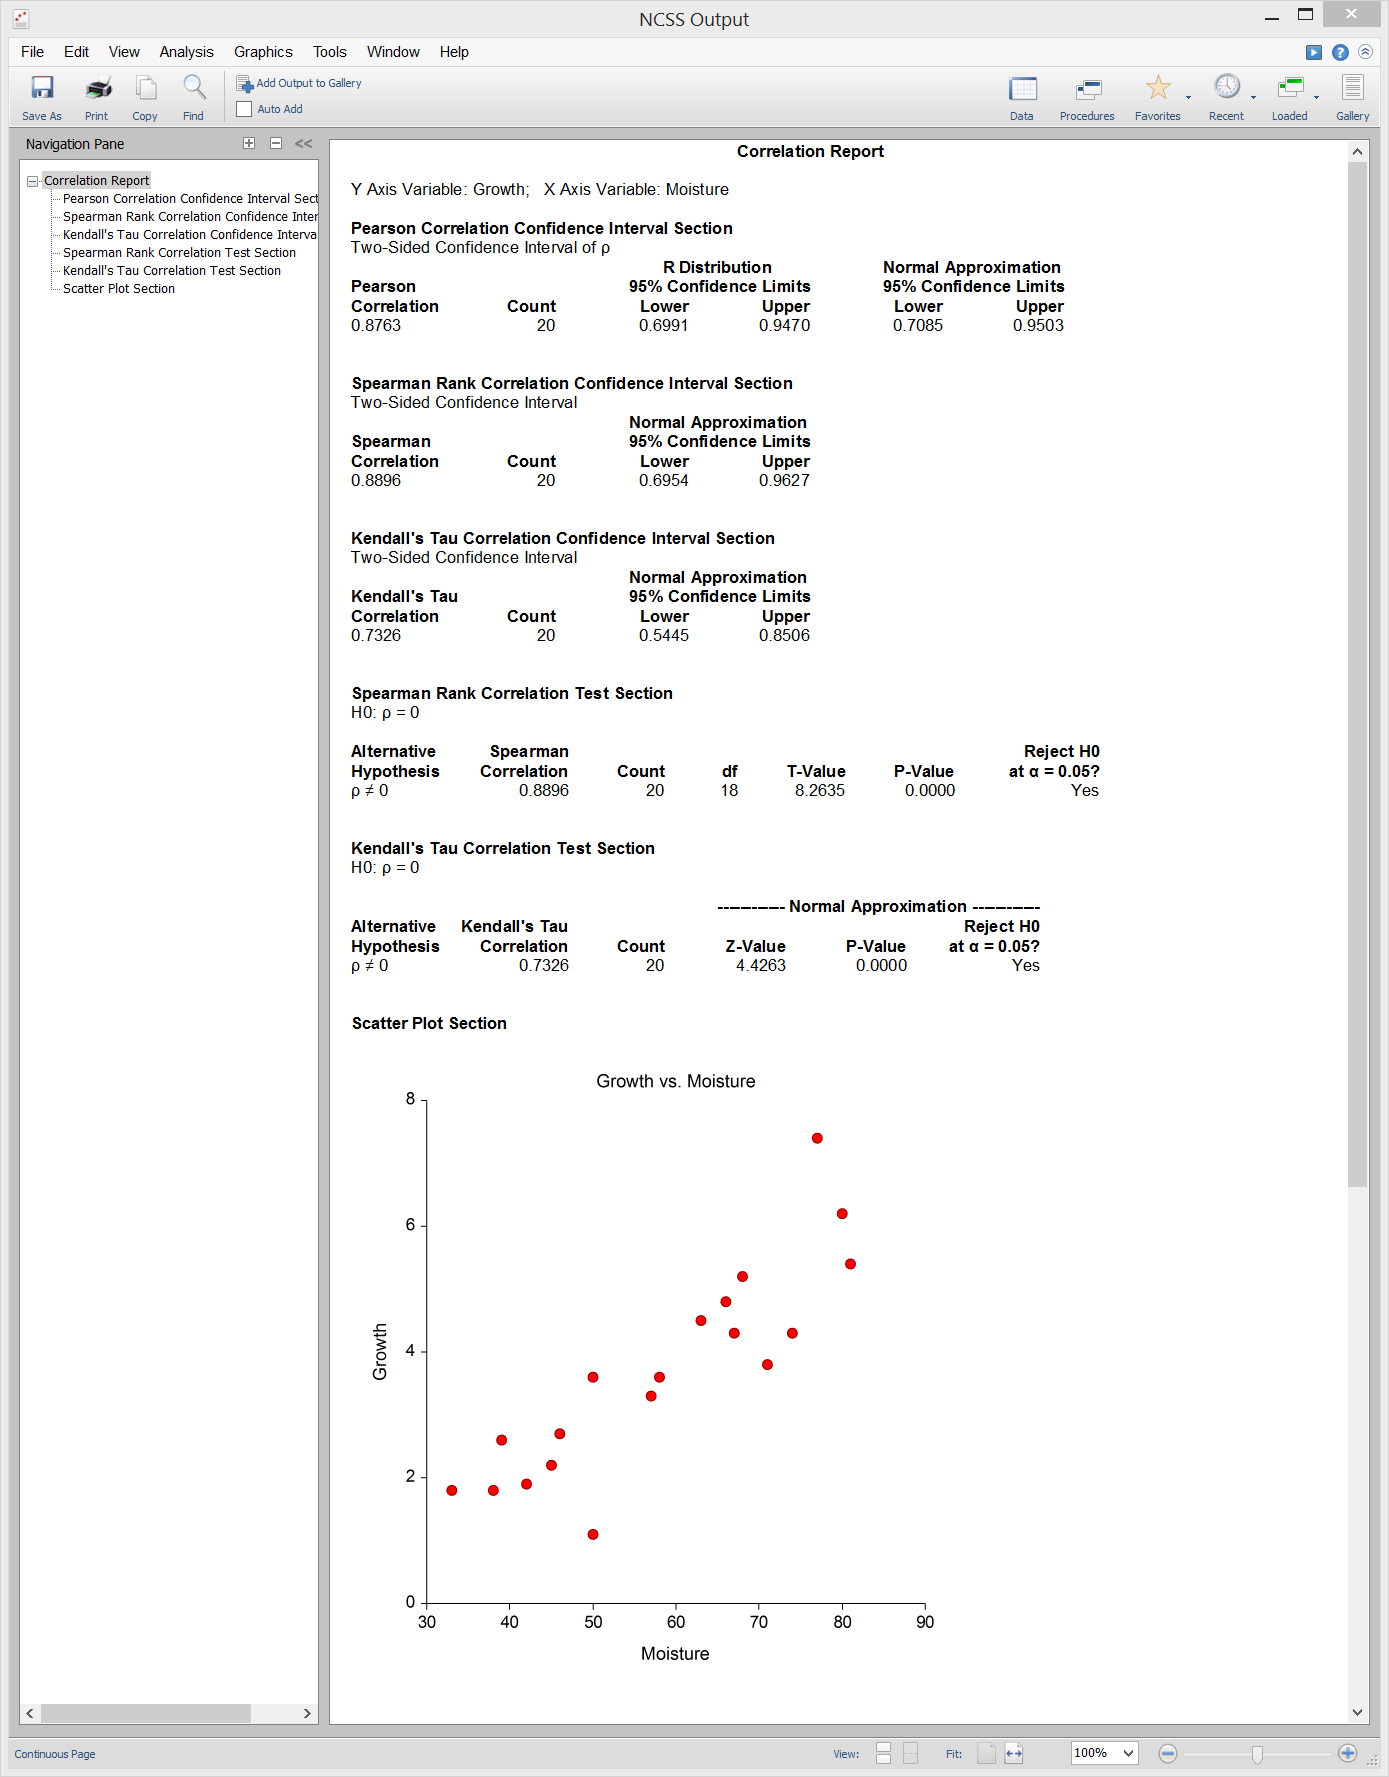
The Spearman-Rank correlation coefficient is calculated by ranking the observations for each of the two variables and then computing Pearson’s correlation on the ranks. When ties are encountered, the average rank is used. NCSS computes the Spearman-Rank correlation coefficient and associated confidence interval and computes hypothesis tests for testing whether the correlation is equal to zero or some non-zero value. Spearman-Rank Correlation is calculated in the following procedures in NCSS:- 1. Correlation
- 2. Correlation Matrix
- 3. Linear Regression and Correlation
Kendall's Tau Correlation
Kendall’s Tau correlation is also based the ranks of the observations, and is thus another nonparametric alternative to the Pearson correlation coefficient. It is calculated from a sample of n data pairs (X, Y) by first creating a variable U as the ranks of X and a variable V as the ranks of Y with ties replaced by average ranks. NCSS computes the Kendall’s Tau correlation coefficient and associated confidence interval and computes hypothesis tests for testing whether the correlation is equal to zero or some non-zero value. Kendall's Tau Correlation is calculated in the following procedures in NCSS:- 1. Correlation
- 2. Passing-Bablok Regression for Method Comparison
- 3. Robust Linear Regression (Passing-Bablok Median-Slope)
- 4. Two-Way Contingency Tables (Crosstabs / Chi-Square Test)
Sample Output from the Correlation Procedure
Survival Analysis and Reliability Testing
[Documentation PDF]NCSS has nonparametric tools for survival analysis and reliability testing, including Kaplan-Meier curves with associated Logrank tests, and cumulative incidence curves.
Kaplan-Meier Curves and Logrank Tests
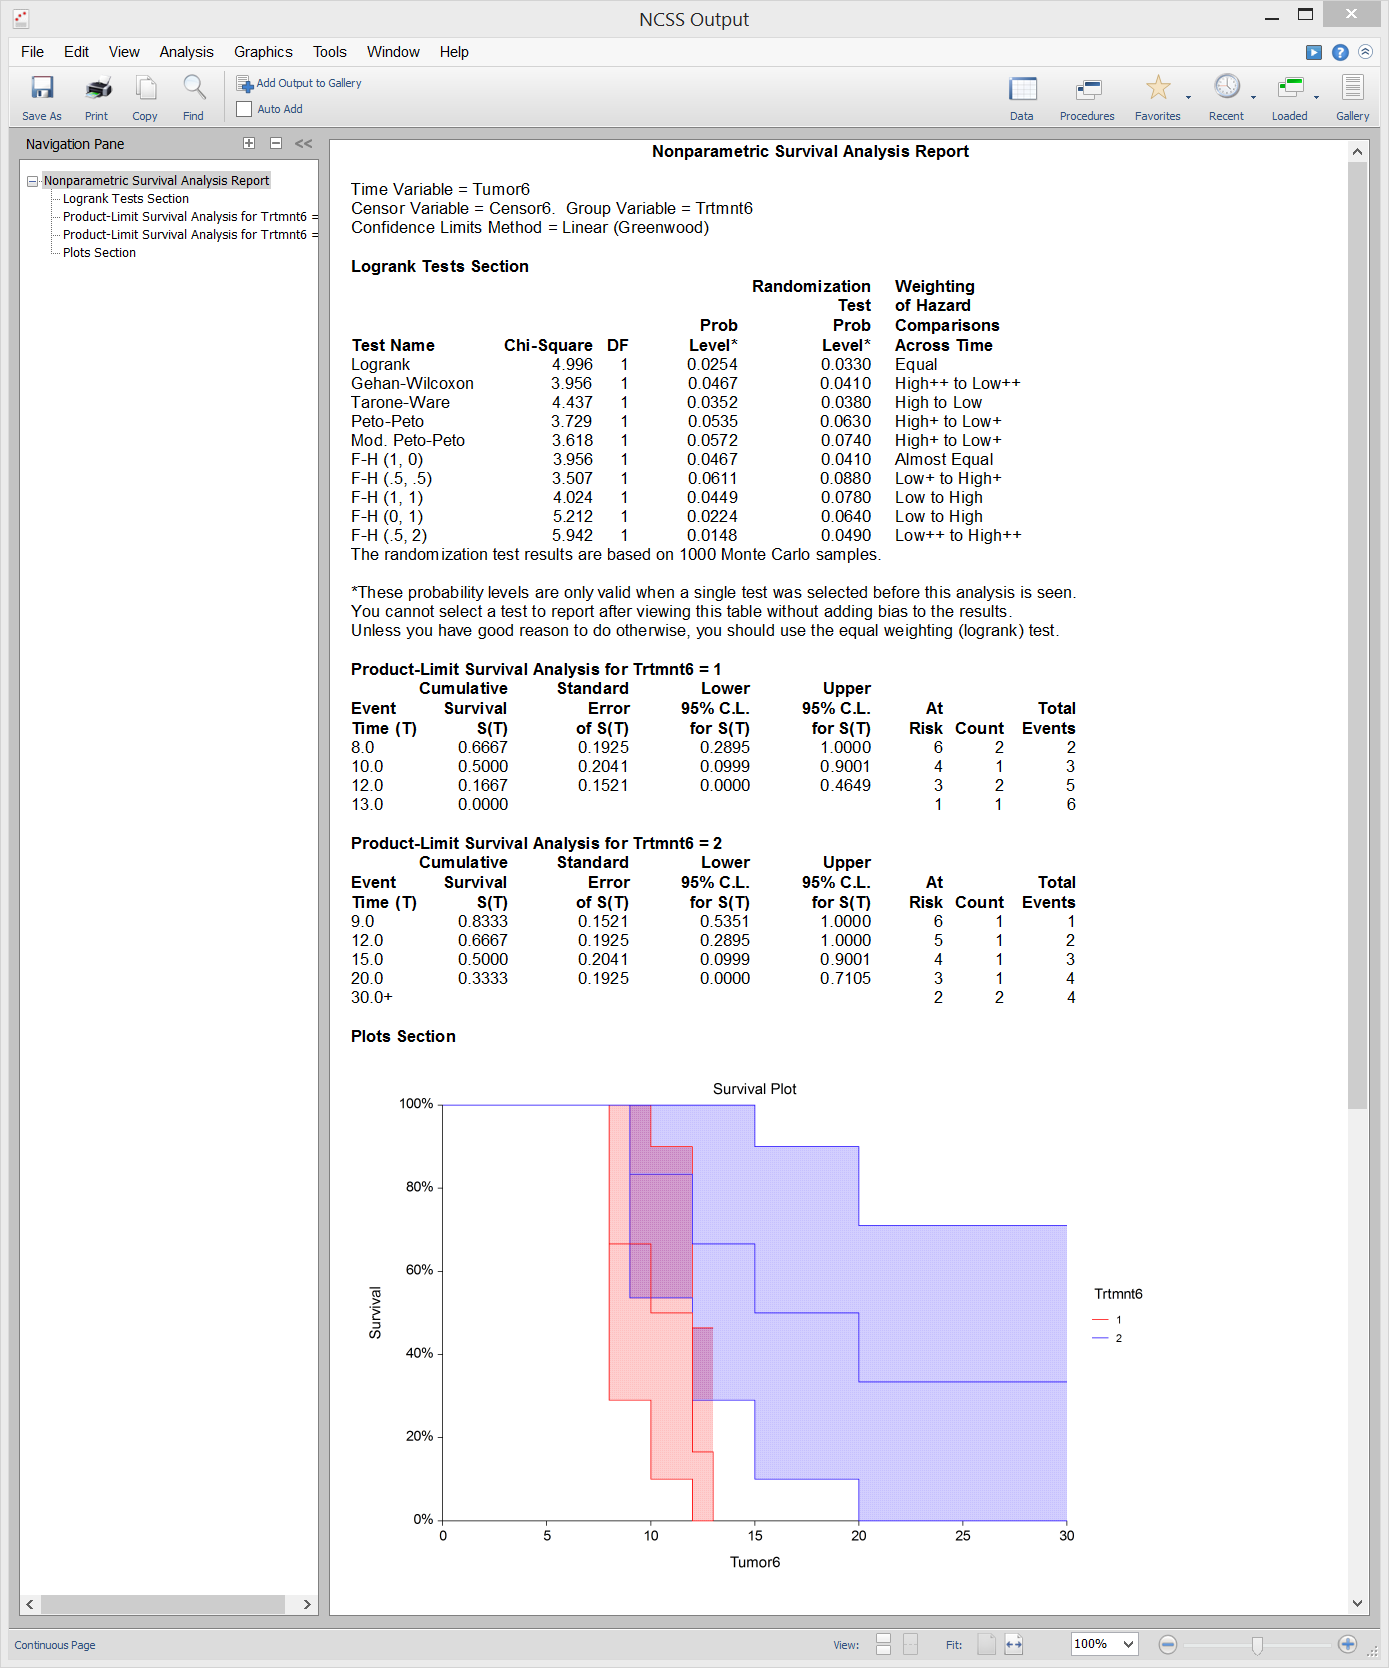
Kaplan-Meier curves are commonly used with survival (or reliability) data display graphically how many patients are living (or how many components have yet to fail) after a certain period of time has elapsed. Kaplan-Meier curves have broad application in medical survival studies and in reliability testing (e.g. time-to-failure of mechanical parts), among others. The Kaplan-Meier Curves (Logrank Tests) procedure in NCSS computes the nonparametric Kaplan-Meier product-limit estimator of the survival function from lifetime data that often includes censored values.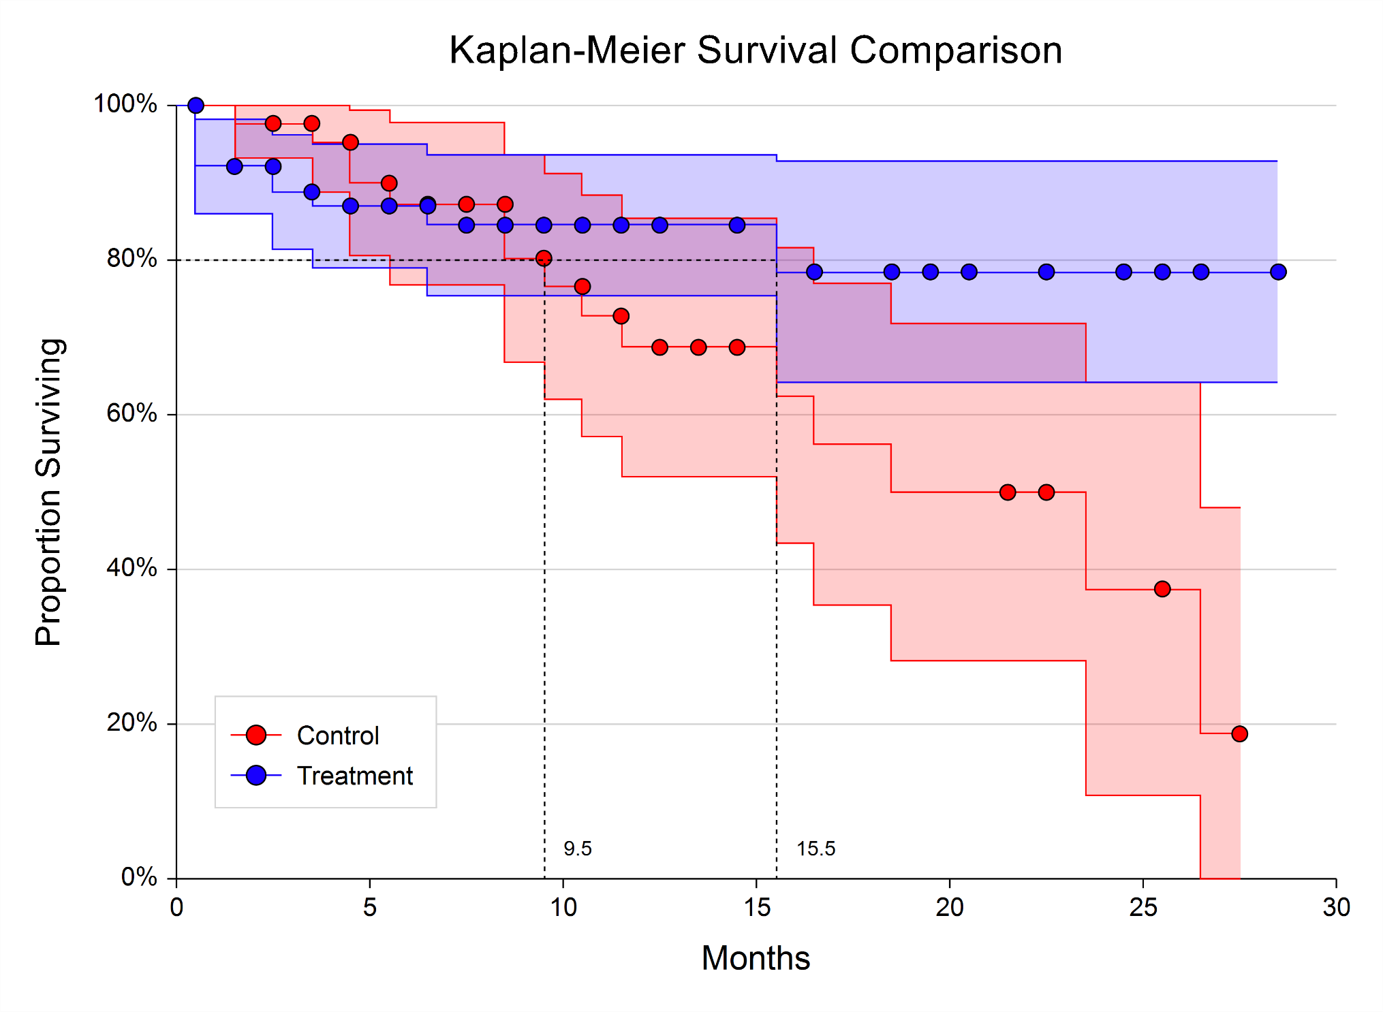 The procedure also calculates nonparametric Logrank tests for comparing survival distributions for two or more groups. The logrank test compares the hazard function estimates with equal weighting. This test has optimum power when the hazard rates of the K populations are proportional to each other.
Click here for more information about the Kaplan-Meier (Logrank Tests) procedure in NCSS.
Sample Output from the Kaplan-Meier Curves (Logrank Tests) Procedure
Cumulative Incidence Curves
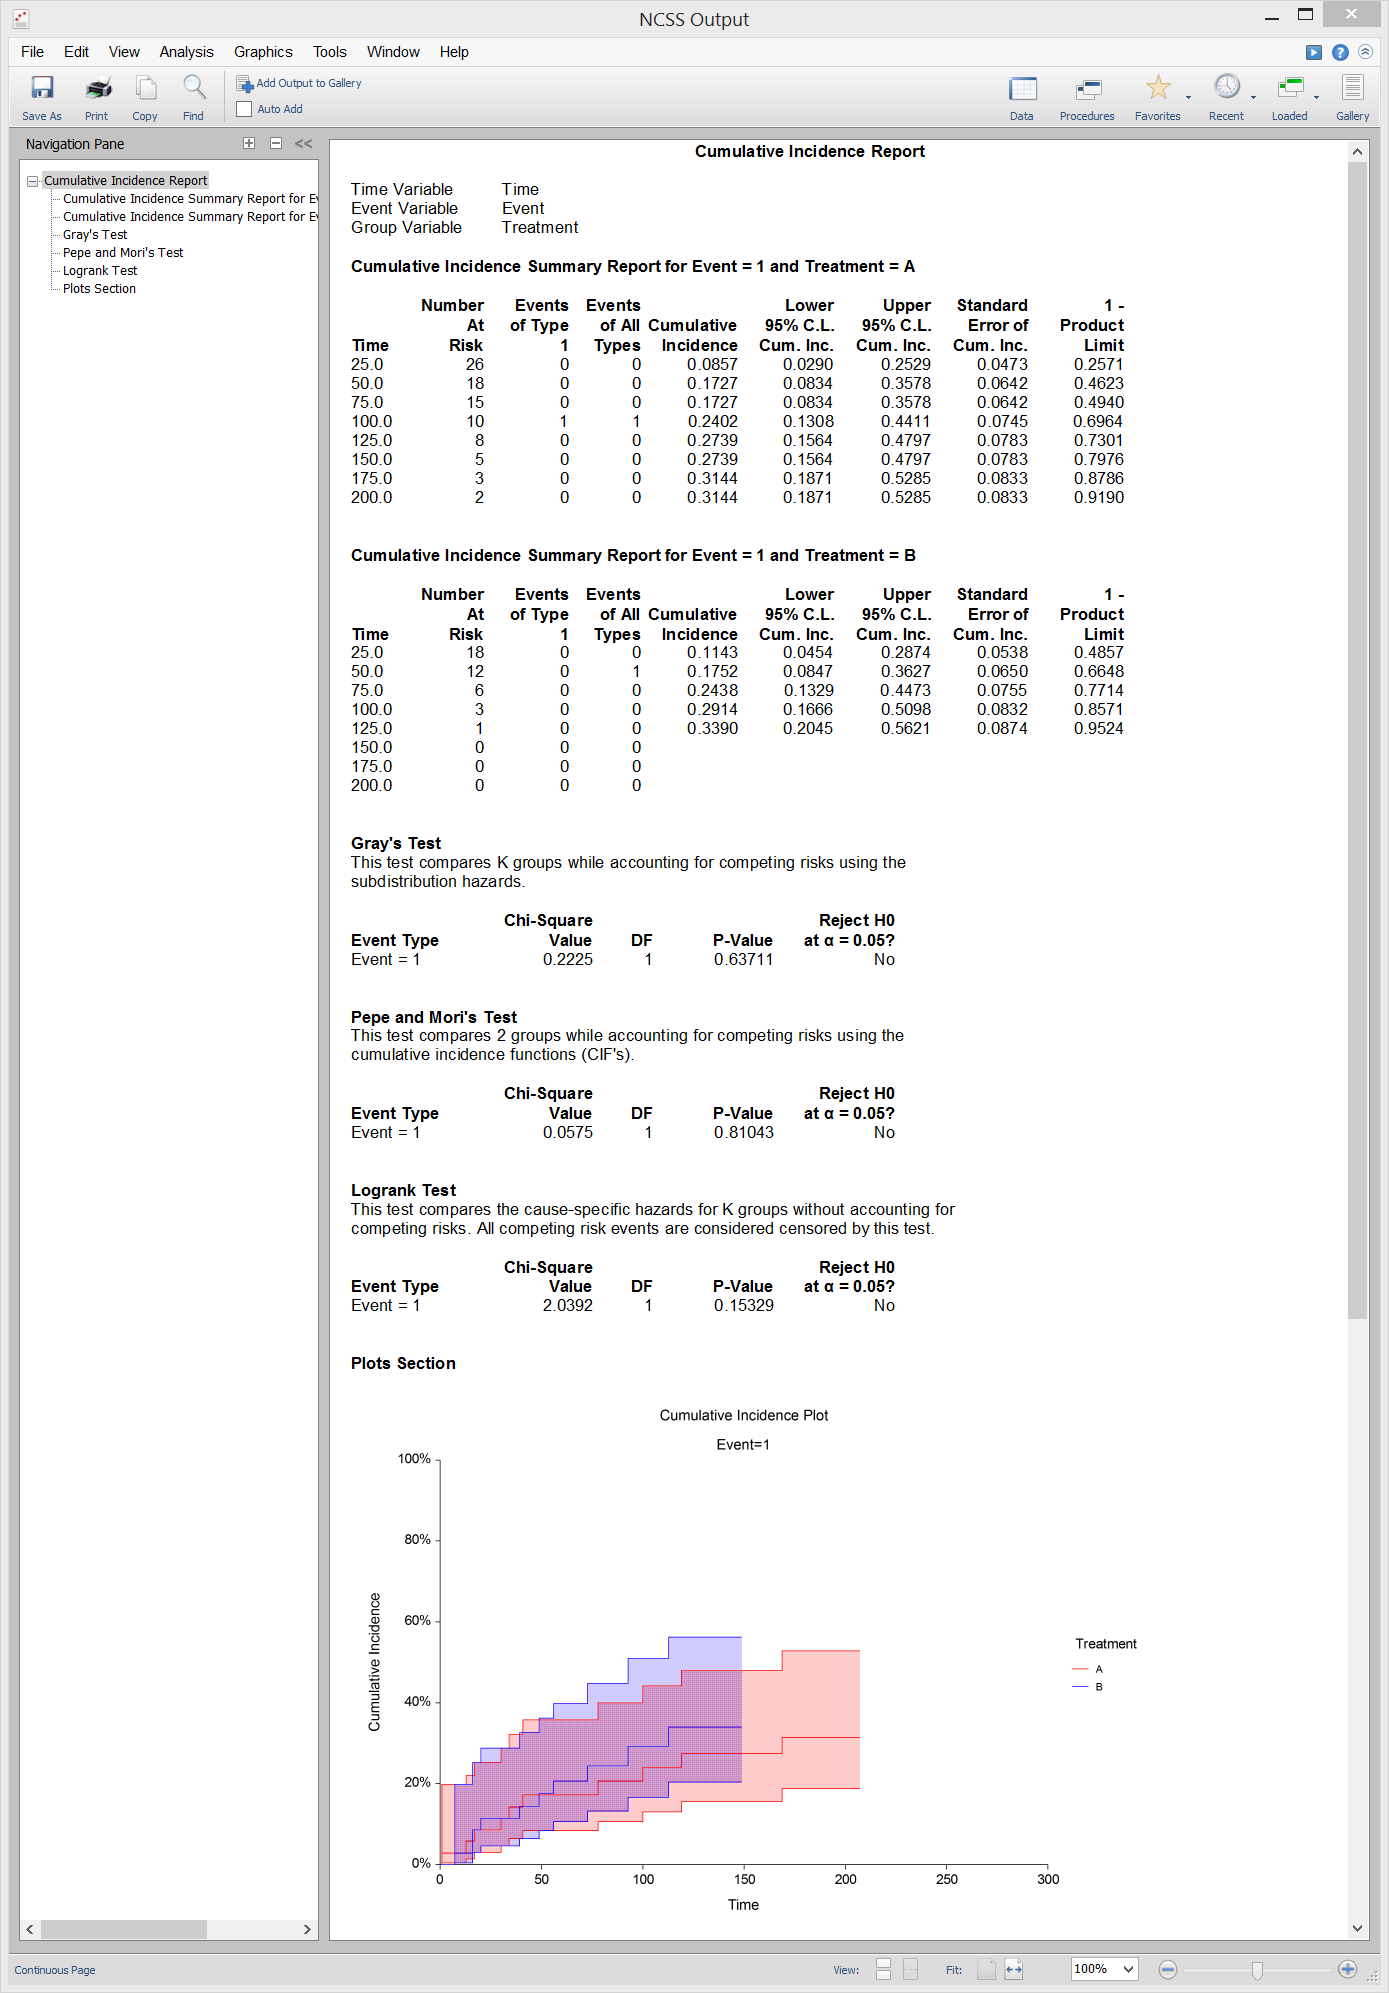
[Documentation PDF]The Cumulative Incidence procedure in NCSS computes the nonparametric, maximum-likelihood estimates and confidence limits of the probability of failure (i.e. the cumulative incidence) for a particular cause in the presence of other causes (competing risks). Click here for more information about the Cumulative Incidence procedure in NCSS.
Sample Output from the Cumulative Incidence Procedure
ROC
[Documentation PDF]NCSS has tools for analyzing ROC curves from a single sample, paired samples, and two independent samples.
ROC Curves
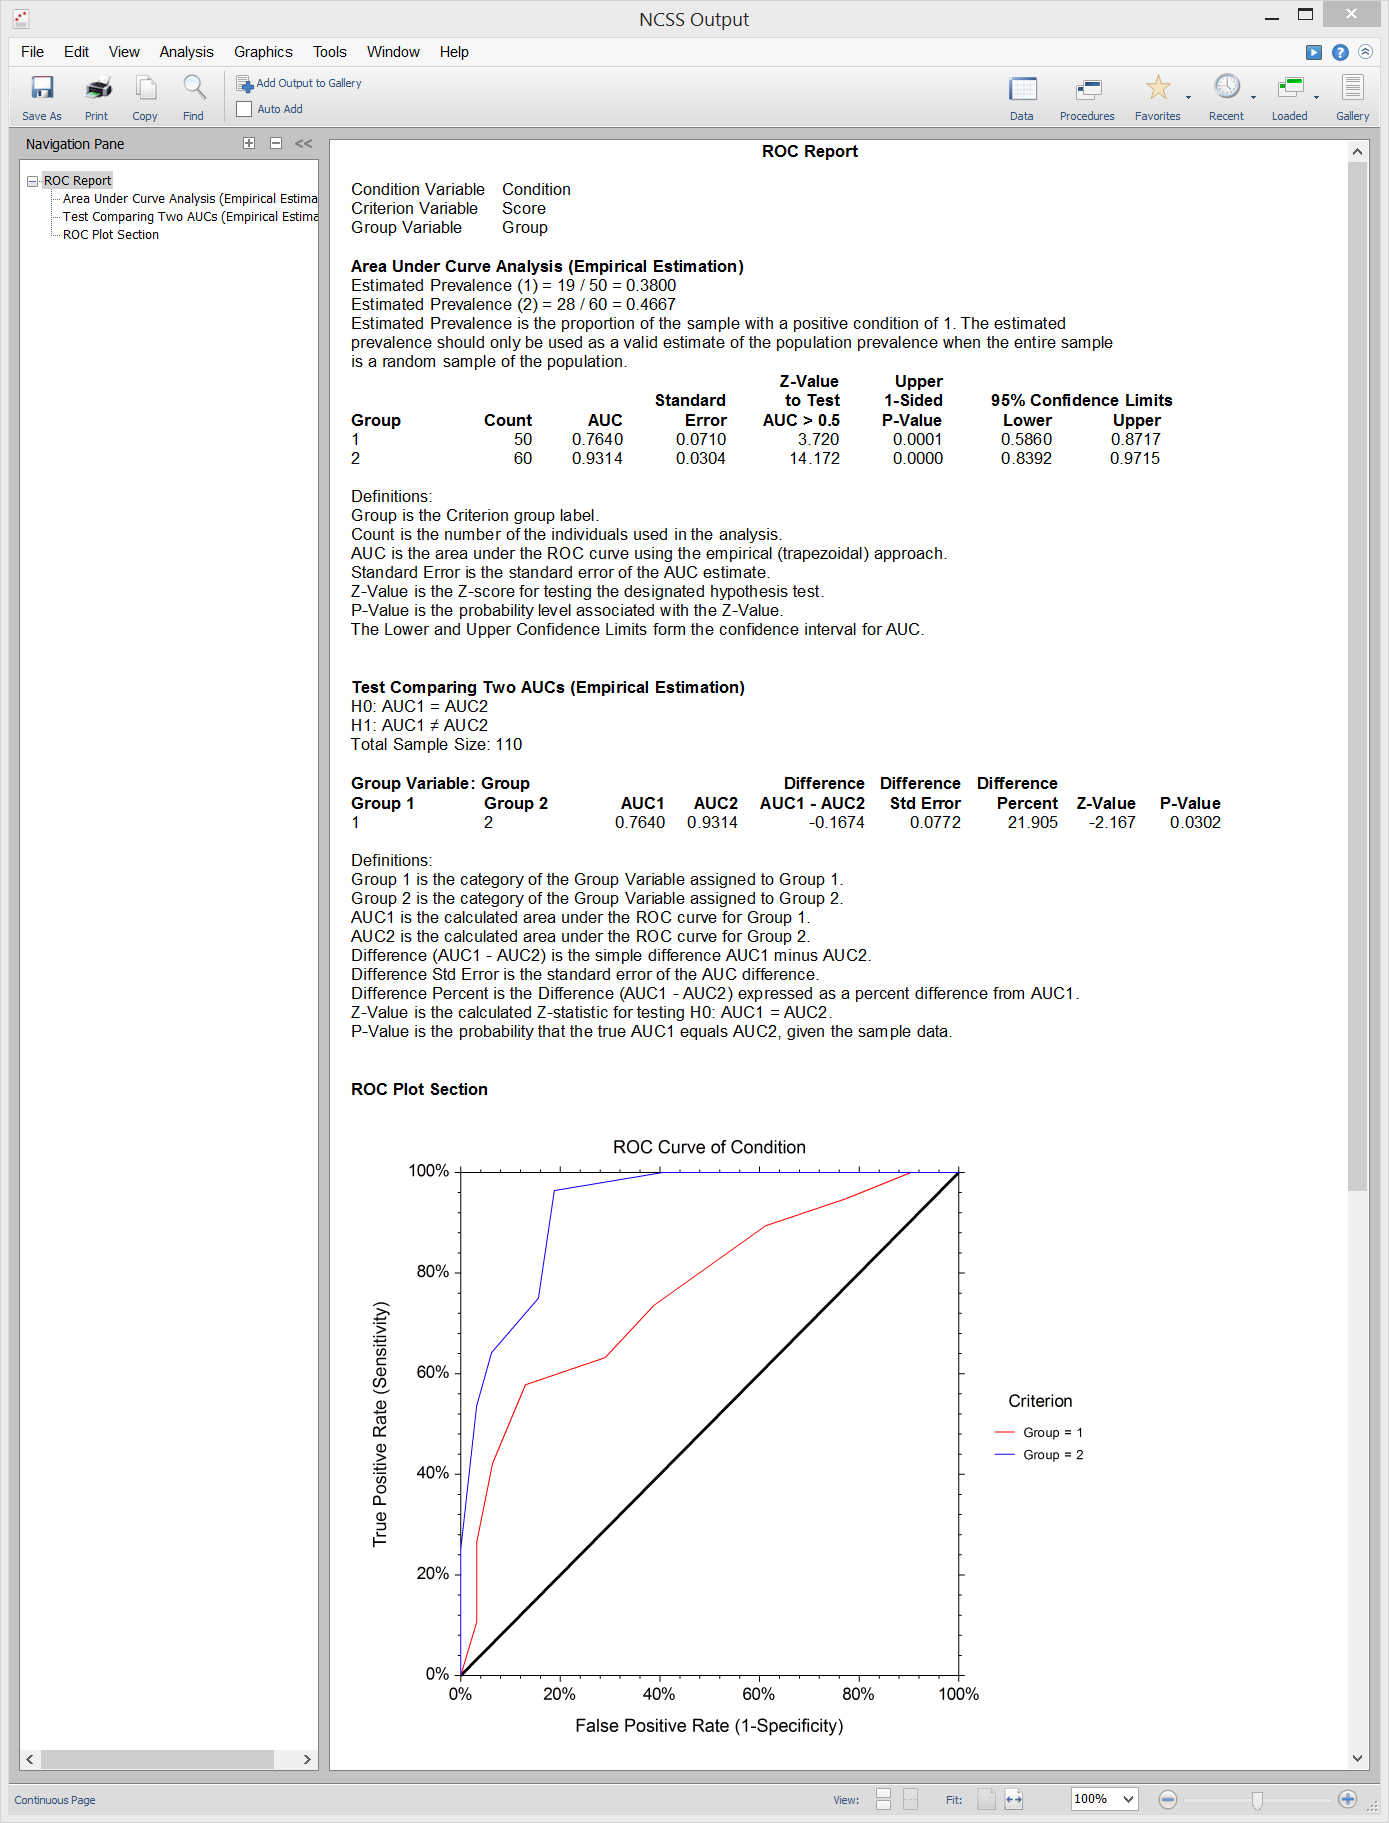
Empirical (i.e. nonparametric) Receiver Operating Characteristic (ROC) Curves show the characteristics of a diagnostic test by graphing the false-positive rate (1-specificity) on the horizontal axis and the true-positive rate (sensitivity) on the vertical axis for various cutoff values. Nonparametric methods are also available for comparing the Area Under the Curve (AUC) of two empirical ROC curves.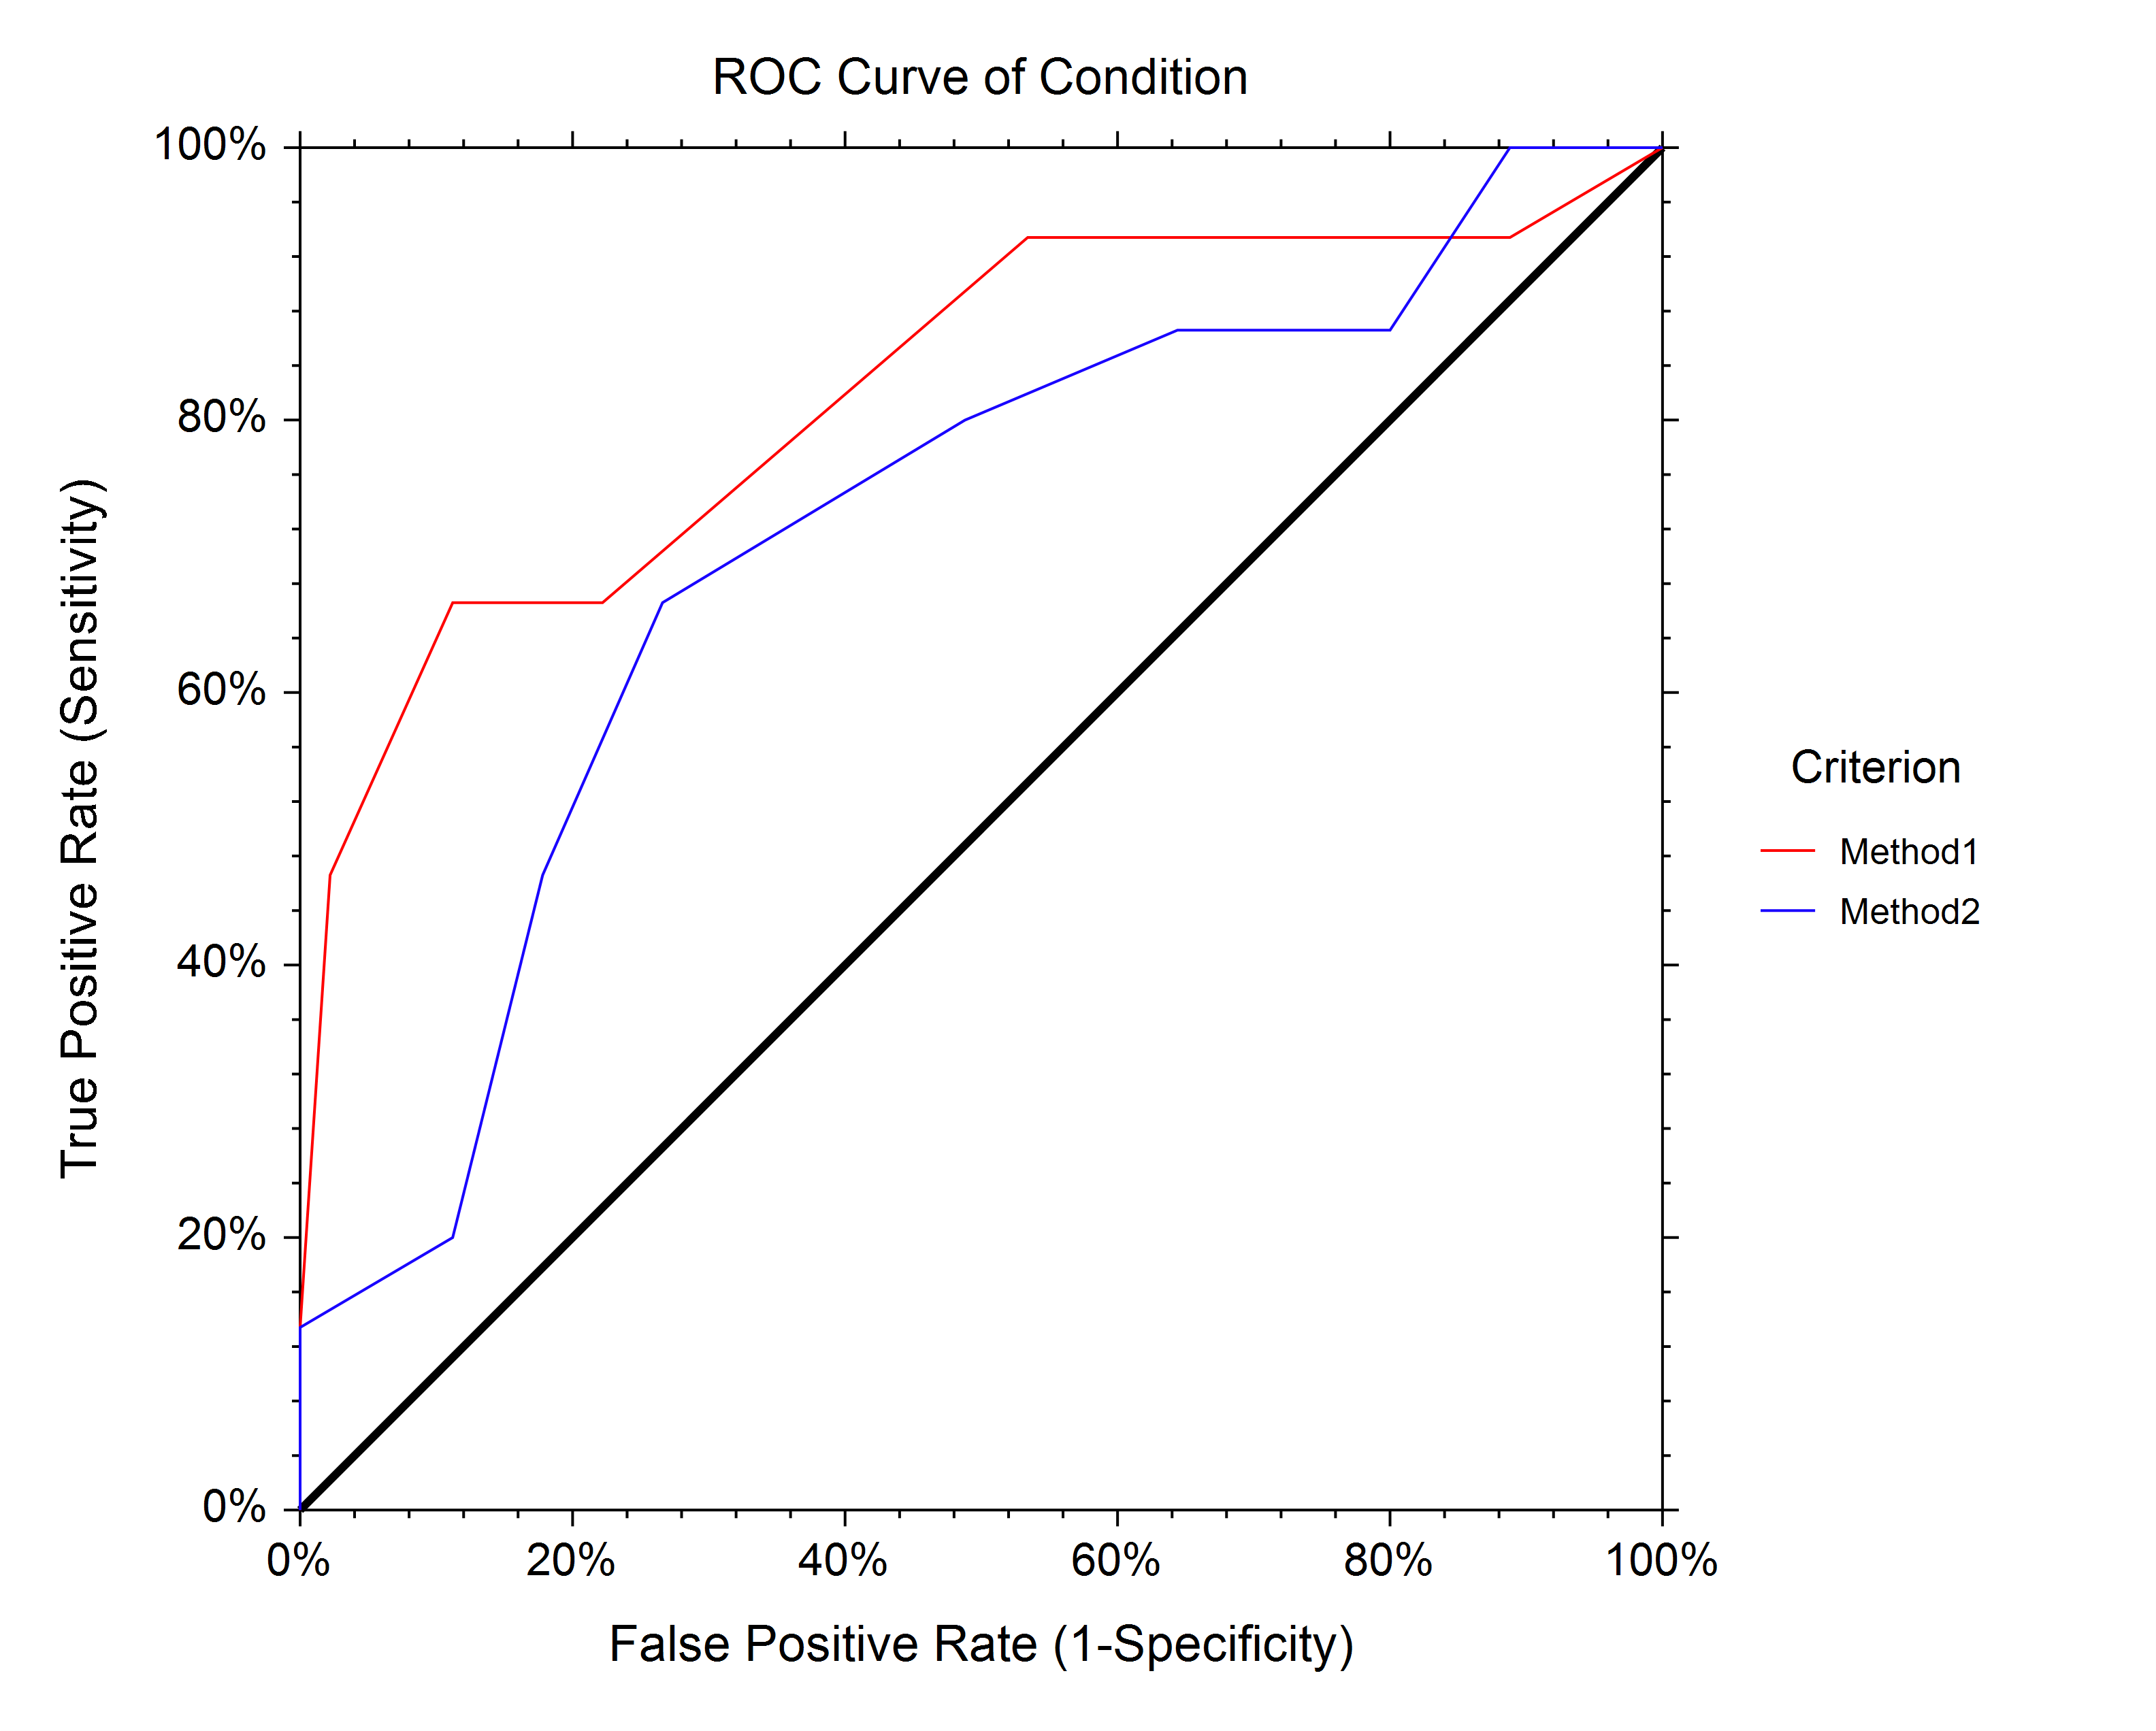 ROC Curves are available in the following procedures in NCSS:
- 1. One ROC Curve and Cutoff Analysis
- 2. Comparing Two ROC Curves - Paired Design
- 3. Comparing Two ROC Curves - Independent Groups Design
Sample Output from the Comparing Two ROC Curves - Independent Groups Design Procedure
Analysis of Runs
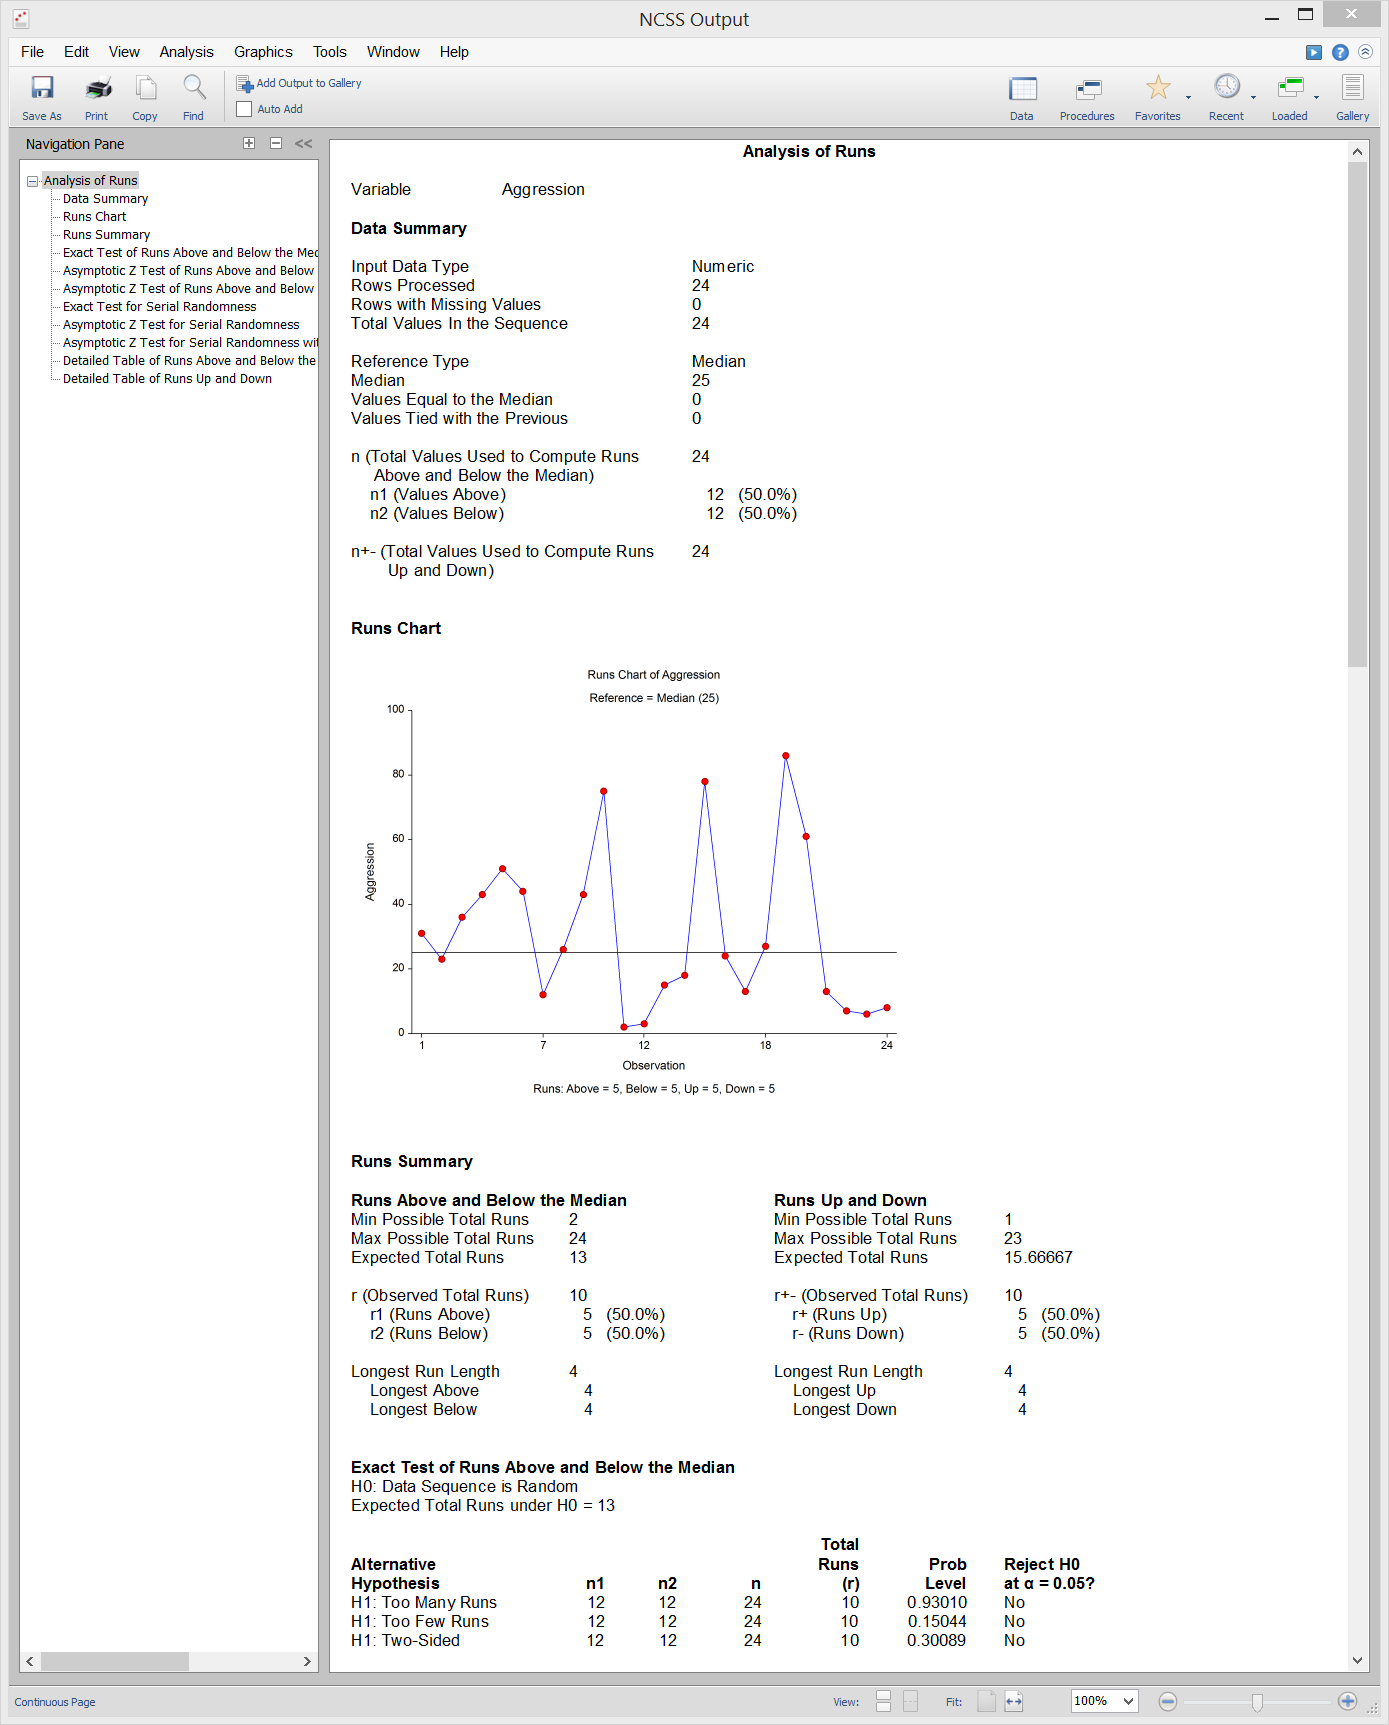
[Documentation PDF]NCSS computes summary statistics and common nonparametric, single-sample runs tests for a series of n numeric, binary, or categorical data values. Runs charts are also output in NCSS.
Runs Tests (e.g. Wald-Wolfowitz Runs Test)
Runs tests are most often used to test for data randomness. For numeric data, the exact and asymptotic Wald-Wolfowitz Runs Tests for Randomness are computed based on the number of runs above and below a reference value, along with exact and asymptotic Runs Tests for Serial Randomness based on the number of runs up and down. For binary data, the exact and asymptotic Wald-Wolfowitz Runs Tests for Randomness are computed based on the number of runs in each category. For categorical data, an asymptotic, k-category extension of the Wald-Wolfowitz Runs Test for Randomness is computed. The results in NCSS are based largely on the formulas given in chapter 10 of Sheskin (2011).Sample Output from the Analysis of Runs Procedure
