Multivariate Analysis in NCSS
NCSS includes a number of tools for multivariate analysis, the analysis of data with more than one dependent or Y variable. Factor Analysis, Principal Components Analysis (PCA), and Multivariate Analysis of Variance (MANOVA) are all well-known multivariate analysis techniques and all are available in NCSS, along with several other multivariate analysis procedures as outlined below. Use the links below to jump to the multivariate analysis topic you would like to examine. To see how these tools can benefit you, we recommend you download and install the free trial of NCSS. Jump to:- Introduction
- Technical Details
- Factor Analysis
- Principal Components Analysis (PCA)
- Canonical Correlation
- Equality of Covariance
- Discriminant Analysis
- Hotelling's One-Sample T²
- Hotelling's Two-Sample T²
- Multivariate Analysis of Variance (MANOVA)
- Correspondence Analysis
- Loglinear Models
- Multidimensional Scaling
Introduction
Although the term Multivariate Analysis can be used to refer to any analysis that involves more than one variable (e.g. in Multiple Regression or GLM ANOVA), the term multivariate analysis is used here and in NCSS to refer to situations involving multidimensional data with more than one dependent, Y, or outcome variable. Multivariate analysis techniques are used to understand how the set of outcome variables as a combined whole are influenced by other factors, how the outcome variables relate to each other, or what underlying factors produce the results observed in the dependent variables. Each of the procedures available in the NCSS Multivariate Analysis section is described below.Technical Details
This page is designed to give a general overview of the capabilities of NCSS for multivariate analysis techniques. If you would like to examine the formulas and technical details relating to a specific NCSS procedure, click on the corresponding '[Documentation PDF]' link under each heading to load the complete procedure documentation. There you will find formulas, references, discussions, and examples or tutorials describing the procedure in detail.Factor Analysis
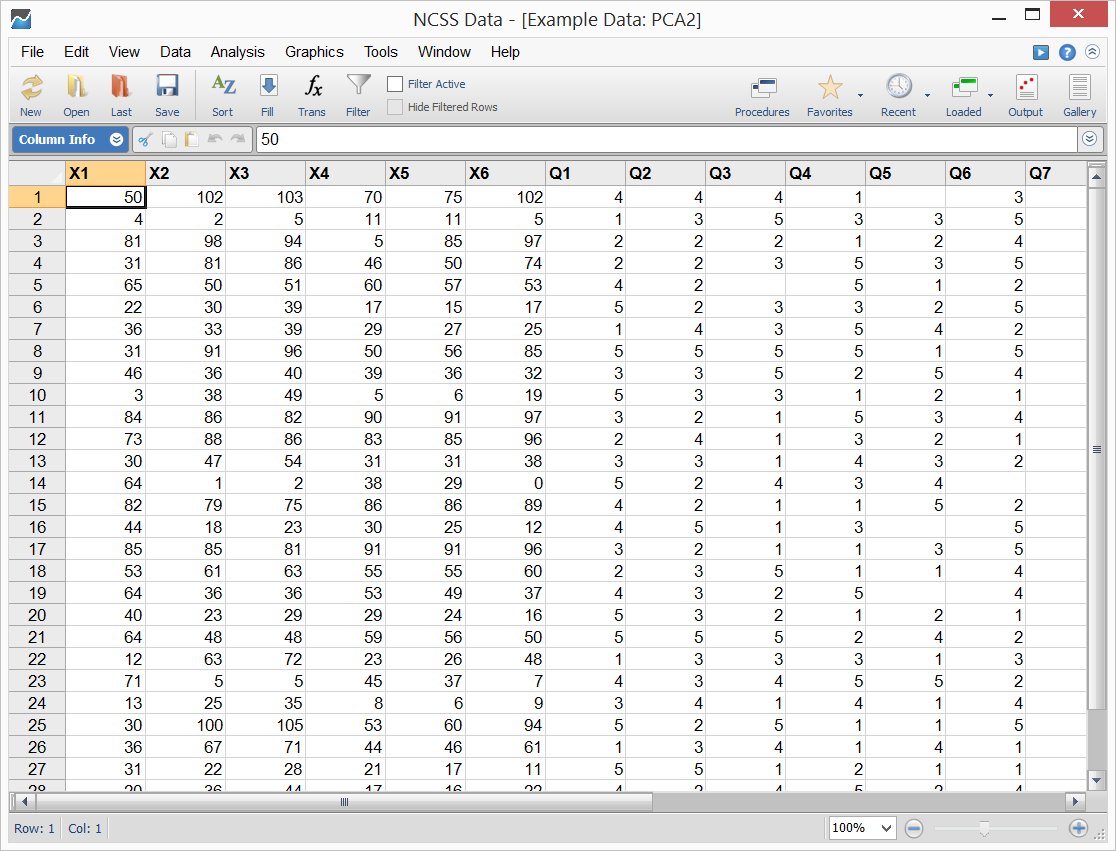
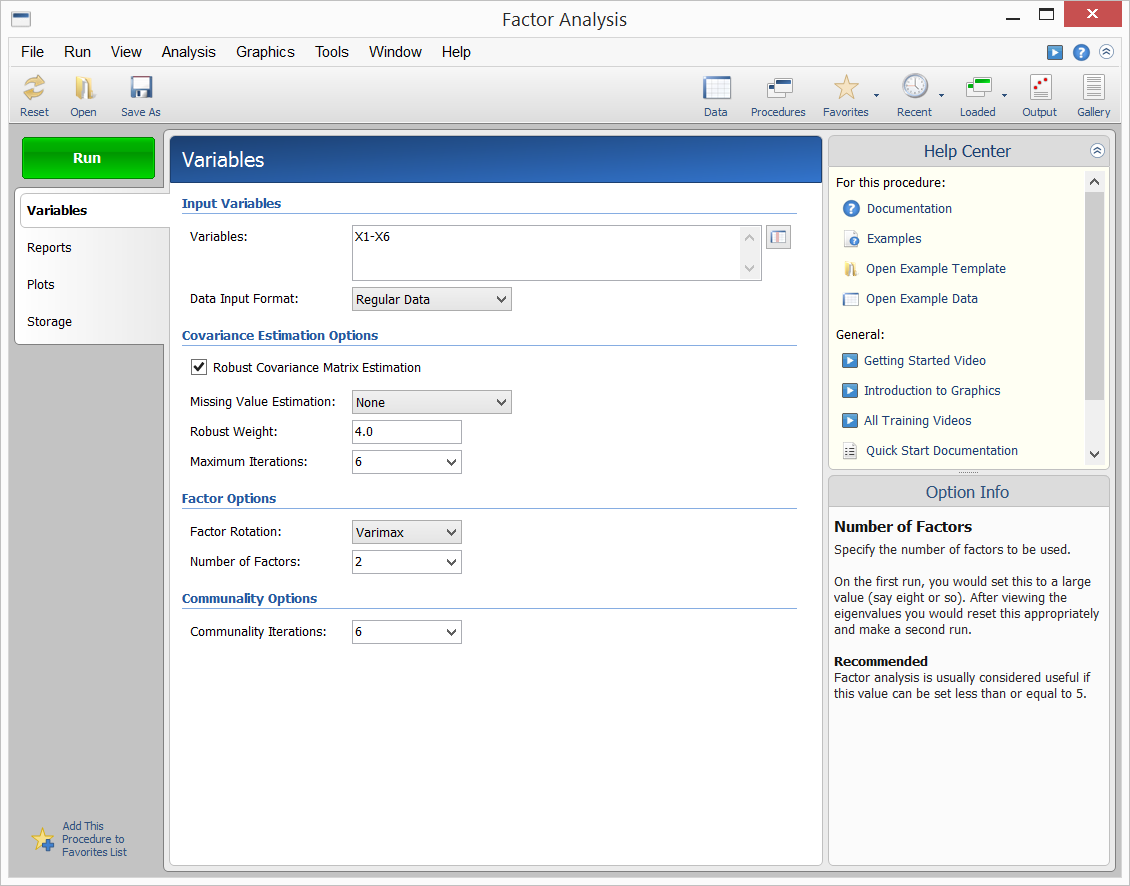
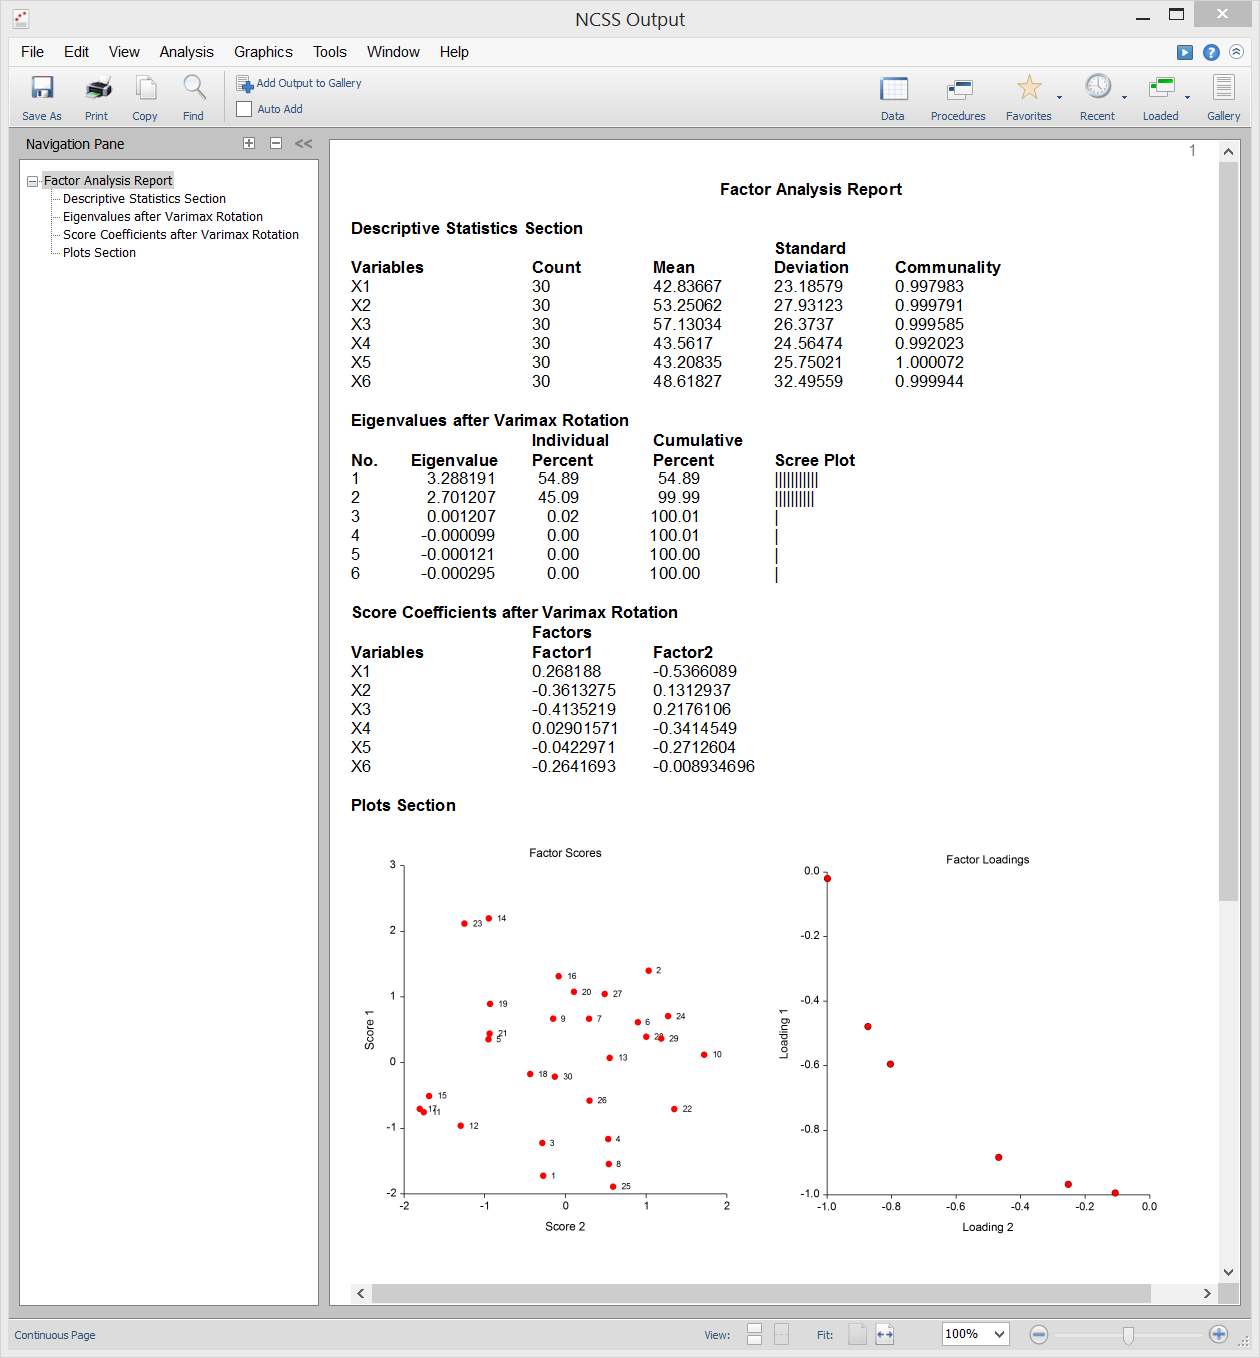
[Documentation PDF]Factor Analysis (FA) is an exploratory technique applied to a set of outcome variables that seeks to find the underlying factors (or subsets of variables) from which the observed variables were generated. For example, an individual’s response to the questions on an exam is influenced by underlying variables such as intelligence, years in school, age, emotional state on the day of the test, amount of practice taking tests, and so on. The answers to the questions are the observed or outcome variables. The underlying, influential variables are the factors. Factor analysis is carried out on the correlation matrix of the observed variables. A factor is a weighted average of the original variables. The factor analyst hopes to find a few factors from which the original correlation matrix may be generated. Usually the goal of factor analysis is to aid data interpretation. The factor analyst hopes to identify each factor as representing a specific theoretical factor. Another goal of factor analysis is to reduce the number of variables. The analyst hopes to reduce the interpretation of a 200-question test to the study of 4 or 5 factors. NCSS provides the principal axis method of factor analysis. The results may be rotated using varimax or quartimax rotation and the factor scores may be stored for further analysis. Sample data, procedure input, and output is shown below.
Sample Data
Procedure Input
Sample Output
Principal Components Analysis (PCA)
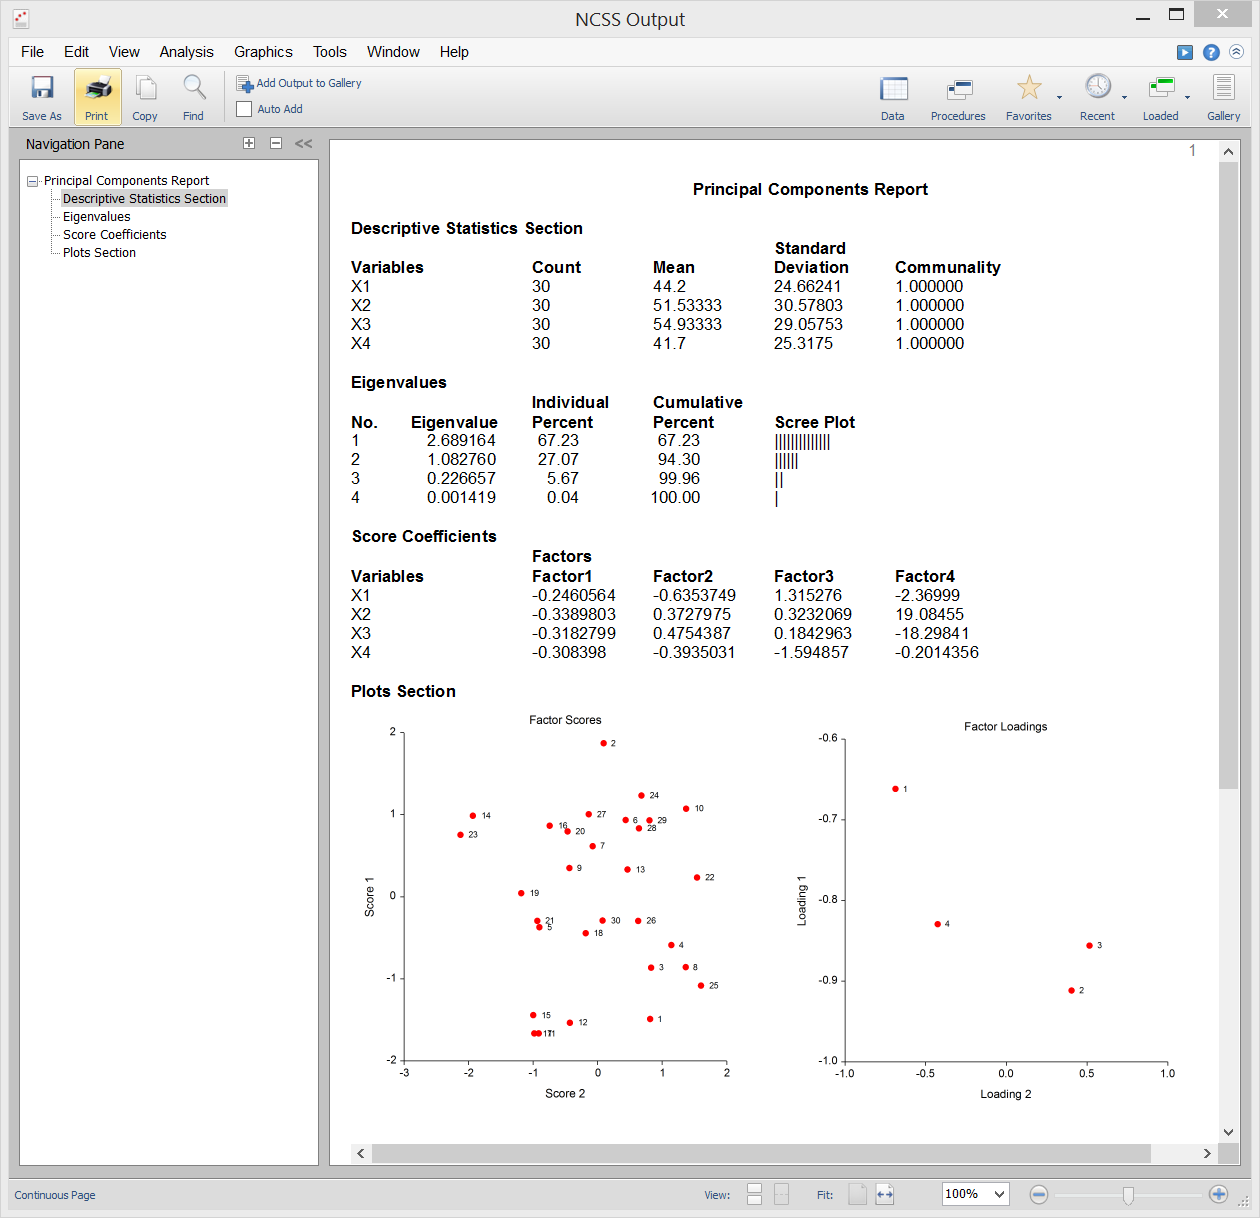
[Documentation PDF]Principal Components Analysis (or PCA) is a data analysis tool that is often used to reduce the dimensionality (or number of variables) from a large number of interrelated variables, while retaining as much of the information (e.g. variation) as possible. PCA calculates an uncorrelated set of variables known as factors or principal components. These factors are ordered so that the first few retain most of the variation present in all of the original variables. Unlike its cousin Factor Analysis, PCA always yields the same solution from the same data. NCSS uses a double-precision version of the modern QL algorithm as described by Press (1986) to solve the eigenvalue-eigenvector problem involved in the computations of PCA. NCSS performs PCA on either a correlation or a covariance matrix. The analysis may be carried out using robust estimation techniques.
Sample Output
Canonical Correlation
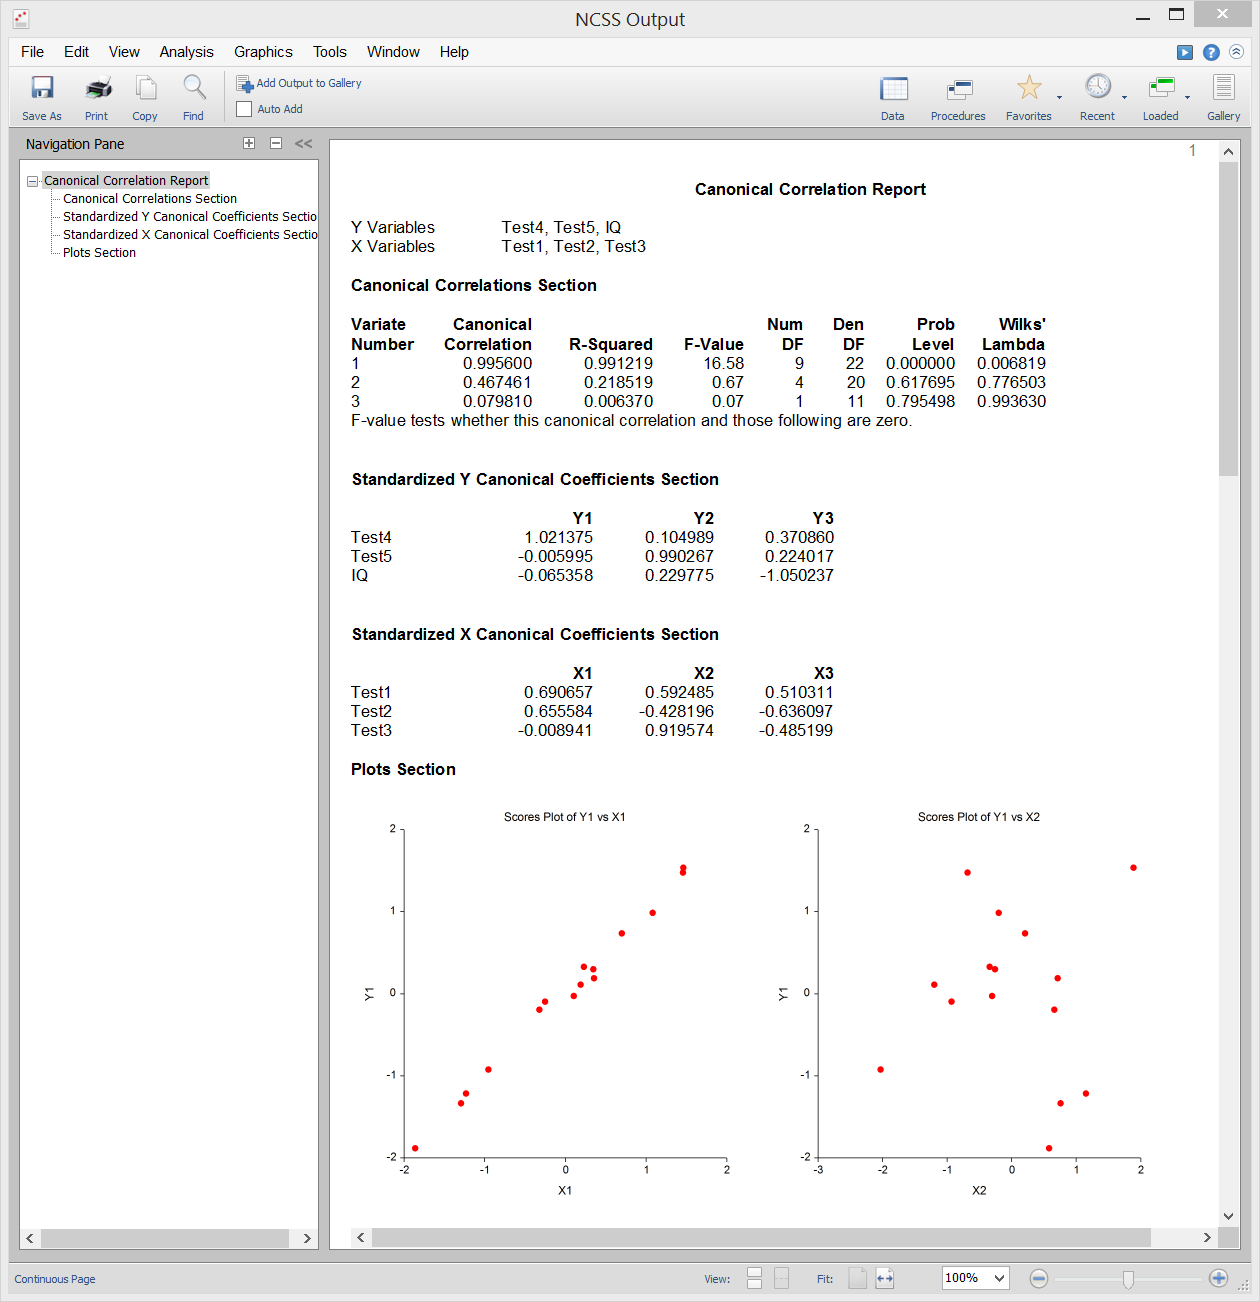
[Documentation PDF]Canonical correlation analysis is the study of the linear relationship between two sets of variables. It is the multivariate extension of correlation analysis. By way of illustration, suppose a group of students is each given two tests of ten questions each and you wish to determine the overall correlation between these two tests. Canonical correlation finds a weighted average of the questions from the first test and correlates this with a weighted average of the questions from the second test. Weights are constructed to maximize the correlation between these two averages. This correlation is called the first canonical correlation coefficient. You can then create another set of weighted averages unrelated to the first and calculate their correlation. This correlation is the second canonical correlation coefficient. The process continues until the number of canonical correlations equals the number of variables in the smallest group. Canonical correlation provides the most general multivariate framework (Discriminant analysis, MANOVA, and multiple regression are all special cases of canonical correlation). Because of this generality, canonical correlation is probably the least used of the multivariate procedures.
Sample Output
Equality of Covariance
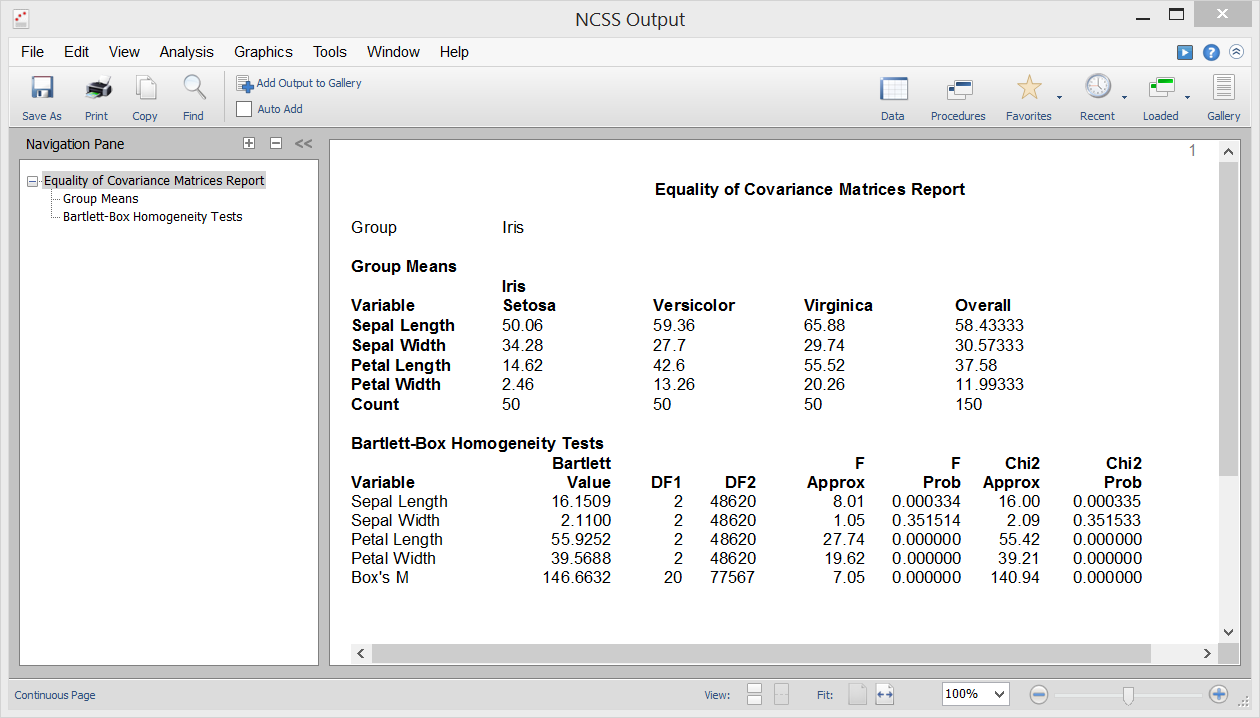
[Documentation PDF]One of the assumptions in Discriminant Analysis, MANOVA, and various other multivariate procedures is that the individual group covariance matrices are equal (i.e. homogeneous across groups). The Equality of Covariance procedure in NCSS lets you test this hypothesis using Box’s M test, which was first presented by Box (1949). This procedure also outputs Bartlett’s univariate homogeneity of variance test for testing equality of variance among individual variables.
Sample Output
Discriminant Analysis
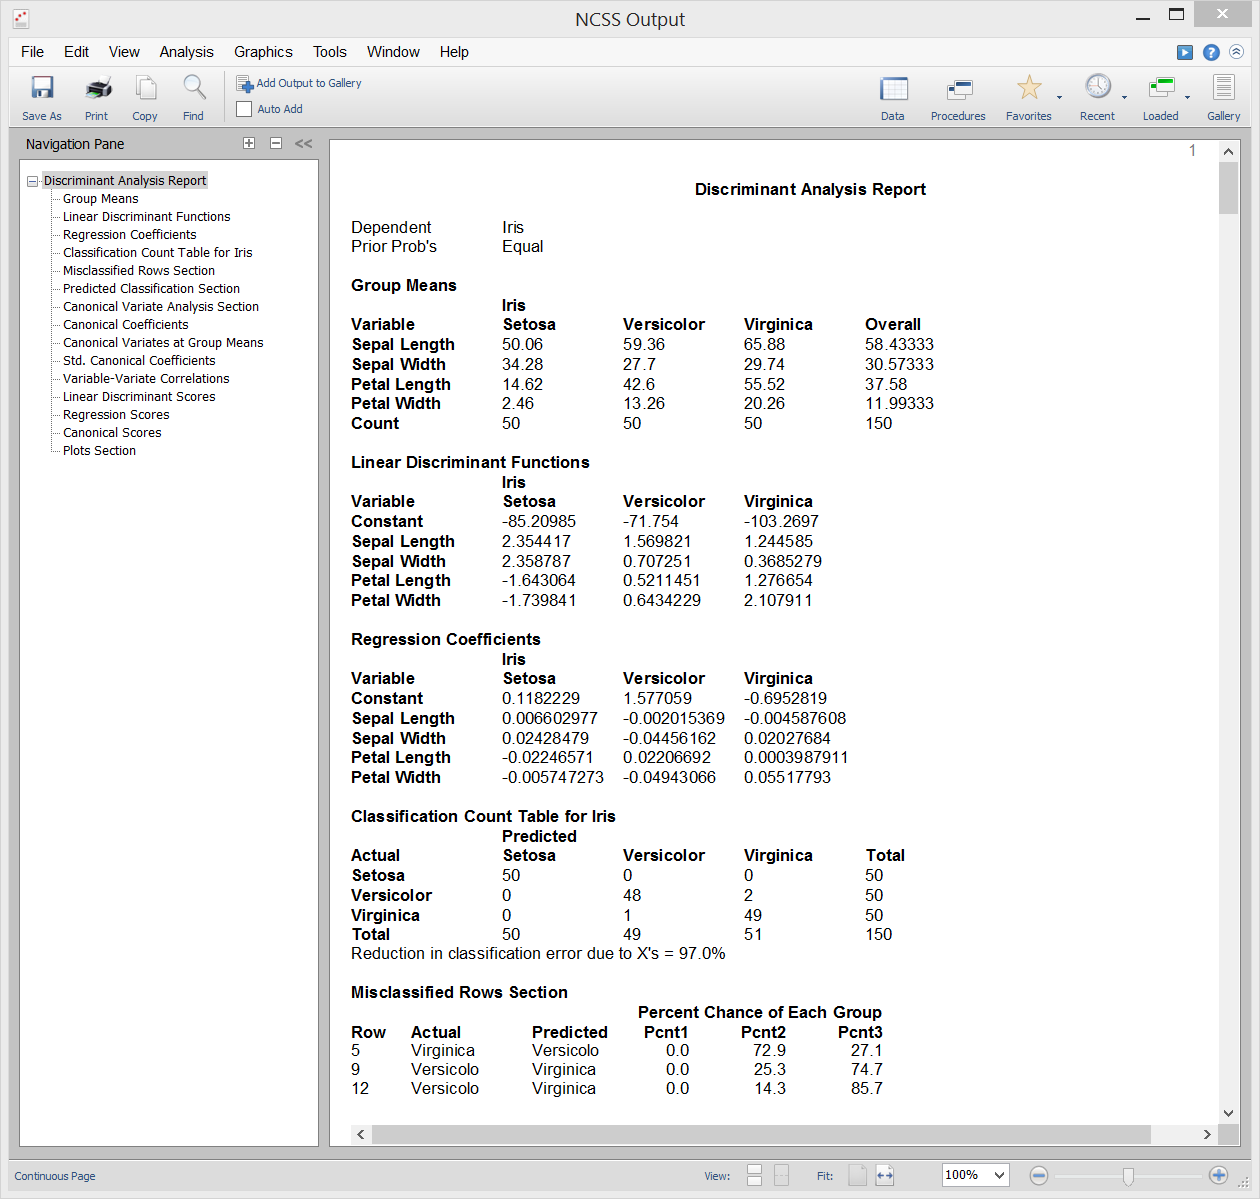
[Documentation PDF]Discriminant Analysis is a technique used to find a set of prediction equations based on one or more independent variables. These prediction equations are then used to classify individuals into groups. There are two common objectives in discriminant analysis: 1. finding a predictive equation for classifying new individuals, and 2. interpreting the predictive equation to better understand the relationships among the variables. In many ways, discriminant analysis is much like logistic regression analysis. The methodology used to complete a discriminant analysis is similar to logistic regression analysis. You often plot each independent variable versus the group variable, go through a variable selection phase to determine which independent variables are beneficial, and conduct a residual analysis to determine the accuracy of the discriminant equations. The computations in discriminant analysis are very closely related to one-way MANOVA. In fact, the roles of the variables are simply reversed. The classification (factor) variable in the MANOVA becomes the dependent variable in discriminant analysis. The dependent variables in one-way MANOVA become the independent variables in the discriminant analysis.
Sample Output
Hotelling's One-Sample T²
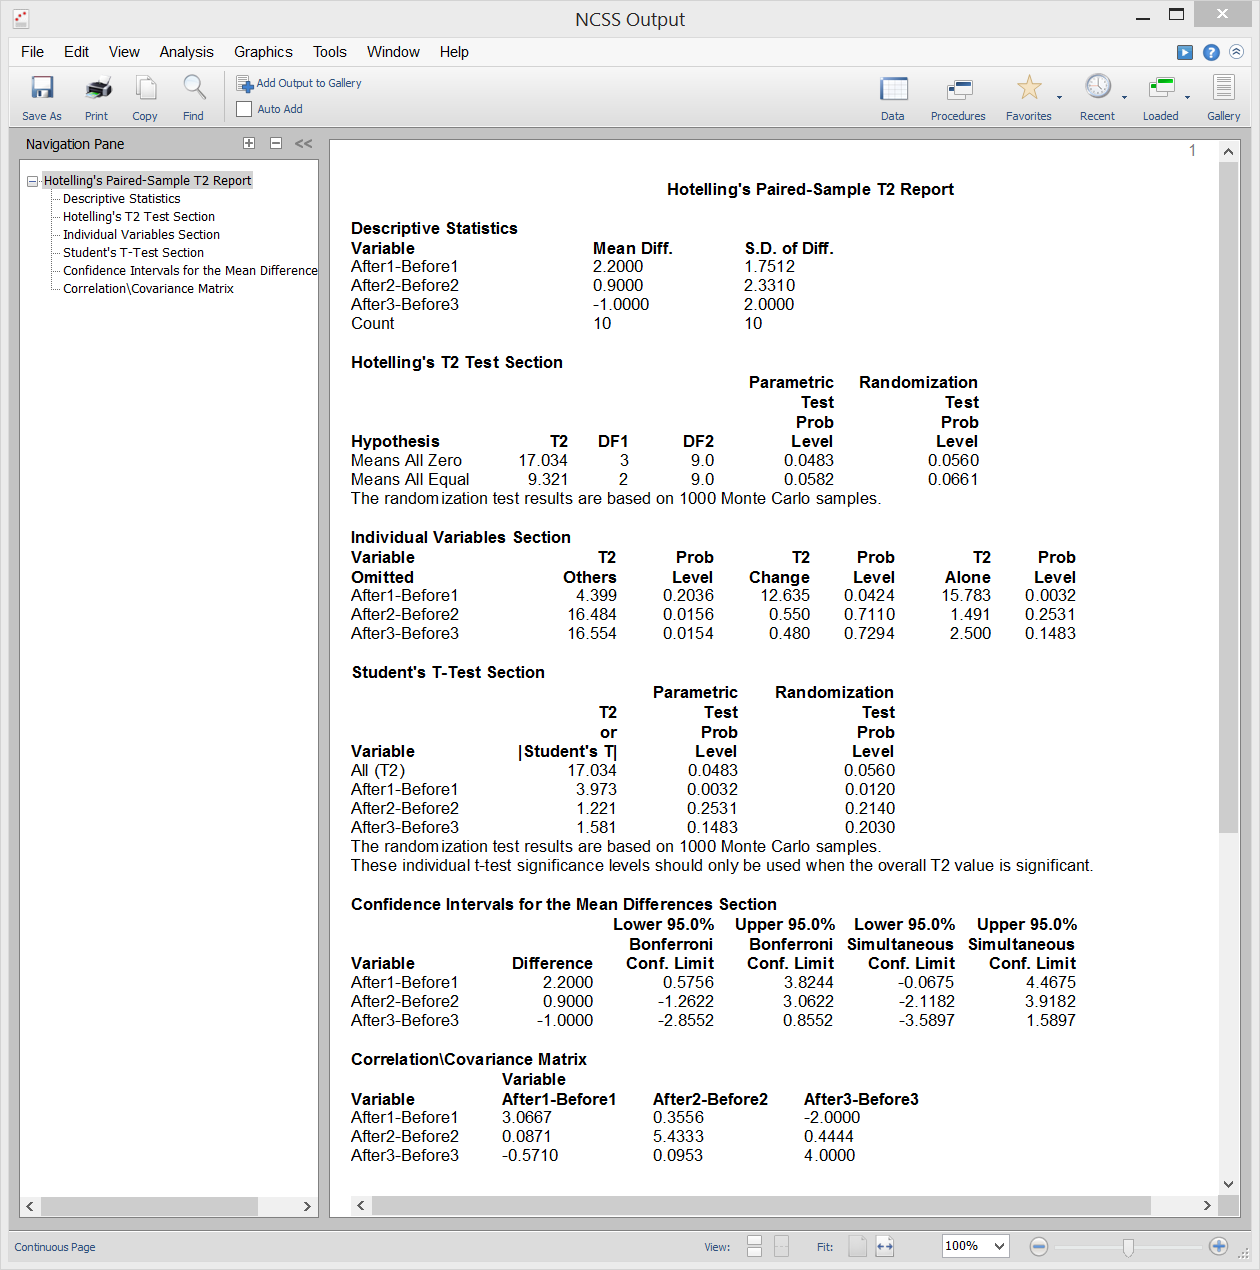
[Documentation PDF]Hotelling’s One-Sample T² test is the multivariate extension of the common one-sample or paired Student’s T-test. This test is used when the number of response variables is two or more, although it can be used when there is only one response variable. The test requires the assumption that the data are approximately multivariate normal, however randomization tests are provided that do not rely on this assumption.
Sample Output
Hotelling's Two-Sample T²
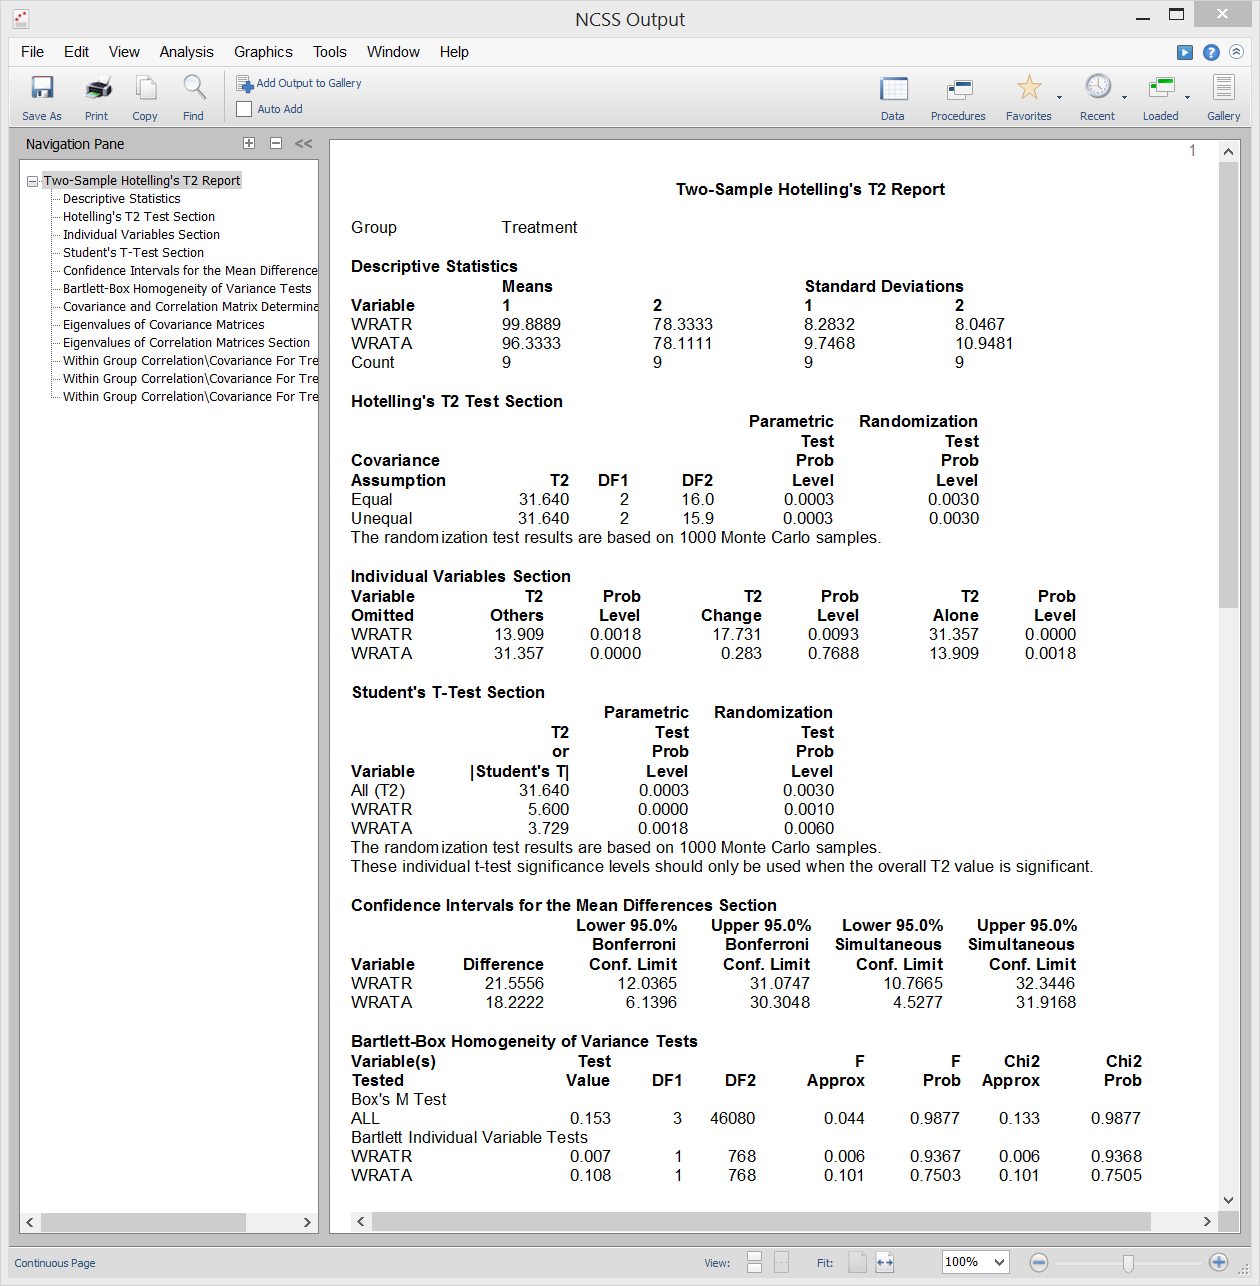
[Documentation PDF]Hotelling’s Two-Sample T² test is the multivariate extension of the common two-sample Student’s T-test for difference in means. This test is used when the number of response variables is two or more, although it can be used when there is only one response variable. The test requires the assumptions of equal variances and normally distributed residuals, however randomization tests are provided that do not rely on these assumptions.
Sample Output
Multivariate Analysis of Variance (MANOVA)
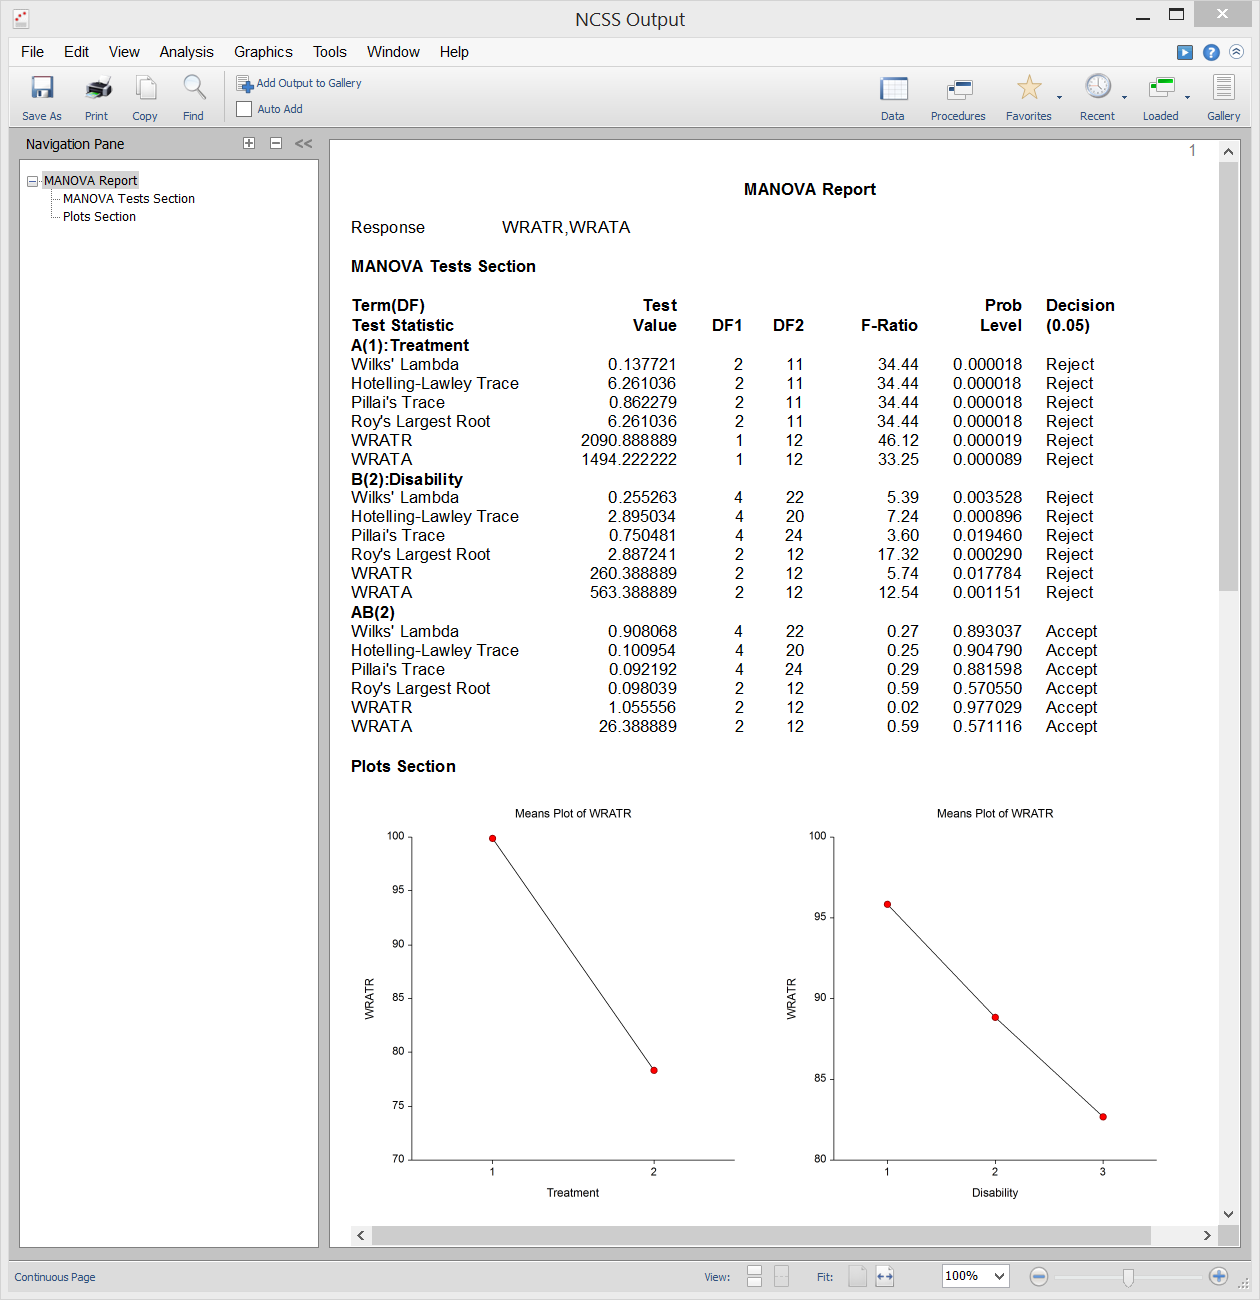
[Documentation PDF]Multivariate Analysis of Variance (or MANOVA) is an extension of ANOVA to the case where there are two or more response variables. MANOVA is designed for the case where you have one or more independent factors (each with two or more levels) and two or more dependent variables. The hypothesis tests involve the comparison of vectors of group means. The multivariate extension of the F-test from ANOVA is not completely direct. Instead, several other test statistics are available in MANOVA: Wilks’ Lambda, Hotelling-Lawley Trace, Pillai’s Trace, and Roy’s Largest Root. The actual distributions of these test statistics are difficult to calculate, so we rely on approximations based on the F-distribution to calculate p-values.
Sample Output
Correspondence Analysis
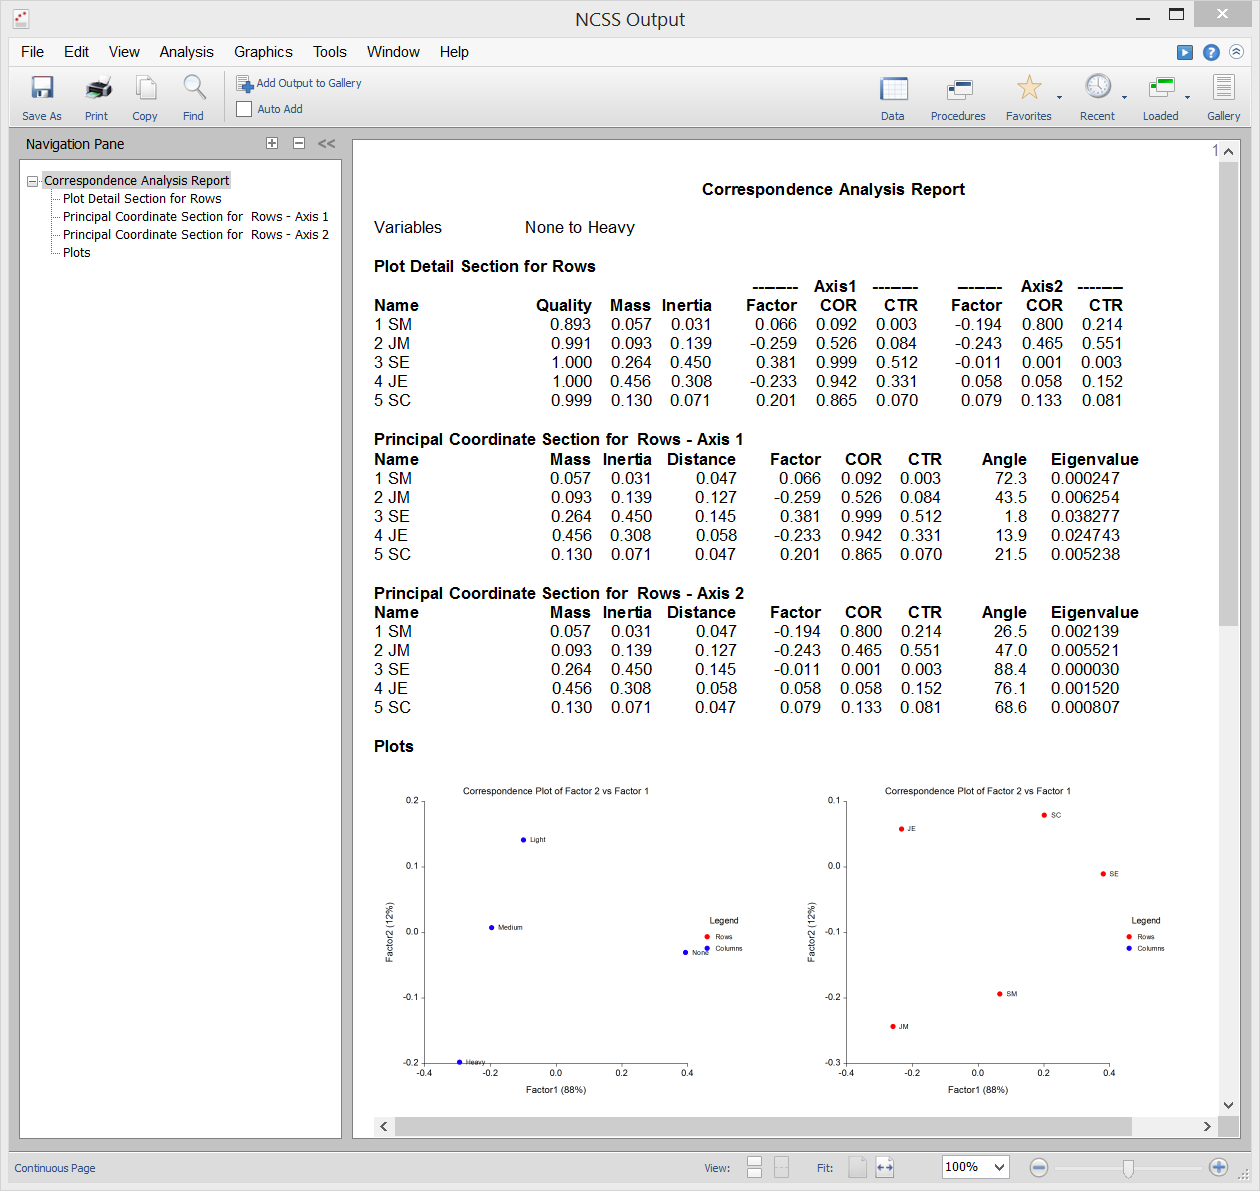
[Documentation PDF]Correspondence Analysis (or CA) is a technique for graphically displaying a two-way table of categorical data using calculated coordinates representing the table’s rows and columns. These coordinates are analogous to factors in a principal components analysis (used for continuous data) except that they partition the Chi-square value used in testing independence instead of the total variance.
Sample Output
Loglinear Models
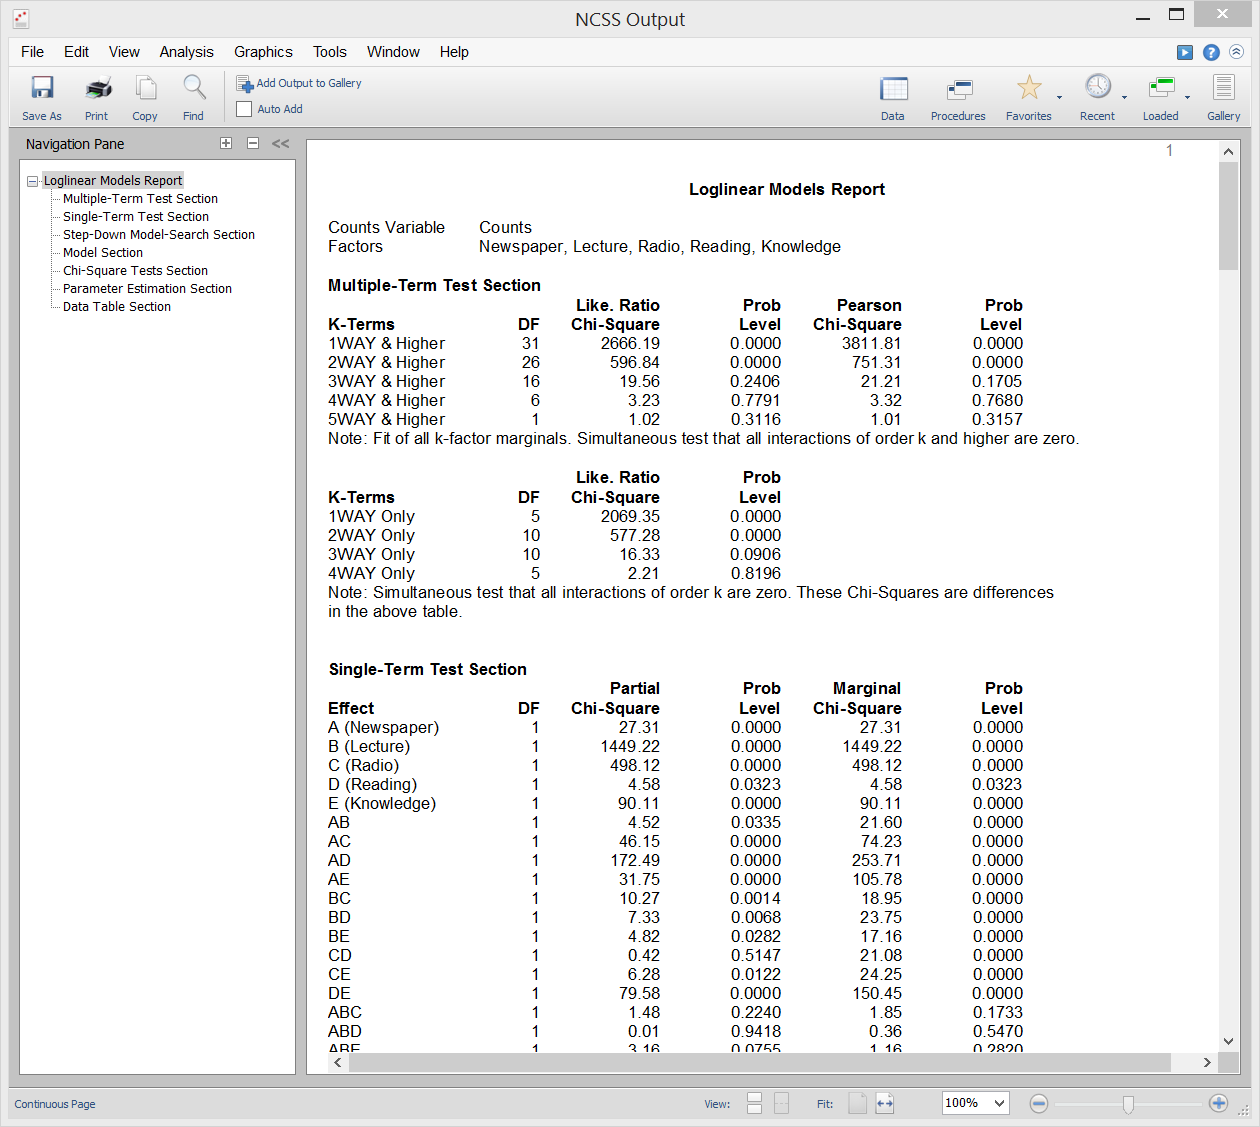
[Documentation PDF]Loglinear models (LLM) are used to study the relationships among two or more discrete variables. Often referred to as multiway frequency analysis, it is an extension of the familiar chi-square test for independence in two-way contingency tables. LLM may be used to analyze surveys and questionnaires which have complex interrelationships among the questions. Although questionnaires are often analyzed by considering only two questions at a time, this ignores important three-way (and multi-way) relationships among the questions. The use of LLM on this type of data is analogous to the use of multiple regression rather that simple correlations on continuous data. Reports in this procedure include multi-term reports, single-term reports, chi-square reports, model reports, parameter estimation reports, and table reports.
Sample Output
Multidimensional Scaling
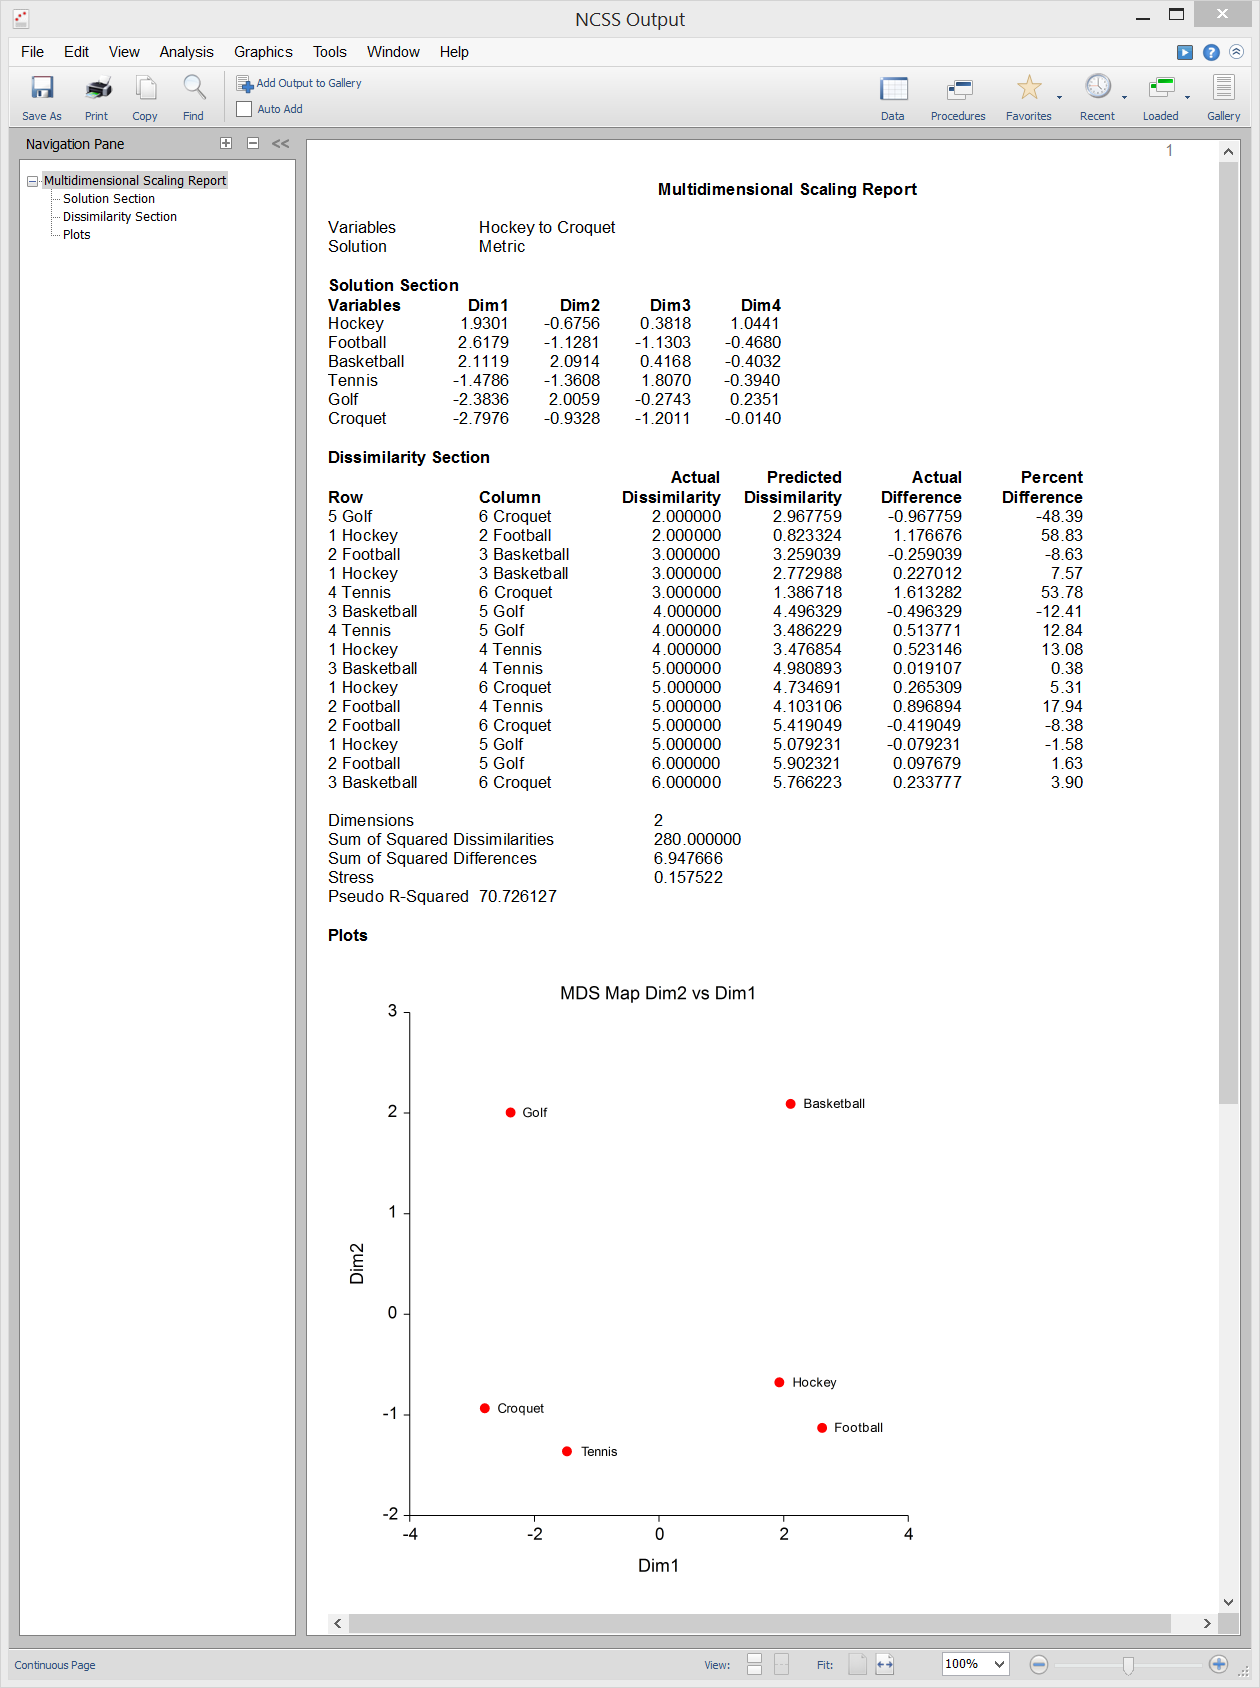
[Documentation PDF]Multidimensional Scaling (MDS) is a technique that creates a map displaying the relative positions of a number of objects, given only a table of the distances between them. The map may consist of one, two, three, or more dimensions. The procedure calculates either the metric or the non-metric solution. The table of distances is known as the proximity matrix. It arises either directly from experiments or indirectly as a correlation matrix. The program offers two general methods for solving the MDS problem. The first is called Metric, or Classical, Multidimensional Scaling (CMDS) because it tries to reproduce the original metric or distances. The second method, called Non-Metric Multidimensional Scaling (NMMDS), assumes that only the ranks of the distances are known. Hence, this method produces a map which tries to reproduce the ranks. The distances themselves are not reproduced.
Sample Output
