Description:
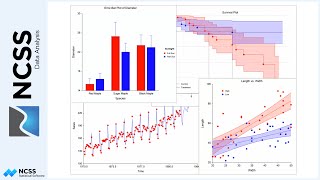
In this session, we will discuss how groups are displayed in NCSS plots. We will also examine symbol selection.
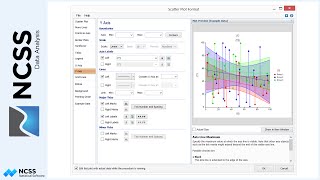
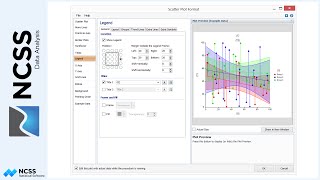
We will use the scatter plot format window as an example representing other NCSS plots with groups. The scatter plot format window is opened by clicking the plot format button of the scatter plots procedure, or, on the plots tab of any other procedures that provide a scatter plot, such as the regression procedures.
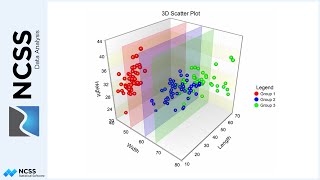
Suppose we have three groups of points. We can set the example data to three groups to give a preview of this scenario.
The default is a separate symbol for each group. If you wish to have all groups have the same symbol, you can set the symbol format mode to ‘Single Symbol’. You may also wish use ‘Single Symbol’ mode if you have only one group, although this is not required. In our case, we want to have a separate symbol for each of the three groups.
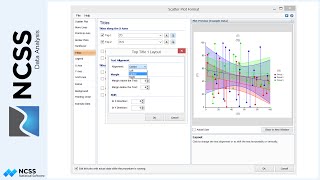
With the default settings, the fills associated with the symbols carry over into the other attributes of the plot that are also grouped. Notice the colors of the regression lines follow the colors of the symbols. Changing to the single line format mode makes all the lines have a single format. Or, the format of each line may be specified individually.
Other lines associated with the data behave similarly. For example, if we add confidence limit lines, the default fill setting for those lines is to match the symbol fills. Further, if we include the fill between the confidence limits, it is tied, by default, to the confidence limit line fill.
So, if the plot format is left at the default settings, the fills of all the groups are tied back to the symbol fills. But you can go in and customize group lines and fills to be different from the symbol fills if desired.
Border plot colors are also tied to the symbol fills by default, but may be separated from the symbol fills if desired.
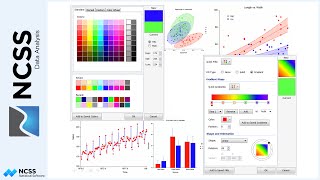
As for specifying the symbols themselves, the drop-down gives some basic choices, or a custom symbol can be formed. A wide variety of symbol shapes is available. Even a word or phrase may be used as the group symbol. The symbol transparency may be useful when a very large dataset is involved or to see overlapping points. The size and border of symbols may also be specified.
At any time, a favorite symbol may be added to the saved symbols for later use.
The ‘Change All’ button is very useful when you wish to change a particular attribute of the symbols for all the groups at once. For example, if you want to make all the symbols larger, you can easily do this with the proper ‘Change All’ selection. The ‘Change All’ button also makes changing all the shapes or transparencies easy, while leaving the fill colors the same.
The ‘Symbol Size Relative Bounds’ are only used when the size of the symbol is associated with the data. These bounds specify how small and how large the symbols will get when this is the case.
If you wish to set a group of symbols to be the default symbols, you can do so with the ‘Set as Default Symbols’ button. If you do this, the symbols throughout the program will default to this set.
The File menu offers additional valuable options for saving and loading sets of symbols from files. You can even import or export just the fills of the symbols.
This concludes our discussion of groups and symbols.