Curve Fitting in NCSS
Using NCSS as curve fitting software by using the several tools available for finding and modeling the best (often nonlinear) fit of a response (Y) to one or more independent variables (X’s). Each curve fitting procedure is easy-to-use and validated for accuracy. Use the links below to jump to a specific online curve fitting topic. To see how these tools can benefit you, we recommend you download and install the free trial of NCSS. Jump to:- Introduction
- Technical Details
- General (Custom and Preset) Model Fit - Y vs One X
- Polynomial Model Search - Y vs One X
- Polynomial Model Fit - Y vs One X
- Polynomial Model Search - Y vs Multiple X's
- Polynomial Model Fit - Y vs Multiple X's
- Sum of Functions (of X) Model Fit - Y vs One X
- Nonlinear Regression
- Function Plots
- Scatter Plot Matrix for Curve Fitting
Introduction
[Documentation PDF]Curve fitting refers to finding an appropriate mathematical model that expresses the relationship between a dependent variable Y and a single independent variable X (or group of X's) and estimating the values of its parameters using nonlinear regression.
Technical Details
This page provides a general overview of the capabilities of NCSS as curve fitting software for analysis. If you would like to examine the formulas and technical details relating to a specific NCSS procedure, click on the corresponding '[Documentation PDF]' link under each heading to load the complete procedure documentation. There you will find formulas, references, discussions, and examples or tutorials describing the procedure in detail.General (Custom and Preset) Model Fit - Y vs One X
[Documentation PDF]This procedure is a general purpose curve fitting procedure providing many new technologies that are not readily available in most other statistical packages. Our online curve fitting software is pre-programmed to fit over forty common mathematical models including growth models like linear-growth and Michaelis-Menten. It also fits many approximating models such as regular polynomials, piecewise polynomials and polynomial ratios. In addition to these pre-programmed models, it also fits your custom-written models. The General (Custom and Preset) Model Fit - Y vs One X procedure includes several innovative features. Our online curve fitting software can fit curves to several groups of data simultaneously. This procedure compares fitted models across groups using graphics and numerical tests such as an approximate F-test for curve coincidence, and a computer-intensive randomization test that compares curve coincidence and individual parameter values. Further, this routine computes bootstrap confidence intervals for parameter values, predicted means, and predicted values using the latest computer-intensive bootstrapping technology.
Setup Window for the General (Custom and Preset) Model Fit - Y vs One X Procedure

Example Output for the General (Custom and Preset) Model Fit - Y vs One X Procedure

A Curve Fitting Plot from the General (Custom and Preset) Model Fit - Y vs One X Procedure

Polynomial Model Search - Y vs One X
[Documentation PDF]This procedure searches through hundreds of potential curves looking for the model that best fits your data. The procedure is heuristic in nature, but does well at selecting appropriate models. A general class of models called the ratio of polynomials provides a wide variety of curves on which a search can be based. Normally, fitting these models is a slow, iterative process. However, using a heuristic shortcut, an approximate solution may be found very quickly so that a large number of models may be searched in a short period of time. After the best fitting model is found, you can use the Ratio of Polynomials Fit - One Variable procedure to provide a detailed analysis of the model. For each model, various transformations of X and Y can be tried. This expands the number of models that may be tried to several hundred. The general formula for the ratio of polynomials model fit is
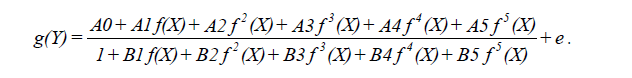 Here g(Y) and f(X) represent power transformations of Y and X such as LOG(X), SQRT(X), etc. The parameters A0, A1, A2, ..., B5 are constants that are estimated from the data. The value e represents the error or residual of the observations. By setting some constants to zero, various simplified models are obtained. For example, if only A0 and A1 are nonzero, the familiar linear model, Y=A0+A1X+e, is obtained.
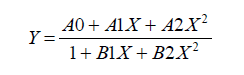
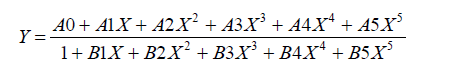
Polynomial Model Fit - Y vs One X
[Documentation PDF]This program fits a model that is the ratio of two polynomials of up to fifth order. Examples of this type of model are:
 and
and
 These models approximate many different curves. They offer a much wider variety of curves than the usual polynomial models. Since these are approximating curves and have no physical interpretation, care must be taken outside the range of the data. You must study the resulting model graphically to determine that the model behaves properly between data points.
Usually you would use the Polynomial Model Fit - Y vs One X procedure first to find an appropriate model and then fit that model with this procedure.
These models approximate many different curves. They offer a much wider variety of curves than the usual polynomial models. Since these are approximating curves and have no physical interpretation, care must be taken outside the range of the data. You must study the resulting model graphically to determine that the model behaves properly between data points.
Usually you would use the Polynomial Model Fit - Y vs One X procedure first to find an appropriate model and then fit that model with this procedure.
Example Plots from the Polynomial Model Fit - Y vs One X Procedure


Polynomial Model Search - Y vs Multiple X's
[Documentation PDF]This procedure is similar to the Polynomial Model Search - Y vs One X procedure, except that it is more general in that it models up to four independent variables. This procedure searches through hundreds of potential curves to find the best fit using a heuristic algorithm. After the best fitting model is found, you can use the Polynomial Model Fit - Y vs Multiple X's procedure to further examine the model.
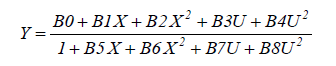
Polynomial Model Fit - Y vs Multiple X's
[Documentation PDF]This procedure fits a model that is the ratio of two polynomials of up to fifth order. Instead of a single independent variable, these polynomials may involve up to four independent variables (U, V, W, and X). An example of this type of model is:
 Usually you would use the Polynomial Model Search - Y vs Multiple X's procedure first to find an appropriate model and then fit and further analyze that model with this procedure.
Example Plots from the Polynomial Model Fit - Y vs Multiple X's Procedure


Sum of Functions (of X) Model Fit - Y vs One X
[Documentation PDF]This procedure fits models that are the ratio of two linear expressions. The general form of a model is:
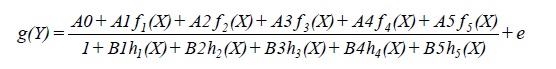 where f(X), g(Y), and h(X) are standard functions such as SIN(X), LN(X+1), SQRT(X/2), etc. The A0, A1, ..., B5 are constants (parameters) to be estimated from the data.
These models approximate many different curves. They offer a much wider variety of curves than the usual polynomial models.
where f(X), g(Y), and h(X) are standard functions such as SIN(X), LN(X+1), SQRT(X/2), etc. The A0, A1, ..., B5 are constants (parameters) to be estimated from the data.
These models approximate many different curves. They offer a much wider variety of curves than the usual polynomial models.
Example Plots from the Sum of Functions (of X) Model Fit - Y vs One X Procedure


Nonlinear Regression
[Documentation PDF]A nonlinear regression procedure is also available in NCSS for nonlinear curve fitting. Click here to go to the Nonlinear Regression procedure description.
Function Plots
[Documentation PDF]Function plots can be used to view a plot of a desired mathematical function of X. Some of the available functions are Sin, Cos, Exponent, Log, Tan, Square Root, and so on.
An Example Plot from the Function Plots Procedure

Scatter Plot Matrix for Curve Fitting
[Documentation PDF]One of the first tasks in curve fitting online is to graphically inspect your data. This procedure allows you to view scatter plots of various transformations of both X and Y. Usually, your first choice would be to look for transformations of X and Y that yield a straight line. These plots are shown in matrix format. The available transformations for both X and Y are the inverse, the inverse of the square, the inverse of the square root, the natural log, the square root, and the square.
Scatter Plot Matrix for Curve Fitting Example
