Survival Analysis in NCSS
NCSS Statistical Analysis Software contains a variety of tools for analyzing survival data that are easy-to-use and carefully validated for accuracy. Use the links below to jump to the survival analysis topic you would like to examine. To see how these tools can benefit you, we recommend you download and install the free trial of NCSS. Jump to:- Introduction
- Technical Details
- Kaplan-Meier Curves (Logrank Tests)
- Life-Table Analysis
- Cumulative Incidence
- Distribution Fitting
Introduction
Survival analysis is the study of the distribution of life times. That is, it is the study of the elapsed time between an initiating event (birth, start of treatment, diagnosis, or start of operation) and a terminal event (death, relapse, cure, or machine failure). The data values are typically a mixture of complete (terminal event occurred) and censored (terminal event has not occurred) observations. From the data values, the survival analyst makes statements about the survival distribution of the failure times. This distribution allows questions about such quantities as survivability, expected life time, and mean time to failure to be answered.Technical Details
This page is designed to give a general overview of the capabilities of NCSS Statistical Analysis Software for survival analysis. If you would like to examine the formulas and technical details relating to a specific NCSS procedure, click on the corresponding '[Documentation PDF]' link under each heading to load the complete procedure documentation. There you will find formulas, references, discussions, and examples or tutorials describing the procedure in detail.Kaplan-Meier Curves (Logrank Tests)
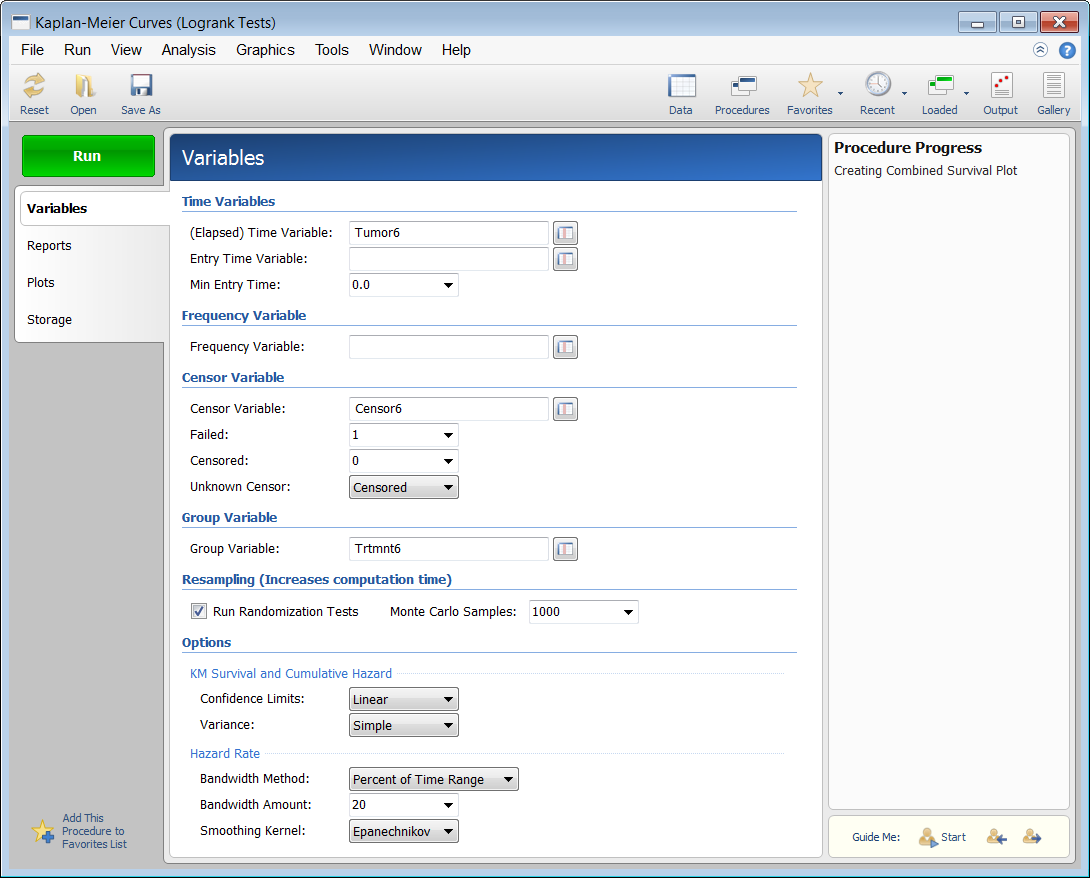
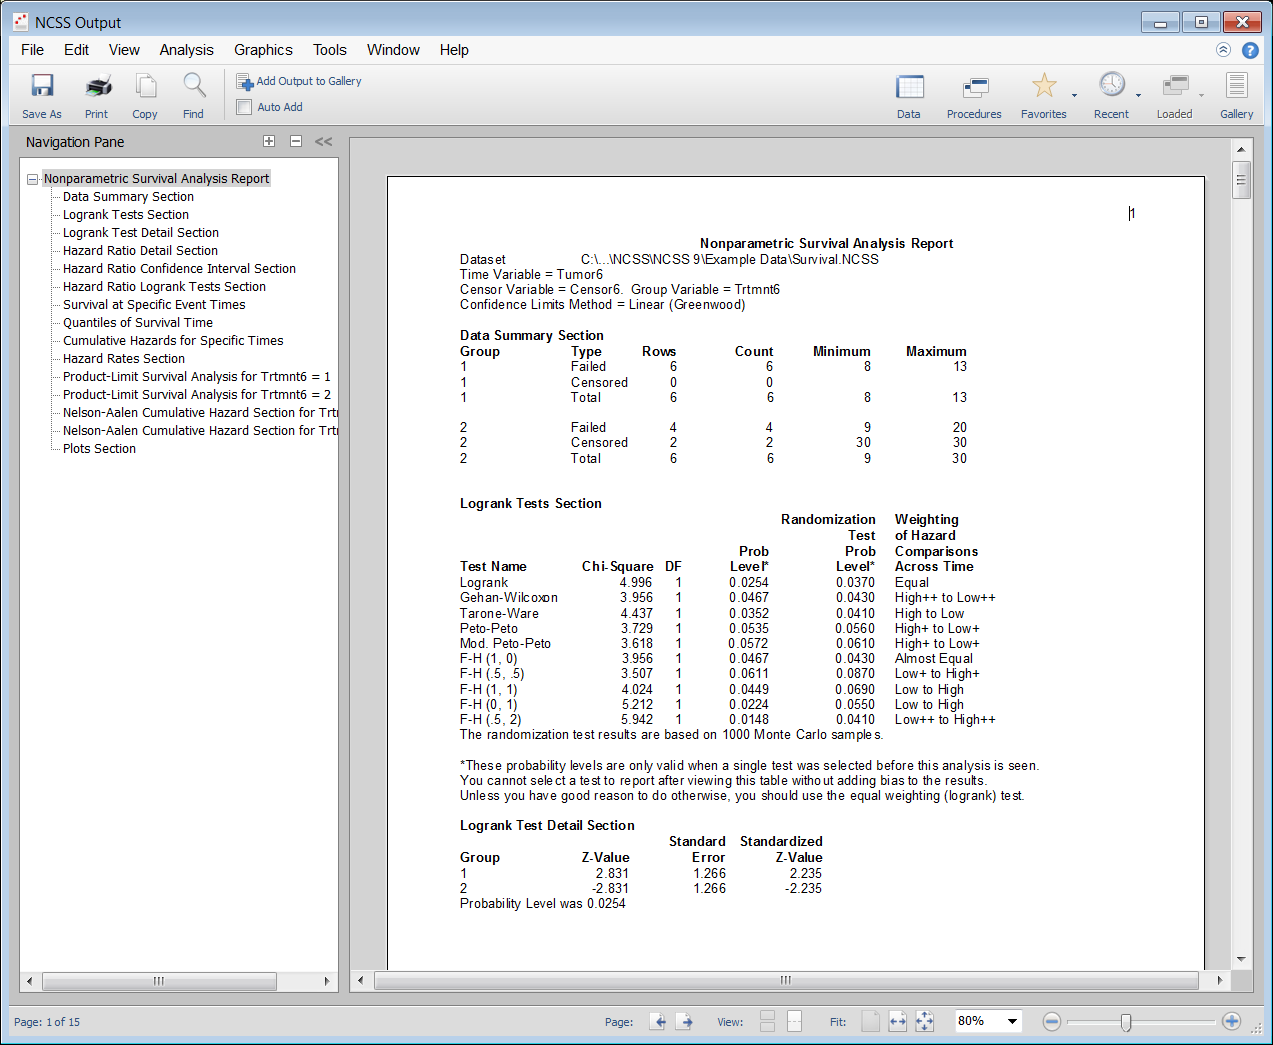
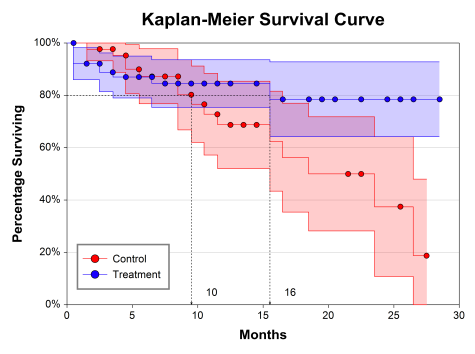
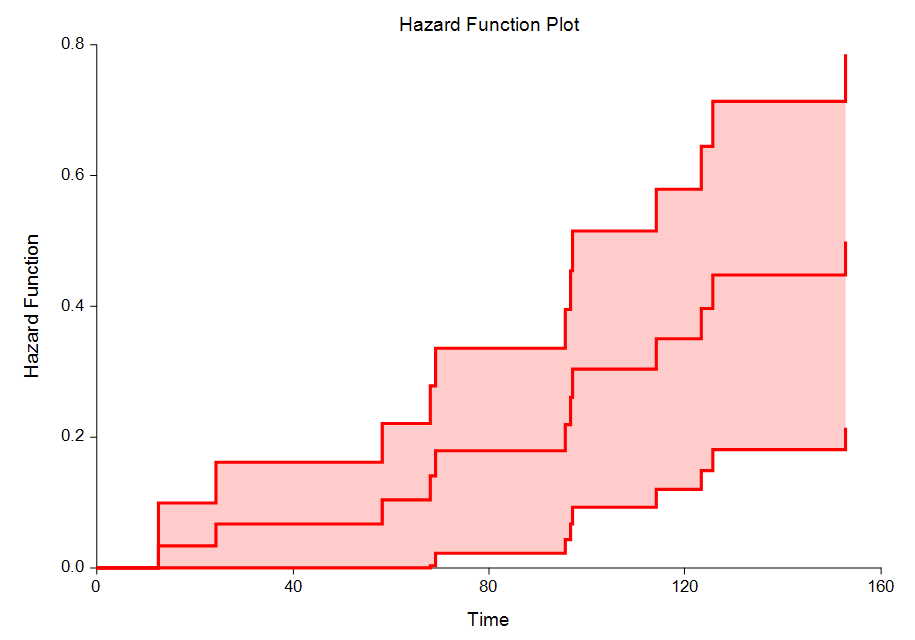
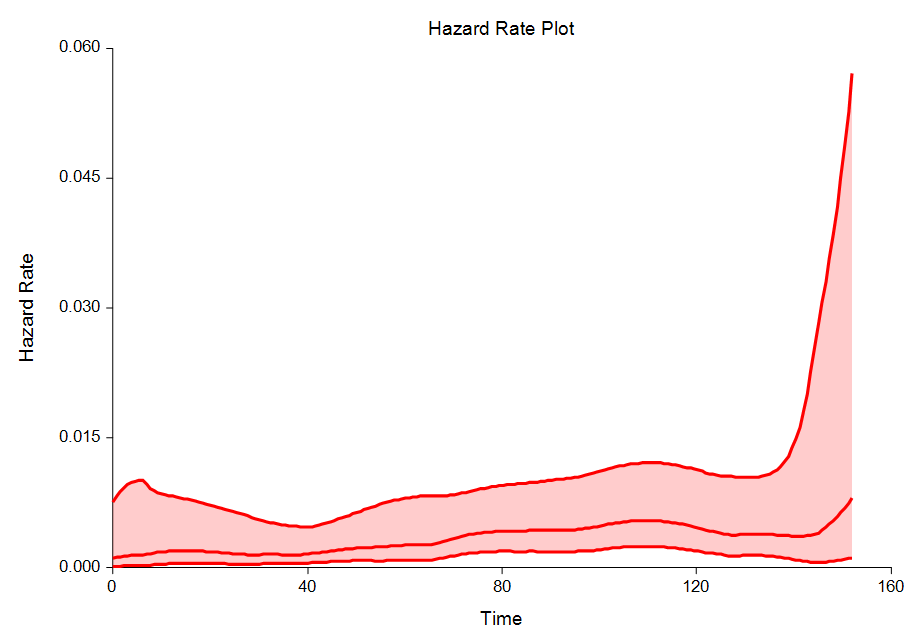
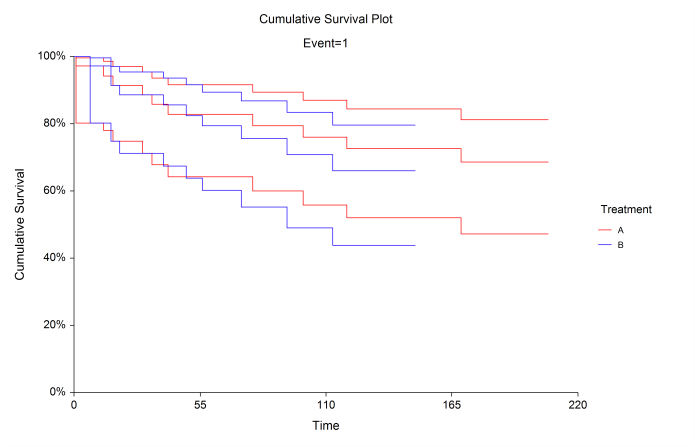
[Documentation PDF]This procedure computes the nonparametric Kaplan-Meier and Nelson-Aalen estimates of survival and associated hazard rates. It can fit complete, right censored, left censored, interval censored (readout), and grouped data values. It outputs various statistics and graphs that are useful in reliability and survival analysis. It performs several logrank tests and provides both the parametric and randomization test significance levels. This procedure also computes Restricted Mean Survival Time (RMST) and Restricted Mean Time Lost (RMTL) statistics, along with pairwise difference and ratio comparisons among groups.
Kaplan-Meier Curves (Logrank Tests) Procedure Window
Kaplan-Meier Curves (Logrank Tests) Output
Some Plots in a Kaplan-Meier Curves (Logrank Tests) Analysis
Life-Table Analysis
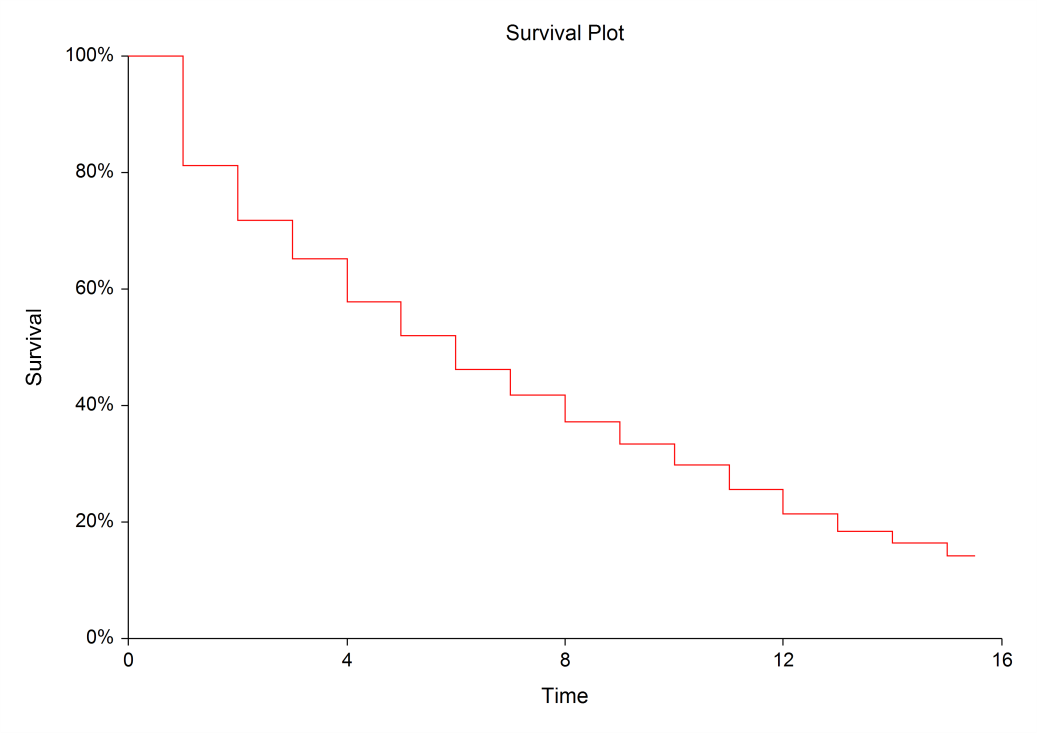
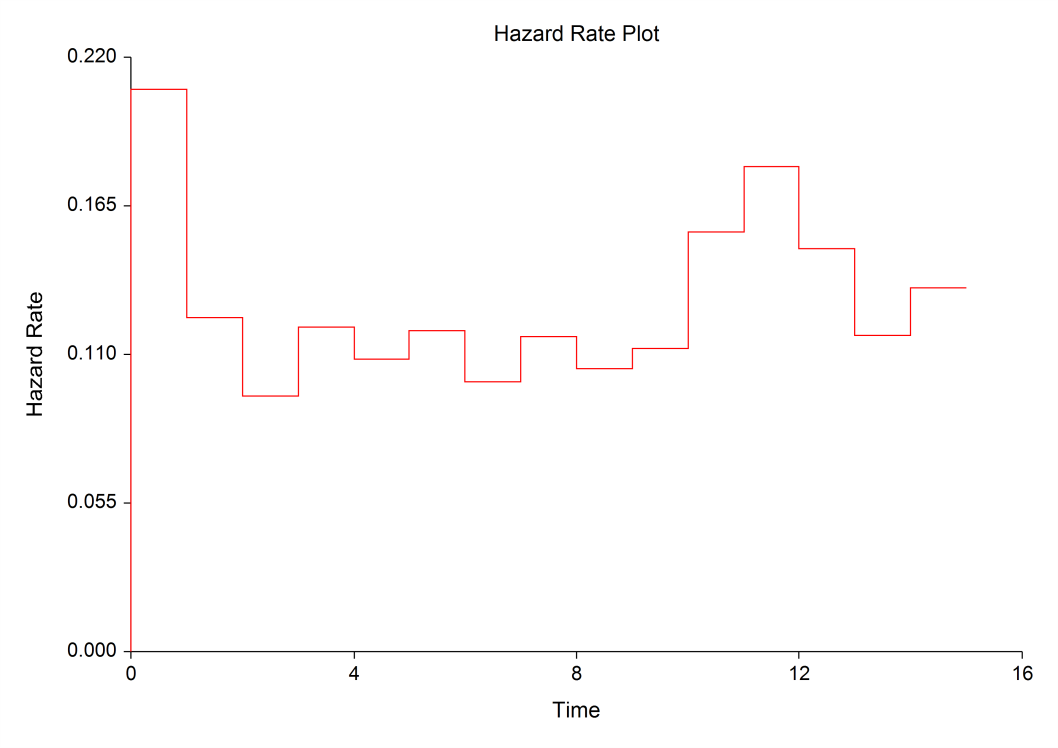
[Documentation PDF]A life table presents the proportion surviving, the cumulative hazard function, and the hazard rates of a large group of subjects followed over time. The analysis accounts for subjects who die (fail) as well as subjects who are censored (withdrawn). The life-table method competes with the Kaplan-Meier product-limit method as a technique for survival analysis. The life-table method was developed first, but the Kaplan-Meier method has been shown to be superior and with the advent of computers is now the method of choice. However, for large samples, the life-table method is still popular in that it provides a simple summary of a large set of data.
Some Plots in a Life-Table Analysis
Cumulative Incidence
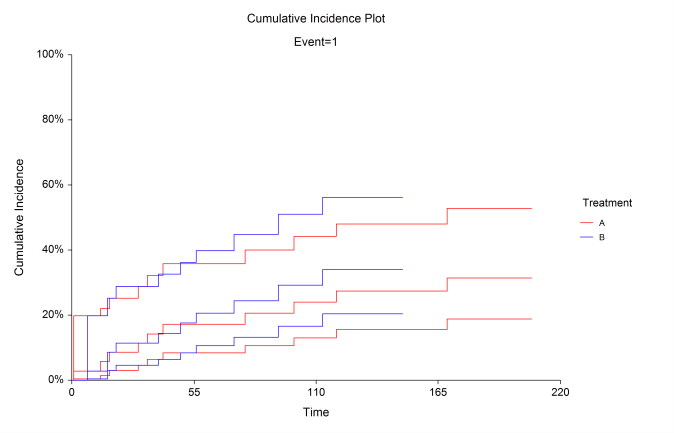
[Documentation PDF]This procedure calculates nonparametric, maximum-likelihood estimates, and confidence limits of the probability of failure (the cumulative incidence) for a particular cause in the presence of other causes. This is sometimes called the problem of competing risks. An often used, though incorrect, approach is to treat all failures from causes other than that of interest as censored observations and estimate the cumulative incidence using 1 - KM (Kaplan-Meier estimate). The problem with this approach is that it makes the incorrect assumption that the probability of failing prior to time t from other causes is zero. This leads to overestimation of the cumulative incidence. This overestimation can be quite substantial if there are many failures from other causes in the data. This procedure also calculates Gray’s Test (K groups) and Pepe and Mori’s Test (2 groups) for comparing groups. Gray's Test compares the weighted averages of the subdistribution hazards across groups for the event of interest. Pepe and Mori’s Test compares the cumulative incidence functions (CIF’s) directly for the event of interest.
Some Plots in a Cumulative Incidence Analysis
Distribution Fitting
[Documentation PDF (Beta)][Documentation PDF (Weibull)]
[Documentation PDF (Gamma)]
Three survival/reliability analysis distribution fitting procedures are available in NCSS Statistical Analysis Software:
- Beta Distribution Fitting
- Weibull Distribution Fitting
- Gamma Distribution Fitting
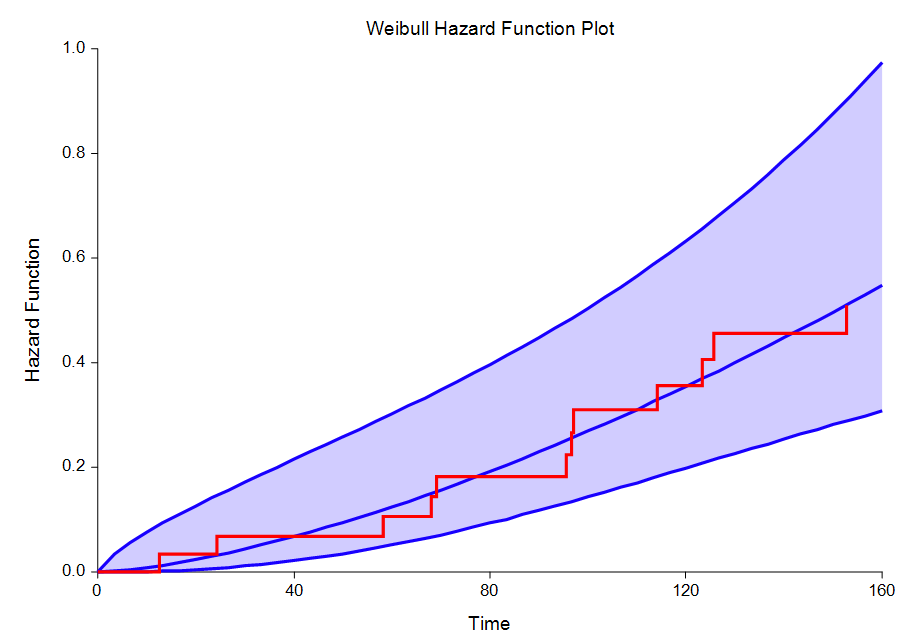
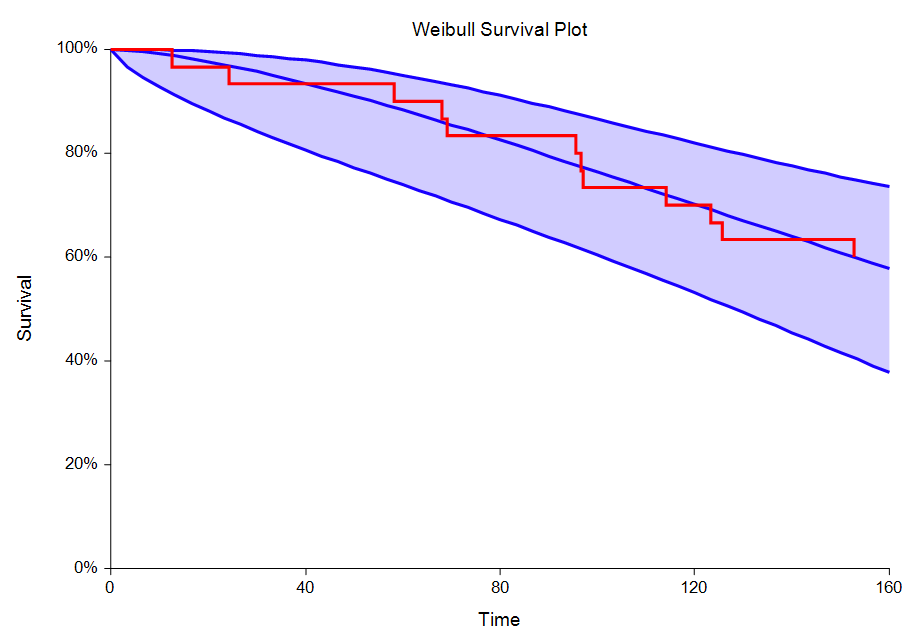
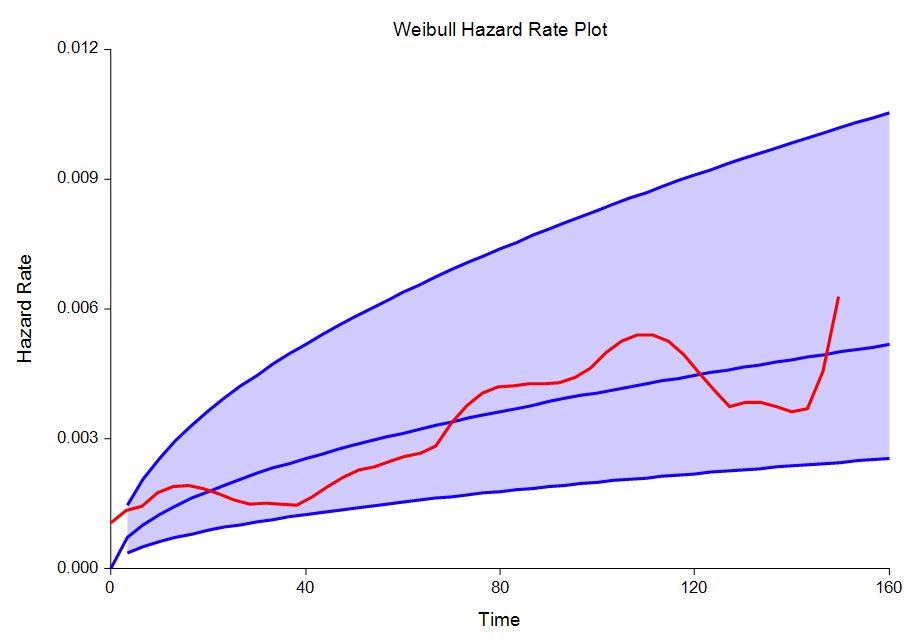
Some Plots in a Distribution Fitting Analysis
