Description:
Suppose a study is planned to investigate whether a new intervention will decrease systolic blood pressure. For various reasons, the researchers decide to administer the intervention to whole clusters (or clinics), rather than randomize the treatment to individuals within each cluster. Experience has shown that the clinics can be separated according to size – as small, medium, and large.
For the small clinics, which cover about 15% of eligible subjects for treatment, the average number of subjects will be 7, with a clinic-size standard deviation of 3.1.
Medium-sized clinics account for roughly 25% of patients, and have an average of 18 patients per clinic, with a clinic-size standard deviation of 5.2.
The large clinics service the remaining 60% of eligible subjects, and average 54 eligible subjects per clinic, with a clinic-size standard deviation of 18.6.
The number of clinics receiving the control will be the same as the number of clinics under the treatment.
Prior studies indicate a mean score of 124 for the control, with a standard deviation of 23 and an intra-cluster correlation of 0.03. The researchers wish to compare the necessary sample sizes for a range of assumed blood pressure differences between -10 and -6. They also want to consider an intra-cluster correlation value of 0.06.
A one-sided test will be used, with alpha equal to 0.025, and a required power of 90%.
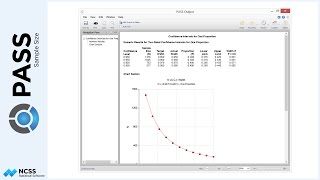
The numeric report gives the total number of individuals needed, as well as the corresponding number of clusters.
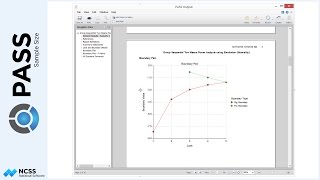
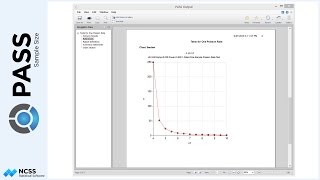
The sample size plot gives a visual representation of how the intra-cluster correlation and the underlying true blood-pressure difference affect sample size.
To illustrate how the total sample size relates to the expected number of clusters, we will examine the final scenario, corresponding to a blood pressure decrease of 6, and an intra-cluster correlation coefficient of 0.06. The resulting total sample size is 2,151 subjects.
The subjects are evenly split among the two treatments.
Then, the subjects are divided according to the percentages into the small, medium, and large clinics.
Next, the number of clinics needed for each group of subjects is determined.
When all the clinics are added up, the total is 50 clinics per treatment, or 100 total.
This matches the expected number of clusters shown in the output.