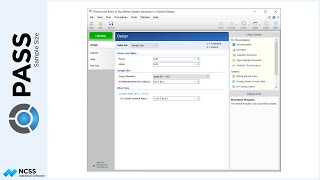
Description:
The Group-Sequential Tests for Two Proportions procedure can be used to determine power, sample size and/or boundaries for group-sequential Z-tests of the difference between two proportions.
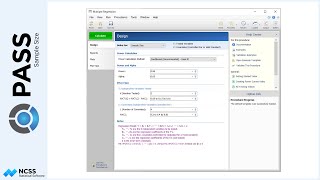
This procedure is used as the planning tool for determining sample size and initial boundaries. Stage data, as it is obtained, can be evaluated using the companion procedure Group-Sequential Analysis for Two Proportions, found in NCSS. The companion procedure also gives the option for sample-size re-estimation and updated boundaries for current-stage information. In that procedure, simulation can be used to evaluate boundary-crossing probabilities given the current stage results.
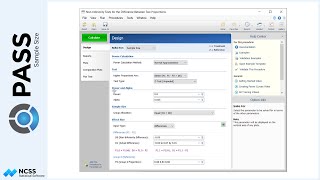
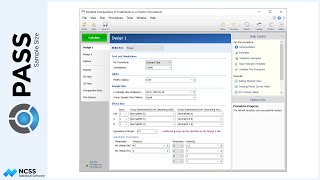
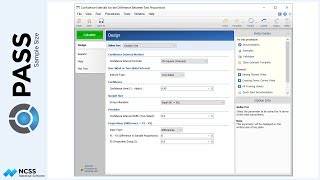
Suppose a childbirth study is to be conducted to determine whether a new approach during labor results in a lower proportion of C-sections than the standard techniques. The response for each patient is C-section or no C-section. A one-sided test with alpha equal to 0.025 is used. The Z-Test will use unpooled variance estimation with no continuity correction.
The new approach is assigned to Group 1, and the standard is assigned to Group 2.
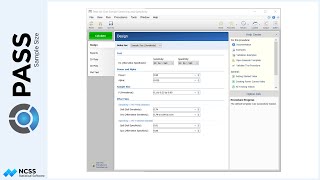
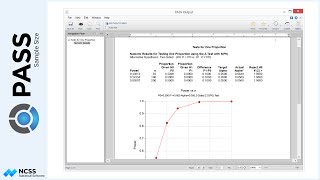
The design calls for five equally spaced stages if the final stage is reached. A power of 90% is needed. The assumed caesarian proportion for the standard approach is 0.31. Researchers wish to examine the sample sizes needed for new approach proportions of 0.21, 0.24, and 0.27. Both efficacy and non-binding futility boundaries are intended. The efficacy spending function used is the O’Brien-Fleming analog. The Gamma beta-spending function with gamma parameter 1.5 is used for futility.
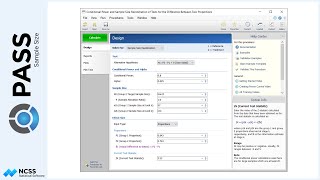
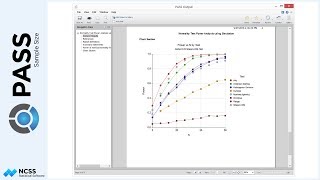
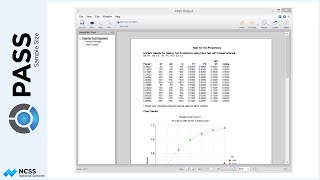
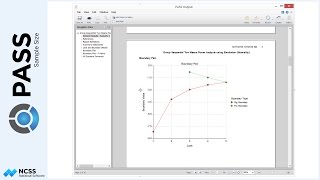
The first report shows the anticipated boundaries.
There are several options for the x-axis for displaying the boundaries graphically.
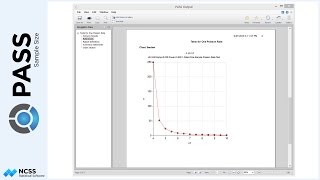
The Information Report gives the target information for each stage, as well as the sample sizes and proportions used to calculate those informations.
The alpha- and beta-spending sections show how alpha and beta are anticipated to be spent across the stages.
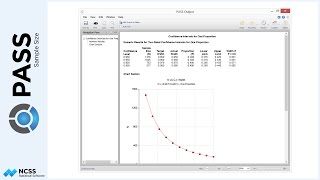
The boundary probability sections give the estimated probabilities of crossing each of the boundaries.
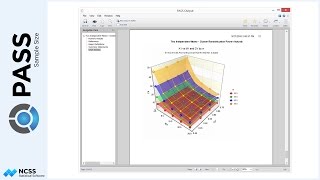
The final reports show how the different proportions affect the needed sample size.
We recommend that you view the companion video for Group-Sequential Analysis for Two Proportions in NCSS. That video shows how to use sample size re-estimation and other stage analyses, as data are collected.