Description:
Two examples of 3-level hierarchical designs are: clinics with doctors with patients, and schools with classrooms with students. In a study for comparing two groups, the randomization assignment to treatment can occur at any of the three levels.
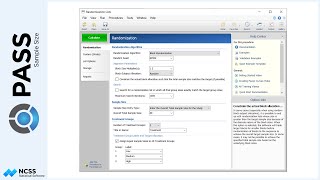
For level-1 randomization, treatments are randomly assigned at the lowest level. For example, students within a classroom are randomly assigned to the two treatments.
For level-2 randomization, treatments are randomly assigned at the middle level. For example, whole classrooms are randomly assigned to one of the treatments.
For level-3 randomization, the highest-level units are randomly assigned to treatments. For example, each school, with all students of all classes in that school, would receive the one treatment that is randomly assigned to that school.
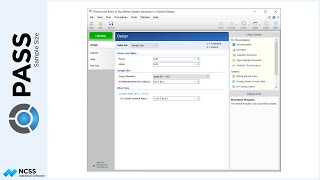
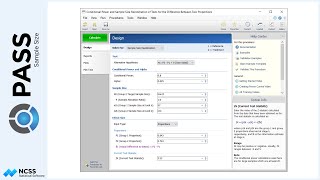
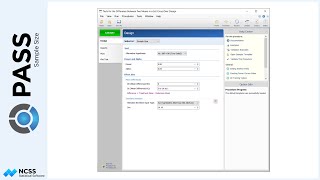
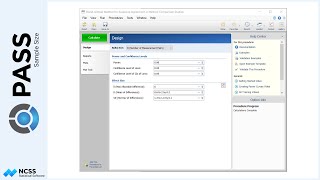
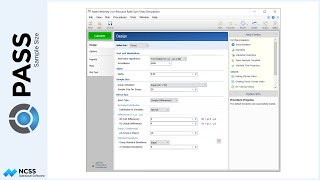
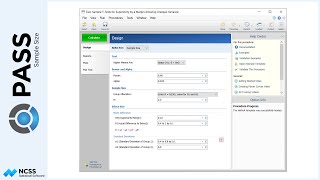
In PASS, there is a procedure for comparing two means for each of the 3 levels of randomization.
In this video, we will consider level-2 randomization.
Suppose that a new medication has been developed to reduce the healing time following a specific, routine, outpatient surgery.
The study is to be conducted across various outpatient facilities, each with their own doctors and patients.
For various reasons, the researchers plan to randomize the doctors to the treatments, rather than randomizing the whole facilities, or the patients individually.
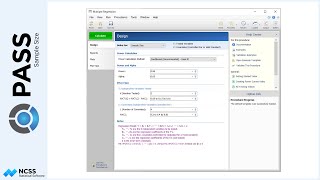
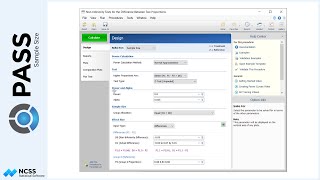
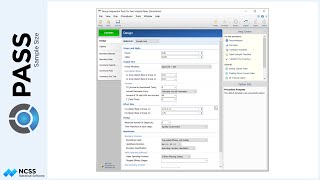
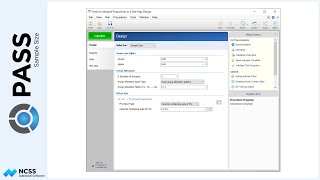
The researchers wish to determine the number of doctors that will be needed at each facility to achieve 90% power to detect a difference in average healing times.
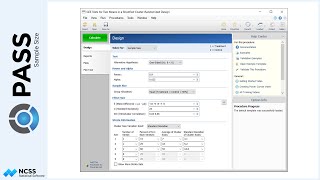
The number of facilities considered will be 3, 4, and 5.
Counts of 5, 7, and 9 patients per doctor will be assumed.
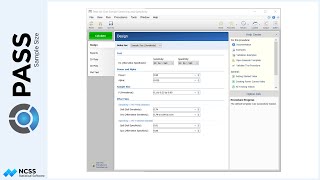
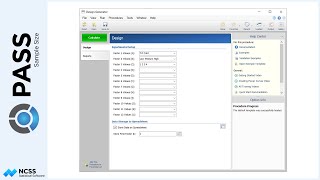
A mean difference of 6 days will be assumed, with a range of standard deviations between 20 and 30.
The correlations among facilities and among doctors are based on estimates from previous studies.
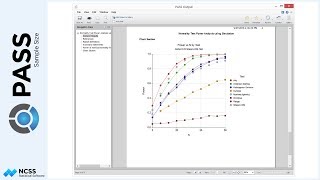
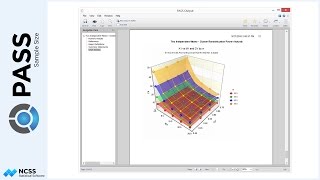
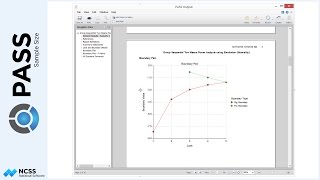
Due to the number of varying parameters, the analysis will be paused for a live rotation of the 3D plot of the results.
The live rotation 3D plot gives us a look at the effect of all varying parameters in a single plot.
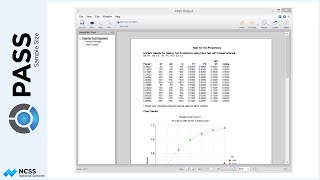
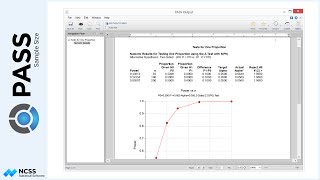
The first report shows the number of doctors needed from each outpatient facility to achieve the desired power.
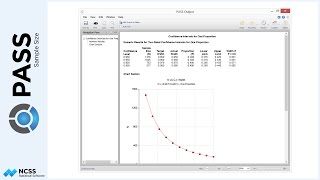
The various plots can be used to visually compare the effect of the parameter values.