Description:
Ratio studies are regularly used to evaluate the quality and accuracy of appraisal. Ratio studies provide a set of statistics describing the distribution of the ratios, such as central tendency and spread, as well as summaries of uniformity, such as horizontal and vertical equity.
The basic measure in ratio studies is the ratio of the appraised value to the sale price. In this video, we will explore how to obtain a variety of statistics that summarize a group of appraisal ratios.
Often there are natural groupings that are compared for equity in appraisal. Examples of such groupings are neighborhood, property type, size, age, condition, quality rating, and style. Several tools are available in NCSS for evaluating horizontal equity among such groups.
NCSS may also be used to analyze vertical equity, which is analyzing whether ratios are similar across the whole range of appraisal values.
A typical dataset for a ratio study has a column of appraised values and a corresponding column of known sale prices. In NCSS, a column of ratios could be used instead, but we will use a two-column dataset in this example.
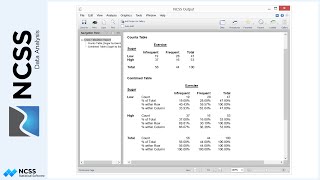
In this example dataset, there are 748 properties from five neighborhoods. The column identifying the neighborhood is called Region.
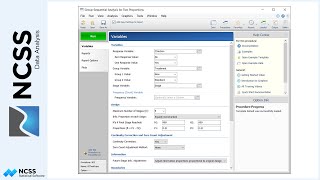
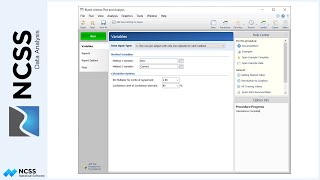
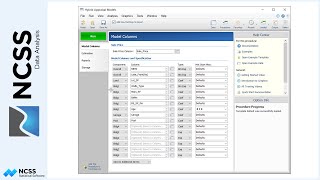
To summarize the ratios of the appraised values to the known sale prices, we first open the Appraisal Ratio Studies procedure from the menu.
Since we have a single appraisal column and a single sale price column, we select that option.
The appraisal and sale price columns are then identified.
For horizontal grouping analysis, we will break up the summaries by Region.
On the Summary Reports tab, we will check the boxes for the summary statistics reports and for normality assumptions.
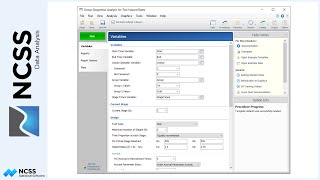
On the Horizontal Equity tab, we will check the boxes for a couple of plots, as well as for the horizontal equity tests.
On the Vertical Equity tab, we will check the price-related bias scatter plot checkbox, as well as the box for price-related bias details.
Running the procedure generates the output corresponding to the selected options.
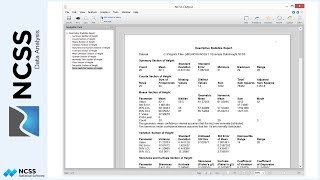
The first reports give a variety of useful ratio summary statistics. Definitions are also given below some of the output sections.
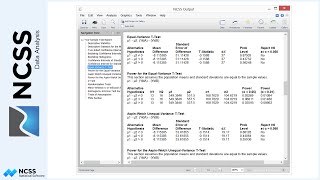
The Normality Assumption section helps determine which summary statistics best represent the distribution of the ratios. The red P-values indicate non-normality. For non-Normal distributions, the median is a better ratio summary statistic than the mean.
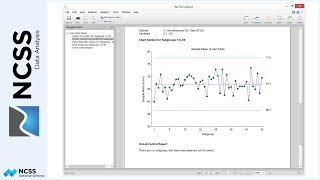
Histograms and Normal Probability Plots can also be used to examine departures from Normality. On a probability plot, a Normal distribution is indicated by the points roughly following the diagonal line.
The Normality tests and plots show that the Fox Knoll and Hastings Heights neighborhoods tend toward Normality, while the remaining neighborhoods and the combined group is non-normal.
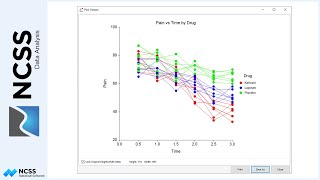
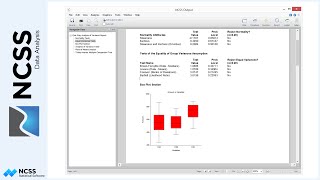
To examine horizontal equity, the five neighborhoods are compared. A box plot and a dot plot give a rough visual comparison. The differences are not stark, but the Freedom Manor neighborhood seems to have a slightly larger spread and a slightly lower median.
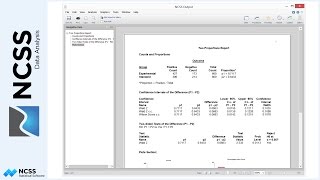
The assumptions tests indicate that normality should not be assumed, nor should equal variance.
This leads us to use the Kruskal-Wallis Rank Test to determine if the medians among the five regions are equal. A low P-value indicates that the medians are not equal. It appears that the Freedom Manor ratios are a bit lower than the other four regions. In short, there is not horizontal equity.
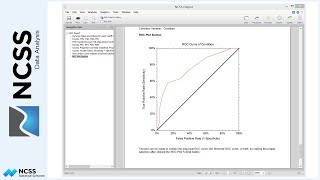
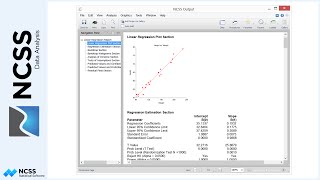
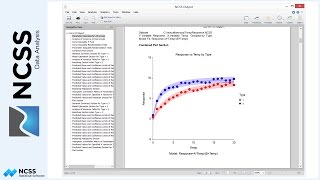
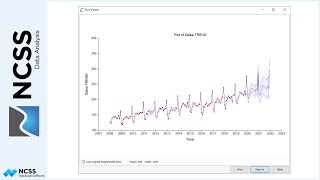
The price-related bias plots and statistics can be used to assess vertical equity, which, again, is whether or not ratios are similar across the whole range of appraisal values.
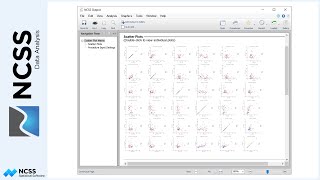
The price-related bias scatter plots give a visual representation of the vertical bias. The greater the slope, the greater the indication of vertical bias.
The price-related bias details report gives tests of whether the price-related bias slope is significantly different from zero. For slopes significantly different from zero there is a meaningful interpretation of the slope. For example, for the Fox Knoll region, the price-related bias is 0.0415 and the test indicates the slope is significantly different from zero. The interpretation may be made that for a doubling in property value, there is approximately a 4.15% increase in ratio. The Freedom Manor region shows an even more pronounced bias. For these two regions, higher valued properties are valued relatively higher than lower valued properties.