Description:
The Group-Sequential Analysis for Two Proportions procedure is used to test the difference of two proportions in stages (sometimes called looks or interim analyses) using group-sequential methods. Unless the stage boundaries are entered directly, the stage boundaries are defined using a specified spending function. One- or two-sided tests may be performed, with the option of binding or non-binding futility boundaries. Futility boundaries are specified through a beta-spending function.
Sample size re-estimation, based on current-stage sample sizes and parameter estimates, may also be obtained in this procedure.
At each stage, the current and future boundaries are calculated based on the accumulated information proportion. Conditional and predictive power for future stages is also given.
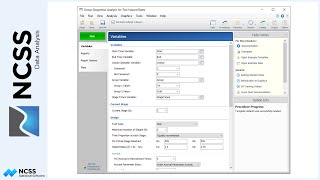
Suppose that a childbirth study is conducted to determine whether a new approach during labor results in a lower proportion of C-sections than the standard techniques. The response for each patient is C-section or no C-section. A one-sided test with alpha equal to 0.025 is used.
The new approach is assigned to Group 1, and the standard is assigned to Group 2.
The design calls for five equally spaced stages if the final stage is reached. The current stage is the 2nd stage. In the design phase, a needed power of 0.90 called for 409 patients per group if the final stage is reached, based on assumed proportions of 0.21 and 0.31 for the new and standard treatments, respectively. Both efficacy and non-binding futility boundaries are implemented. The efficacy (alpha-spending) spending function used is the O’Brien-Fleming analog. The Gamma beta-spending function with gamma parameter 1.5 is used for futility.
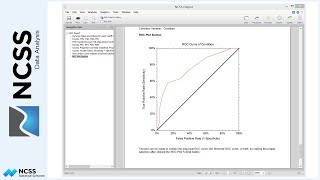
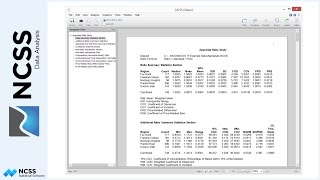
The report shows that no boundary has been crossed at the 2nd stage.
The boundaries have been adjusted to the actual proportion_ of the total information that has been accumulated.
Only a very small portion of alpha has been spent.
The conditional powers to show a difference by the end of the study are quite high, if the current difference in proportions holds.
The Boundary Probabilities sections indicate high probabilities that the efficacy boundary will be crossed in stage 3 or 4, assuming the underlying proportion difference holds.
When the data for stage 3 has been collected, the procedure is run again. The stage 3 boundaries are now calculated based on the current information proportion.
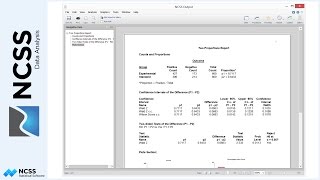
The stage 3 efficacy boundary has been crossed, indicating that the null hypothesis of equal proportions can be rejected at the 0.025 level.
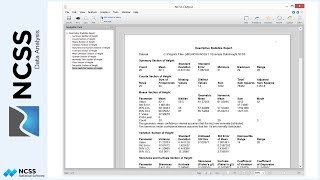
The stage results and descriptive statistics give useful summary information.