A variety of curve fitting tools are available in NCSS. Some tools focus on searching for the best model structure. Others focus on properly fitting the parameters of a desired model. Still other tools focus on curve fitting with more than one X variable. In this video, we will examine the fitting of the parameters of a growth curve model for two groups of data.
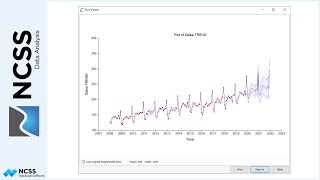
The dataset used here consists of three columns, a Y axis response column, an X value column, and a grouping column. The data are growth data.
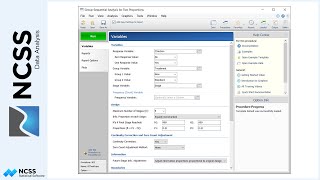
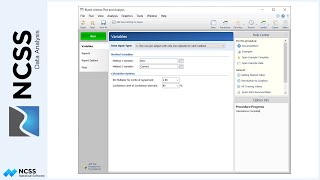
The Curve Fitting – General procedure is opened through the menus.
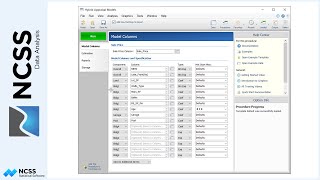
The Response column is set as the Y variable, the Temp column is set as the X variable, and Type is set for the Group Variable.
A large number of preset models are available, or a custom model may be entered.
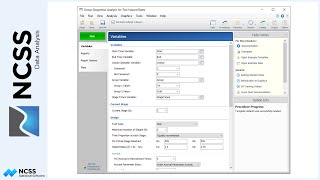
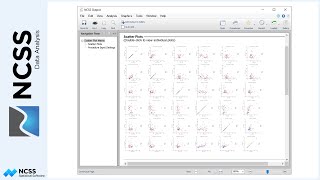
To choose the desired model, we can look at the documentation to see the general shape of many of the preset models.
We choose preset model number 8, which is a popular growth model.
We will leave the reports and plots as currently specified.
The Run button is pressed to generate the output results.
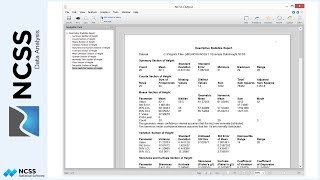
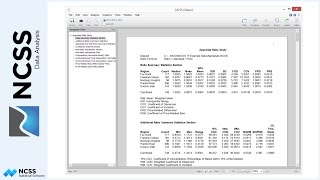
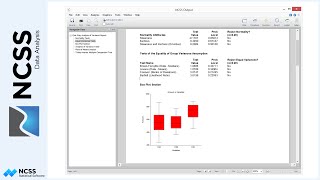
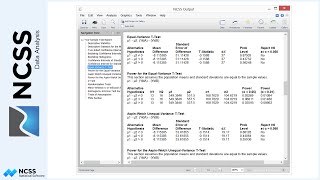
The first part of the report gives parameter estimates and summaries for each of the two types.
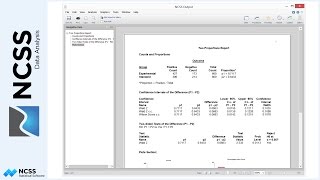
The next three sections give statistical tests for the comparison of Type 1 to Type 3. These tests indicate that there is a statistical difference between the two curves.
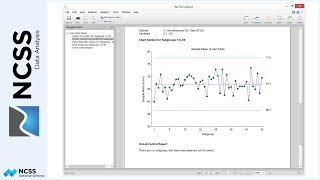
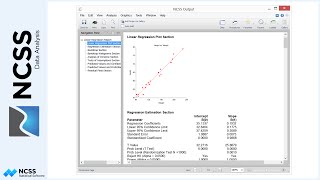
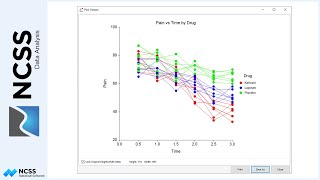
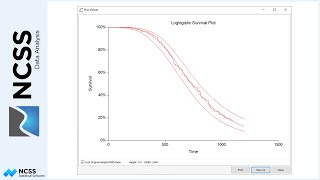
The combined plot gives a visual representation of the fitting of the two curves.
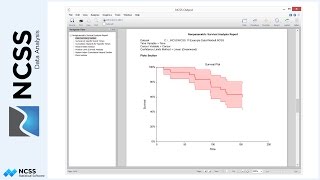
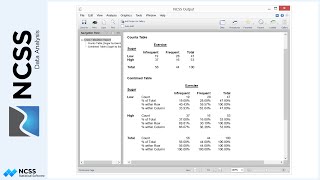
There are a number of additional reports about model estimation and assumptions for each group.
One section provides predicted response values for various values of X.