Description:
The Mixed Models procedures in NCSS cover a variety of models for comparisons of means analysis. In this video, we will look at an example based on a common longitudinal design.
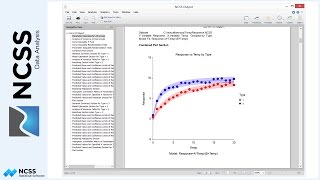
In a longitudinal design, subjects are measured more than once, usually over time. This example presents the analysis of a longitudinal design in which there is one between-subjects factor (Drug), one within-subjects factor (Time), and a covariate (Weight). Two drugs are compared to a placebo for their effectiveness in reducing pain following a surgical eye procedure.
A standard pain measurement for each patient was measured at 30 minute intervals following surgery and administration of the drug (or placebo). Six measurements, with the last at Time = 3 hours, are made for each of the 21 patients (with 7 patients per group). A blood pressure measurement of each individual at the time of pain measurement was measured as a covariate. The researchers wish to compare the drugs at a blood pressure of 140.
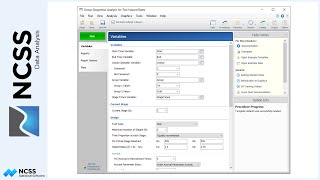
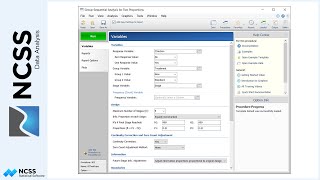
The Response is the Pain column, the subjects are the Patient column, and the Times are given in the Time column.
The between and within subject factors are specified next. Each drug treatment will be compared to both of the others. Each Time will be compared to the 30 minute time.
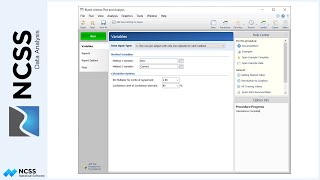
The Covariate variable is specified as Cov, and Means will be compared at a Cov value of 140.
The Interaction Model will be used.
The Maximization options are left at the default values.
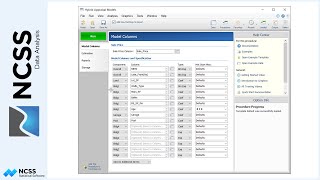
A variety of reports and plots will be included in the analysis.
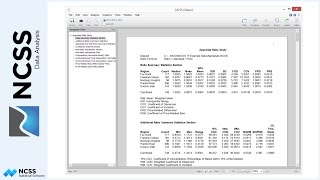
The details of each report are discussed in Example 1 of the documentation. We will highlight a few of the results here.
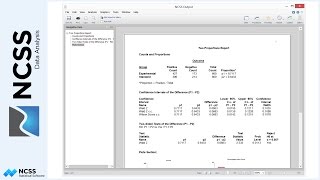
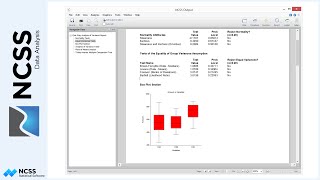
Going to the hypothesis test comparisons of interest, a raw p-value is given, as well as a Bonferroni-adjusted p-value. The individual comparisons are grouped into subsets of the fixed model terms. At a blood pressure of 140, the differences are significant for many of the comparisons.
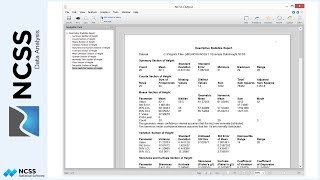
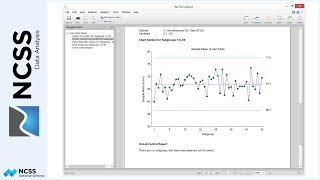
Sections showing the estimated means, at a blood pressure of 140, are given next. The numeric values are followed by the plots. The plots can aid nicely in the interpretation of the numeric reports.
Most of the remaining reports list the matrices that were used in the various comparisons.